

Abstract
OBJECTIVES
To review pharmacokinetics in obese children and to provide medication dosing recommendations.
METHODS
EMBASE, MEDLINE, and International Pharmaceutical Abstracts databases were searched using the following terms: obesity, morbid obesity, overweight, pharmacokinetics, drug, dose, kidney function test, creatinine, pediatric, and child.
RESULTS
We identified 10 studies in which the authors examined drug dosing or pharmacokinetics for obese children. No information was found for drug absorption or metabolism. Obese children have a higher percent fat mass and a lower percent lean mass compared with normal-weight children. Therefore, in obese children, the volume of distribution of lipophilic drugs is most likely higher, and that of hydrophilic drugs is most likely lower, than in normal-weight children. Serum creatinine concentrations are higher in obese than normal-weight children. Total body weight is an appropriate size descriptor for calculating doses of antineoplastics, cefazolin, and succinylcholine in obese children. Initial tobramycin doses may be determined using an adjusted body weight, although using total body weight in the context of monitoring serum tobramycin concentrations would also be an appropriate strategy. We found no information for any of the opioids; antibiotics such as penicillins, carbapenems, vancomycin, and linezolid; antifungals; cardiac drugs such as digoxin and amiodarone; corticosteroids; benzodiazepines; and anticonvulsants. In particular, we found no information about medications that are widely distributed to adipose tissue or that can accumulate there.
CONCLUSIONS
The available data are limited because of the small numbers of participating children, study design, or both. The number and type of drugs that have been studied limit our understanding of the pharmacokinetics in obese children. In the absence of dosing information for obese children, it is important to consider the nature and severity of a child's illness, comorbidities, organ function, and side effects and physiochemical properties of the drug. Extrapolating from available adult data is possible, as long as practitioners consider the effects of growth and development on the pharmacokinetics relevant to the child's age.
Keywords: child, obesity, pediatric, pharmacokinetics
INTRODUCTION
The terms overweight and obese have no standardized definitions or classifications that pertain to children. In 1995, the World Health Organization (WHO) recommended using a weight-for-height z-score >1 for overweight and >2 for obesity in children under 10 years of age.1 The International Obesity Taskforce and the United States Center for Disease Control, however, recommend using body mass index (BMI) as the main measure of overweight and obesity in children.1,2 BMI-for-age ≥ 85th percentile is used to define overweight, and ≥ 95th percentile is used to define obesity. 1,2 In the United States, the BMI reference charts from the National Health and Examination Surveys are used.3 Local population references are recommended when possible.3
In 2007, the WHO estimated that 22 million children under 5 years of age were overweight, with 75% of overweight and obese children living in low-to-middle–income countries.4 The prevalence of childhood obesity is increasing; a doubling or tripling of the prevalence of child hood obesity from the 1970s to the end of the 1990s was noted in Canada, the United States, Brazil, Chile, Australia, Japan, Finland, Germany, Greece, Spain, and the United Kingdom.3 According to United States data from 2003 to 2006, 12.4% of children age 2 to 5 years, 17% of children age 6 to 11 years, and 17.6% of adolescents age 12 to 19 years had a BMI ≥ 95th percentile for age.2
Overweight or obese children are more likely to have chronic diseases compared with normal-weight children.5,6 Increasing BMI and waist circumference in children is also associated with higher triglycerides and lower high-density lipoprotein cholesterol.6 Other consequences of childhood obesity may include insulin resistance, type 2 diabetes, nonalcoholic fatty liver disease, polycystic ovary syndrome, asthma, obstructive sleep apnea, pseudotumor cerebri, gastroesophageal reflux disease, cholecystitis, and orthopedic problems.7–10 Additionally, an association seems to exist between increased BMI and earlier onset of puberty.11,12 Many of the complications of childhood obesity may not be seen until the child becomes an adult.
There are many reviews of the pharmacokinetics and drug dosing in obese adults.13–21 However, to our knowledge, no similar reviews regarding overweight or obese children have been published. Similarly to adults, excess body weight in children likely leads to alterations in pharmacokinetic parameters for many drugs. Overweight and obese children could, therefore, be at risk of toxicity or reduced therapeutic effect. The purpose of this paper is to review pharmacokinetics in obese children and to provide drug dosing recommendations for obese children.
METHODS
EMBASE (1980–September 2009), MEDLINE (1950–September 2009), and the International Pharmaceutical Abstracts (1970–September 2009) databases were searched using the following search terms: obesity, morbid obesity, overweight, pharmacokinetics, drug, dose, kidney function test, creatinine, pediatric, and child. The search was limited to articles published in the English language. References of relevant citations were hand-searched. We included all articles in which authors reported on the impact of obesity or overweight on drug dosing, pharmacokinetics, or organ function in children.
RESULTS
Body Composition
Wells et al.22 examined body composition in overweight and obese children and compared it with age-matched and sex-matched controls. Overweight was defined as BMI > 85th percentile, and obesity was defined as > 95th percentile, using British 1990 reference data. The investigators measured body weight, total body water (by deuterium dilution), whole-body volume (by air-displacement plethysmography), and bone mineral content (by dual-energy X-ray absorptiometry). Data for the overweight children were not reported. The obese children (n=38), when matched with control children, were on average 3.9 cm taller (standard error 1.7 cm) and had significantly higher total body water, body volume, lean mass, fat mass, and bone-mineral content. These differences in body composition remained significant after adjusting for age, sex, and height. The mean age ± standard deviation (SD) of the children was 11 ± 2 years; however, accurate information on puberty development was missing. Obese children were found to have significant excesses in fat mass, lean mass, and bone mineral content in the trunk, arm, and leg compared with control children. Fat mass accounted for 30% to 50% of total weight and 73% of excess weight in obese children. Most excess fat was found to be in the abdominal region. Obese children also had increased hydration of lean mass, which was previously reported by Battistini et al.23 and was attributed to increased extracellular water.
Case 1.
A 5-year-old male (45kg and 125 cm) has septic shock when he is admitted to the pediatric intensive care unit. He is started on empiric antibiotic therapy with vancomycin and meropenem. Serum creatinine and urea are 0.7 mg/dL (65 micromol/L) and 15.1 mg/dL (5.4 micromol/L), respectively. What empiric vancomycin dose would you suggest?
Vancomycin exhibits time or area under AUC-dependent killing. It is 30% to 50% protein-bound, distributes well into total body water and other tissues, and is eliminated renally, primarily by glomerular filtration. In adults, it is total body weight (TBW) that correlates best with volume of distribution (Vd) and clearance (CL); empiric dosing that is based on TBW is suggested for obese adults. It would, therefore, be reasonable to empirically dose this child with 20 mg/kg/dose (900 mg). To determine the dosing frequency, we need to consider his clearance. Using the Schwartz equation, recognizing that it has not been validated in obese children, we can estimate creatinine clearance at 95 mL/min. Nomograms and equations that use creatinine clearance to guide dosing frequency in adults, however, are not validated in children. This child likely has some degree of renal impairment. It would be reasonable to dose vancomycin every 8 hours in this case. Serum vancomycin concentrations will be necessary to help guide dosing; 2 random concentrations 1 hour and 8 hours after the first dose or peak and trough concentrations at the third dose would be appropriate.
On day 2 of admission, vancomycin concentrations return as follows: trough 5 mg/L (1/2 hour before 3rd 1-hour infusion dose) and peak 33 mg/L (1 hour after 3rd dose). You calculate the following pharmacokinetic parameters: Vd=17.5L (0.5 L/kg TBW), k=0.3 h−1, half-life (t1/2)=2 h. You adjust the vancomycin doses accordingly. On day 3 of admission, the tracheal aspirate comes back positive for extended-spectrum β-lactamase producing E coli, susceptible to meropenem and amikacin. Vancomycin is discontinued, and you decide to add amikacin. What empiric dose would you suggest?
Amikacin, like other aminoglycosides, is minimally protein-bound, distributes mainly in extracellular fluid, and is eliminated primarily by glomerular filtration with slight tubular secretion. In obese adults, TBW overestimates, and ideal body weight (IBW) underestimates Vd. CL of aminoglycosides is larger in obese adults compared with normal-weight adults. The adjusted body weight (ABW) is recommended for dosing aminoglycosides in obese adults: ABW = IBW + 0.4 (TBW-IBW). It is suggested that dosing frequency be determined on the basis of renal function; ABW may be used in the Cockcroft-Gault equation to estimate GFR. In the small study of 5 obese children, CL per TBW was not different between obese and normal-weight children; however, Vd per TBW was lower in obese children. This would suggest providing obese children with the same total daily dose on a mg/kg TBW basis as normal-weight children; however, we should be cautious in applying these results. The small number of patients and the extent of obesity (30%–78%) are limitations to be considered. If we are to use ABW, we must consider that there is no standard method for calculating IBW for obese children. We could use the 50th percentile weight for this patient's height, which is 25 kg. ABW could then be calculated as 33 kg. This patient appears to be eliminating vancomycin appropriately despite a SCr concentration that is above the reference range for age. Therefore, we could empirically dose amikacin at 20 mg/kg/day ABW divided every 8 hours (220 mg every 8 hours). Regardless of the method chosen for empiric dosing, serum concentrations should be obtained to individualize dosing in obese children.
General Pharmacokinetic Differences in Obese Children
Absorption
Drug absorption has not been shown to be modified in obese adults.14,17 To our knowledge, no information is available that compares drug absorption in obese and normal-weight children.
Distribution
Drug distribution in obese adults is variable, depending on the drug studied. Drugs that are distributed in the extracellular fluid, such as aminoglycosides, have a larger absolute volume of distribution (Vd) but a smaller Vd per kg of total body weight (TBW) in obese adults as compared with normal-weight adults.14,17 The Vd of lipophilic drugs is variable in obese adults.14,17
Distribution is also likely to be affected by obesity in children. Vd is important for the calculation of drug loading doses. Factors that affect drug distribution include body composition, regional blood flow, and plasma protein binding. 17 No information was found with respect to regional blood flow in obese children. Obese children have a higher absolute lean mass and fat mass than normal-weight children; however, the percentage of lean tissue calculated per kg of TBW is lower, and the percentage of fat tissue is higher in obese children than in normal-weight children.22 Therefore, it is possible that Vd expressed as a function of TBW for highly lipophilic drugs would be higher in obese compared with normal-weight children. Although it is possible that Vd/TBW for highly hydrophilic drugs would be lower in obese children—such drugs are more likely to distribute into the extracellular fluid—the relationship between Vd and the increased hydration of lean mass observed in obese children is unknown. Tobramycin volume of distribution at steady state (Vss) per TBW was found to be lower in a group of 5 obese children when compared with 6 historical normal-weight controls.24 In the same study by Koshida et al.24, cefazolin Vss/TBW, however, was found to be similar between obese children and normal-weight controls. Both tobramycin and cefazolin are water-soluble drugs that distribute well into most tissues.25
The major plasma proteins involved in drug binding are albumin and α1-acid glycoprotein.17 Koshida et al.24 found no significant difference in incidence of protein binding of cefazolin—which is bound to albumin—between obese children and normal-weight historical controls (range, 79%–83% vs 75%–82%, respectively). In our search of the medical literature, we did not identify other information to characterize the effect of obesity on plasma protein binding (i.e., albumin, α1-acid glycoprotein, or liproproteins) in children.
Metabolism
It is difficult to measure the extent of hepatic drug metabolism. The clearance (CL) of antipyrene, a marker for oxidation, is similar in obese and normal-weight adults.17 However, the CL of some drugs that are primarily metabolized by oxidation is increased in obese adults.14 Conjugation of lorazepam and oxazepam is increased in obese adults.14 The influence of obesity on the major phase 1 (e.g., oxidation) and phase 2 (e.g., conjugation, sulfation, and acetylation) metabolic pathways in children is not known.
The only information that we identified about metabolism in obese children comes from a case report by Ritzmo et al.26 of a 14-year-old, morbidly obese male who received doxorubicin as part of his chemotherapy treatment. Doxorubicin is metabolized to doxorubicinol by nicotinamide adenine dinucleotide phosphate (NADPH)-dependent aldoketoreductases, which are present in erythrocytes, the liver, and the kidneys. Doxorubicin also undergoes sulfation and glucuronidation.25 In the case report, plasma doxorubicin and doxorubicinol concentrations were measured. Doxorubicinol concentration, as a function of doxorubicin concentration, was between 5.8% and 9.3%, which was similar to values reported in the medical literature.26
Excretion
Clearance is important for the calculation of maintenance doses. For drugs that are eliminated renally, the effect of obesity on glomerular filtration, tubular secretion, and tubular reabsorption will be important. No information was found about tubular secretion and tubular reabsorption in obese adults or children. The Salazar-Corcoran equation has been validated for the estimation of glomerular filtration rate (GFR) in obese adults, which is known to be higher than the rate in normal-weight adults.14 The Counahan-Barratt, the Schwartz, and the Leger equations have been developed and validated for the estimation of GFR in children, with the Schwartz equation being the most widely used.27 The Counahan-Barratt28 and the Schwartz29 equations include height in the calculation. The Leger30 equation includes both weight and height in the calculation. Schwartz et al.31 also developed and validated an equation to apply to children with chronic kidney disease; the equation incorporates height in the calculation. However, these equations have not been validated for the estimation of GFR in obese children.
Kasap et al.32 retrospectively evaluated the role of obesity and overweight status on renal function and cyclosporine concentrations in 27 adolescent renal transplant recipients. Normal-weight was defined as BMI < 85th percentile, overweight was defined as BMI 85th to 95th percentile, and obese was defined as BMI > 95th percentile. GFR was calculated using the Schwartz formula: k × height (cm)/serum creatinine concentration (mg/dL). Data were grouped according to the BMI at any given visit. The results indicated that there were 706 normal-weight visits and 72 obese and overweight visits (30 of the latter were obese visits). The mean ± SD serum creatinine (SCr) concentration was significantly higher in the obese-only visits (1.57 ± 0.25 mg/dL; p=0.001) and the combined obese and overweight visits (1.76 ± 0.33 mg/dL; p<0.001) compared with the normal-weight visits (1.36 ± 0.36 mg/dL). The mean ± SD calculated GFR was thereby significantly lower in the obese-only visits (62.67 ± 7.6 mL/min; p<0.001) and the combined obese and overweight visits (58.54 ± 7.82 mL/min; p=0.037) than the normal-weight visits (78.04 ± 37.53 mL/min). Of note, the cyclosporine trough concentrations in normal-weight visits were not significantly different from those in obese visits and combined obese and overweight visits. Some limitations to this study include (1) not correcting for multiple analyses, (2) the comparison of obese and normal-weight visits instead of obese and normal-weight children, and (3) lack of consideration for potential confounders, which could have included graft function and fluid balance. It is possible that children were misclassified as overweight or obese if they were fluid overloaded, which could result from a reduction in renal function.
Cindik et al.33 prospectively measured markers of renal function and inflammation in 65 otherwise healthy obese children and 20 otherwise healthy normal-weight children. Obese was defined as BMI > 95th percentile and normal-weight was defined as BMI < 85th percentile. Serum creatinine, blood urea nitrogen, and 16 other laboratory parameters were measured. GFR was calculated using the Leger formula: [56.7 × weight (kg)] + [0.142 × height2 (cm2)]/SCr (micromol/L). The mean age ± SD was lower in the obese children (11.3 ± 2.8 years) than in the normal-weight children (12.5 ± 3.1 years). The mean ± SD SCr concentration was not significantly different between the obese and normal-weight children (0.6 ± 0.2 mg/dL vs 0.5 ± 0.1 mg/dL; p=0.52). The mean ± SD calculated GFR was not significantly different between the obese and normal-weight children (141.8 ± 48.2 mL/min vs 118.6 ± 28.4 mL/min; p=0.09).
Koshida et al.24 measured the CL of tobramycin, which is eliminated primarily via glomerular filtration. Tobramycin CL expressed as a function of TBW was not significantly different between 5 obese children and 6 historical normal-weight controls (1.49 ± 0.22 mL/min/kg vs 1.82 ± 0.29 mL/min/kg; p>0.05). There remains to be a validated estimate of GFR in obese children. It appears that SCr concentration in obese children may be higher or no different from that in normal-weight children.
Dosing Weight
Mainly, dosing medication in children is based on 1 of the following approaches or components: age, allometric scaling, body surface area, or weight.34 Age-based dosing, although simple to use, would not account for pharmacokinetic variability within a given age group.34 Allometric scaling relates physiologic function and morphology to body size.34 This method, although used in animal pharmacokinetic studies, is impractical for clinical use. Dosing based on body surface area (BSA) is used for the calculation of chemotherapy doses. BSA is usually calculated using the Mosteller35 equation: BSA = {[height (cm) × weight (kg)]/3600}.1/2 Weight-based dosing is the most commonly used method for calculating the doses of other types of drugs in children.
Several descriptors of body weight exist, including TBW, ideal body weight (IBW) and adjusted body weight (ABW). For adults, IBW is derived from life insurance tables or from the Devine estimation.36 For children, there is no standard method for determining IBW. The McLaren method, which uses the 50th percentile for height, is most commonly used.37 The Moore method uses the corresponding weight percentile for height.37 The BMI method uses the following equation: IBW (kg) = (BMI 50th percentile for age × height [m2]).37 In the case report of a morbidly obese male, the 95th percentile of weight for height was used to estimate IBW.26 An ABW is used commonly for dosing aminoglycosides for obese adults and is calculated as IBW + 0.4 (TBWIBW). 13,17 To our knowledge, ABW has not been tested using children; however, Koshida et al.24 used ABW in their estimation of tobramycin Vss.
Green et al.36 reviewed the medical literature to determine the best size descriptor to be used in pharmacokinetic studies involving obese adults. Over 30 drugs were reviewed, including chemotherapy, low-molecular weight heparins, antibiotics, opioids, and antiepileptics. The size descriptors studied included BMI, BSA, IBW, fatfree mass, lean body weight (LBW), ABW, TBW, and predicted normal weight. LBW, although occasionally used interchangeably with IBW, is actually defined as TBW minus the product of fractional fat mass and TBW. In the Green et al. study, the authors concluded that TBW was the best size descriptor for Vd, and LBW was the best size descriptor for CL in pharmacokinetic studies.
When calculating drug doses on the basis of the body weight of obese children, it is important to consider what is known of the pharmacokinetics and dosing of the given drug in this population (see next section). It is possible that using TBW could result in a supratherapeutic dose and using IBW could result in a subtherapeutic dose for some drugs. Regardless of the dosing weight used, it is important to consider drug dosing in obese adults and the recommended adult maximum doses.
Case 2.
A 14-year-old male (140 kg and 167 cm) presents to your hospital with headache and increasing confusion over the course of the last 24 hours. His temperature is 40°C. While in the emergency department, the patient has 2 generalized seizures, which respond to 4 mg of IV lorazepam. The decision is made to initiate vancomycin, cefotaxime, acyclovir, and phenytoin. What loading and maintenance doses of phenytoin would you suggest?
Phenytoin has a high bioavailability but saturable absorption with (single) oral doses above 400 mg. It is approximately 90% bound to albumin and distributes rapidly into the brain after an intravenous bolus. In obese adults, the volume of distribution is larger than in normal-weight adults, both when expressed as an absolute value and as a function of TBW. For this reason, loading doses are calculated using ABW = IBW + 1.33 (TBW-IBW), which exceeds dosing based on TBW. Clinicians may, however, provide more conservative loading doses in very obese patients, depending on the clinical situation. In this adolescent patient, it would be appropriate to calculate IBW on the basis of the adult calculations (e.g., Devine method). The IBW would be 63 kg, and the ABW would be 165 kg. On the basis of an empiric loading dose of 15–20 mg/kg, this patient would receive upwards of 2400 mg. We could, therefore, provide a smaller loading dose of 1500 mg and assess the clinical condition. If there is no seizure activity after this dose, we could check a peak serum concentration 1 hour after the end of the infusion. If seizure activity recurs, we may consider providing the remainder of the loading dose (e.g., 1000 mg) and then check a serum concentration. In obese adults, phenytoin CL is higher, and t1/2 is prolonged compared with normal-weight adults.62 Maintenance doses based on IBW are recommended. Therefore, we could provide this patient with a maintenance dose of 6 mg/kg IBW (400 mg) once daily.
Specific Agents and Pharmacokinetic Differences in Obese Children
Anesthetic Agents
Although several reviews have discussed the potential morbidity associated with anesthesia in obese children, there are no pharmacokinetic studies of anesthetic agents in this population.38–40 In addition, although there is no information to guide dosing of anesthetic agents in obese children, it is likely that the effectiveness and safety of these agents can be monitored clinically.
Antibiotics
Cefazolin
Cefazolin is a water-soluble antibiotic that is distributed widely and is 90% unchanged in eliminated urine.25 Cefazolin, like other β–lactams, exhibits time-dependent killing. Koshida et al.24 recruited 5 obese children (1 female and 4 males) for their pharmacokinetic study of tobramycin and cefazolin. The mean age was 6.8 years (range, 22 months–9.4 years). Four of the children were hospitalized for examination of obesity, and one child was hospitalized for a coronary aneurysm due to Kawasaki disease. The children were otherwise healthy and had normal kidney and liver function. Two of the children were identical twins. The authors calculated the children's IBW according to a Japanese nomogram and determined the children's extent of obesity (mean, 63%; range, 30%–78%). A single dose of cefazolin 25 mg/kg, based on the mean of TBW and IBW, was infused over 30 minutes, and serum concentrations were obtained at 30, 50, 70, 90, 110, 130, 160, 190, 220, and 280 minutes after the start of the infusion. Serum cefazolin concentrations were determined using high-performance liquid chromatography (HPLC) with ultraviolet detection. The authors used noncompartmental analysis and calculated the area under the serum concentration time curve (AUC) using the trapezoidal rule. The authors calculated Vss per TBW, CL per TBW, and half-life (t1/2) and compared these parameters with those of 6 normal-weight children from a previous study.40 No significant difference existed between the obese children and the normal-weight children for Vss/TBW (135 ± 18 vs 133 ± 15 mL/kg; p>0.05), CL/TBW (0.96 ± 0.14 vs 1.02 ± 0.14 mL/min/kg; p>0.05), or t1/2,(100 ± 18 vs 95 ± 25 min; p>0.05). Protein binding of cefazolin in obese children (79% and 83%) was comparable to values in the normal-weight children (75%–82%). The findings of this small study indicate that the pharmacokinetic parameters of cefazolin are not altered in obese children and that dosing should be based on total body weight.
Tobramycin
Tobramycin is a water-soluble antibiotic that distributes mainly in the extracellular fluid and is eliminated primarily by glomerular filtration.25 It exhibits concentration-dependent killing. In the same study by Koshida et al.24 noted in the last paragraph, a single dose of tobramycin (2 mg/kg), based on a mean of TBW and IBW, was infused over 30 minutes, and serum concentrations were obtained at 10, 30, 50, 70, 90, 120, 150, 180, and 240 minutes after the start of the infusion. Tobramycin serum concentrations were determined by fluorescence polarization immunoassay. The authors used noncompartmental analysis and calculated the AUC using the trapezoidal rule. The authors calculated Vss per TBW, CL per TBW, and t1/2 and compared these parameters with the six normal-weight children from a previous study.40 No significant difference existed between the obese children and the normal-weight children for CL/TBW (1.49 ± 0.22 vs 1.82 ± 0.29 mL/min/kg; p>0.05) or t1/2(100 ± 23 vs 113 ± 29 min); however, Vss/TBW (197 ± 26 vs 263 ± 40 mL/kg; p<0.05) was significantly lower for the obese children as compared with the normal-weight children. The authors also formulated an equation for predicting the Vss of tobramycin in obese children based on their previous work in normal-weight children and on the assumption that the extracellular water content of adipose tissue is 40% of that of other tissues: Vss = 0.261 × {IBW(kg) + 0.4 × [TBW(kg) – IBW(kg)]}. The mean difference between the predicted Vss based on the equation and the actual Vss for the obese children was 6.8%.
On the basis of this small study, it appears that tobramycin's pharmacokinetic parameter of CL per TBW is not altered in obese children. This would suggest that the total daily dose on a mg/TBW basis would be the same for normal-weight and obese children. This is different from what has been found in adults, for whom dosing for aminoglycosides is based on ABW = IBW + 0.4 (TBW-IBW).12,16 Given that tobramycin's Vss per TBW is lower in obese children compared with normal-weight children, the loading dose of tobramycin would be different on a mg/TBW basis. Although the authors did not find a difference in t1/2 in the obese as compared with normal-weight children, possibly, the sample size was too small and the variability was too large to detect a difference. Given that tobramycin serum concentrations can be readily measured and interpreted in clinical practice, it seems reasonable to empirically dose tobramycin in obese children on the basis of TBW or ABW, taking into consideration extent of obesity, renal function, and severity of illness being treated; also, doses can be adjusted according to serum concentrations. This should apply equally to other aminoglycosides such as gentamicin and amikacin.
Antihypertensives
Angiotensin-Converting Enzyme Inhibitors and Angiotensin II Receptor Blockers
Hanafy et al.42 retrospectively reviewed the medical records of 263 pediatric patients treated for renal diseases (e.g., chronic renal failure, glomerulonephritis, nephritic syndrome); anti-hypertensive therapy was routinely prescribed for these patients. According to the records, 48 patients were treated with a calcium channel blocker, angiotensin II receptor blocker, or angiotensin converting enzyme (ACE) inhibitor. Hypertension was defined as blood pressure ≥ 95th percentile for corresponding age, sex, and height. Obesity was defined as BMI ≥ 95th percentile for children of corresponding age and sex for children 2 to 18 years and weight ≥ 95th percentile for children of corresponding age and sex for children < 2 years. The investigators compared 25 obese and 23 normal-weight children. The mean age was 8 years (range, 0.17–16 years), and height was similar between groups. Fifteen obese and 10 normal-weight children were receiving corticosteroid therapy. Renal function was not compared between groups. More males were in the obese group (84%) than in the normal-weight group (52%). Mean doses of medications, as expressed as mg/m2, were not statistically different between groups. The authors categorized patients as responders and nonresponders on the basis of a reduction in systolic and/or diastolic blood pressure > 10% from baseline and used multivariate logistic regression to test the effects of age, sex, obesity, nephrotic syndrome, and corticosteroid use. The authors also compared the percentage reduction in blood pressure from baseline between the obese and normal-weight groups.
Eight children in the Hanafy et al.42 study received ramipril, and 7 children received other ACE inhibitors (i.e., captopril or enalapril) or ARBs (e.g., losartan). Nine of these children received combination therapy with a calcium channel blocker. The mean doses of ramipril in the obese vs normal-weight group were 5.6 ± 1.9 vs 7.7 ± 1 mg/m2 (p=0.36). The mean doses of other ACE inhibitors or ARBs, as expressed as enalapril equivalents, in the obese vs normal-weight group were 5 ± 0.9 vs 4.9 ± 3.7 mg/m2 (p=0.97). None of the tested covariates, including obesity, were found to have a significant effect on response to ACE inhibitors and ARBs. Additionally, the percentage reduction in systolic blood pressure due to ACE inhibitors and ARBs, either alone or in combination with CCBs, was not significantly different between the obese and normal-weight groups. The small number of patients receiving ACE inhibitors or ARBs is a limitation to this study; however, the results suggest that obese and normal-weight patients receiving similar doses of ACE inhibitors or ARBs on a mg/m2 basis may have a similar reduction in blood pressure.
Calcium Channel Blocker
In the same study by Hanafy et al.41, 9 children received amlodipine, 24 children received shortacting nifedipine, and 9 children received longacting nifedipine. Nine of these children received combination therapy with an ACE inhibitor or angiotensin II receptor blocker. The mean doses of amlodipine in the obese vs normal-weight group were 8.3 ± 2.5 vs 6.9 ± 1.2 mg/m2 (p=0.6). The mean doses of nifedipine in the obese vs normal-weight group were 9.6 ± 1.9 vs 10.7 ± 2.4 mg/m2 (p=0.73) for the short-acting form and 56 ± 15.8 vs 77.2 ± 34 mg/m2 (p=0.56) for the long-acting form. Of the covariates tested, obesity had a significant effect on systolic blood pressure response to CCBs (odds ratio [OR] 12.26; confidence interval [CI] 1.2–122), and corticosteroid use had a significant effect on diastolic blood pressure response to CCBs (OR 15.1; CI 1.3–176). The systolic blood pressure response to CCBs was 12.5% in the obese group and 52.9% in the normal-weight group (p<0.05). The results suggest that obese children may not respond as well as normal-weight children to similar mg/m2 doses of CCBs and may require higher doses to achieve blood pressure control.
Chemotherapeutic Agents
Antineoplastics
Controversy exists regarding the best size descriptor for calculating the doses of chemotherapy in obese patients. By convention, TBW is used to calculate BSA; however, in oncology practice, providers are often concerned that using an obese patient's TBW to calculate BSA could result in high doses and toxicities. On the other hand, there is also concern that using an obese patient's IBW or LBW to calculate BSA could result in underdosing, leading to less effective therapy.43 In obese adults, BSA calculated using TBW was found to be an appropriate strategy for most chemotherapeutic agents, as determined by comparing predicted AUC for obese adults to mean AUC in normal-weight controls.43 Additionally, a recent review concluded that chemotherapy dosing based on TBW in obese adults was not associated with higher toxicity or worse outcomes when compared with normal-weight adults.44
Retrospective studies in women with breast cancer have found that obese adults were more likely to receive a lower chemotherapy dose, which was associated with decreased disease-free survival compared with normal-weight adults.44 Baillargeon et al.45 compared chemotherapy dose calculations for obese and normal-weight children in a cohort of 199 children who were 2 years of age and older and were treated for acute lymphoblastic leukemia (ALL). A total of 16.2% of the cohort was obese, as defined by a BMI ≥ 95th percentile. Chemotherapy dose modification was determined using the ratio of the actual Lasparaginase dose administered at induction to the calculated dose using the conventional BSA algorithm that is based on TBW. Compared with the dose modification for normal-weight children (1.00 ± 0.04), the dose modification for obese children (0.93 ± 0.11) was significant (p<0.009). This indicates that obese children received mean chemotherapy doses that were 7% lower than the protocol-specified dose. Outcomes were not reported in this study.
In contrast to the study just noted, a retrospective review by Hijiya et al.46 compared safety and efficacy outcomes between obese and normal-weight children who received treatment for ALL. No significant difference existed on the basis of BMI in the rate of complete remission, overall survival, or cumulative incidence of relapse. Also, no difference existed on the basis of BMI in the frequency of grade 3 or 4 toxicity. All children received chemotherapy doses that were based on BSA calculated using TBW. Pharmacokinetic parameters were also compared and are reported below.
Busulfan
Dupuis et al.47 retrospectively examined their busulfan dose adjustments made for 38 children 0.17 to 17.5 years of age (median 5.7 years). Children received an oral or nasogastric dose of busulfan (40 mg/m2) that was based on BSA calculated from TBW. Busulfan whole blood concentrations were obtained at 1, 1.5, and 6 hours after the dose and analyzed by using gas chromatography with electron capture detection. The AUC was calculated on the basis of a limited sampling strategy the authors had previously developed: AUC = 45C1h +15C1.5h +270 C1.5h/(lnC 1.5h–lnC6h). The busulfan dose was then adjusted, with the assumption of a linear relationship between dose and AUC, to achieve a target AUC between 900 and 1400 microM/min. Subsequent doses were given every 6 hours for a total of 16 doses. Dose reductions were required for 59% of children and dose increases were required for 28% of children. Most of the dose reductions were for children > 5 years of age (78%), and most of the dose increases were for children > 5 years of age (82%). The authors reported that the final busulfan dose was not different for children whose TBW was greater than their IBW. Therefore, the findings of the Dupuis et al.47 suggest that initial busulfan doses should be based on the BSA calculated using a child's TBW. The authors later reported an error in their assay that may have led to falsely high concentrations and improperly calculated AUC.48
Cytarabine
Hijiya et al.46 conducted a retrospective review of 621 children older than 1 year who received treatment for ALL; the study was conducted to determine the influence of BMI on the outcome, toxicity, and pharmacokinetics of chemotherapy. Children 2 years and older were classified as underweight if BMI < 10th percentile, normal-weight if BMI ≥ 10th percentile, and < 85th percentile, risk of overweight if BMI ≥ 85th percentile and < 95th percentile and overweight if BMI ≥ 95th percentile. Children 1 to 2 years of age were classified using the weight-for-length percentiles instead of BMI percentiles. All children received chemotherapy doses on the baiss of TBW or BSA calculated using TBW. Pharmacokinetic data were available for cytarabine, methotrexate, teniposide, and etoposide and had been previously reported.48–50 Clearance for each child was calculated using the elimination rate constant (ke) and the Vd, and then a linear mixed effects model was used to analyze the population pharmacokinetics. The authors reported that children had their dosage of cytarabine, methotrexate, or teniposide adjusted on the basis of drug CL. In their pharmacokinetic analysis, the authors adjusted for the known confounders of age (< 10 years or ≥ 10 years), course of treatment, and study protocol. The mean CL of cytarabine was not significantly different among the normal-weight (773.8 mL/min/m2), risk of overweight (645.1 mL/min/m2), and overweight children (782.9 mL/min/m2; p=0.56). This finding suggests that it is appropriate to dose cytarabine on the basis of BSA calculated using TBW. Results for methotrexate, teniposide, and etoposide are reported below.
Doxorubicin
Ritzmo et al.26 reported a morbidly obese 14-year-old male who had Hodgkin's disease who received treatment with doxorubicin and etoposide (see next section for etoposide). This child weighed 137 kg and was 172 cm tall; his calculated BMI was 46.3 kg/m2. The actual BSA, calculated on the basis of TBW, was 2.56 m2. The upper limit of the expected body weight for height was used to calculate an adjusted BSA of 1.91 m2. Doses of doxorubicin and etoposide were calculated on the basis of the adjusted BSA. The child received 40 mg/m2 of doxorubicin (corresponding with 30 mg/m2 actual BSA) over 4 hours on days 1 and 15 for the first course and again on days 1 and 15 for another course administered 2 weeks later. Plasma concentrations of doxorubicin and its metabolite, doxorubicinol, were measured just before the end of infusion on day 15 of the first course and days 1 and 15 of the second course; the concentrations were quantified by using reverse-phase liquid chromatography with fluorometric detection. The pharmacokinetics of doxorubicin were evaluated using a limiting sampling strategy and were compared with previously published doxorubicin concentrations from 37 children (mean age, 5.5 years; mean doxorubicin dose, 19.7 mg/m2).52 The plasma concentration and calculated plasma CL for doxorubicin were noted as the following: day 1 of the first course (202 ng/mL; 425 mL/min/m2), day 1 of the second course (181 ng/mL; 476 mL/min/m2), and day 15 of the second course (162 ng/mL; 532 mL/min/m2). The median plasma CL was 476 mL/min/m2, which was similar to the published value of 493 mL/min/m2 (range, 197–869 mL/min/m2) in normal-weight children. The authors stated that the plasma doxorubicinol concentrations were within the normal range of 5% to 10% of intact doxorubicin: 11.8 ng/mL on day 1 of the first course and, in the second course, 16.9 ng/mL on day 1 and 14.2 ng/mL on day 15. Unfortunately, complete sampling to determine the AUC of doxorubicin was not possible for this child, and the authors had to use a limited sampling strategy that was not validated for obese children. The authors reported that the therapy was well tolerated and that no specific toxicities were observed. The calculated CL suggests that this child could have received doxorubicin doses on the basis of the BSA calculated using his TBW.
Thompson et al.53 enrolled 22 patients in their pharmacokinetic study who were receiving doxorubicin over 1 or 2 days as part of their chemotherapy regimen. Height and weight were measured, and body composition was analyzed using dual energy X-ray absorptiometry. Patients were classified as overweight if their BMI was > 85th percentile for age. For patients who received doxorubicin on 1 day, blood samples were drawn at 0, 0.5, 1, 1.5, 2, 3, 4, 6, 8, 12, and, when feasible, 24 and 48 hours. For patients who received doxorubicin on 2 days, blood samples were drawn at 0, 0.5, 1, 2, 4, and 6 hours on day 1 and at 0, 0.5, 1, 1.5, 2, 4, 6, 8, 12, and, when feasible, 24 and 48 hours. Samples were assayed for doxorubicin and doxorubicinol using HPLC. All calculated pharmacokinetic parameters were scaled to BSA. The median age was 15 years (range, 3.3–21.5 years), median weight was 51.5 kg (range, 12.4 kg-80 kg), body fat 25 % (range, 15%–36%). Six patients had body fat > 30%, and 2 patients were classified as overweight. No statistical difference in mean doxorubicin CL or Vd was identified between patients with > 30% body fat and patients who had < 30% body fat. The apparent mean doxorubicinol CL and Vd were lower in the patients who had < 30% body fat: 37.2 ± 14.9 L/h/m2 vs 64.8 ± 35.1 L/h/m2 (p=0.03) for CL and and 802 ± 503 L/m2 vs 1450 ± 654 L/m2 for Vd (p=0.02). No statistical difference in mean doxorubicin CL or Vd and mean apparent doxorubicinol CL or Vd were identified between overweight patients and normal-weight patients. The findings of this study, although limited because of the small number of overweight patients, support dosing doxorubicin on the basis of the BSA calculated using his TBW. The extent of overweight was not described for these patients.
Etoposide
In the retrospective review by Hijiya et al.,46 no significant difference existed in mean CL of etoposide among the normal-weight (48.7 mL/min/m2), at-risk-of-overweight (48.4 mL/min/m2), and overweight (50.2 mL/min/m2) children (p=0.41). In the case report by Ritzmo et al.26, the morbidly obese male received etoposide 125 mg/m2 (corresponding to 94 mg/m2 actual BSA) over 2 hours on days 3 to 7. Plasma concentrations of etoposide were measured on day 3 immediately prior to the dose and at 1, 2, 3, 6 and 12 hours after the end of the infusion and quantified by reversephase liquid chromatography with fluorometric detection. The pharmacokinetics of etoposide were evaluated by compartmental analysis and compared with previously published values for 16 normal-weight children (mean age 8.3 years and mean etoposide dose 130 mg/m2).54 The child's plasma CL of etoposide was 16.1 mL/min/m2, which was similar to the published median CL of 14.9 mL/min/m2 (range 11.0–31.7 mL/min/m2). The child's terminal t1/2 was 3.6 hours as compared with the published median t1/2 of 4.1 hours (range 2.0–7.8 hours). Based on the retrospective review and the case report, it appears that etoposide should be dosed based on BSA calculated using TBW in obese children, similarly to normal-weight children.
Methotrexate
Sauer et al.55 report a case of toxic methotrexate concentrations and nephrotoxicity in a 16 yearold male who was treated for ALL. The child had received multiple chemotherapeutic agents as part of his protocol. He received intrathecal methotrexate as part of the consolidation, interim maintenance, and reconsolidation phases. He received intravenous (IV) methotrexate beginning at 100 mg/m2, with escalating dose. During the second interim maintenance phase, he received 250 mg/m2 IV methotrexate. His weight was 110 kg and height 170 cm, which yielded a calculated BMI of 38.1 kg/m2. The child's chemotherapy doses were based on his actual BSA of 2.3 m2. Three days following the 250 mg/m2 dose of IV methotrexate, the child was found to have an elevated SCr concentration of 2.8 mg/dL (baseline was 0.6 mg/dL) and decreased GFR of 25 mL/min/1.73 m2. Findings from a renogram suggested acute tubular necrosis. The methotrexate concentration of 2.9 micromol/L, measured four days after the dose of IV methotrexate, was “supratherapeutic.” The child improved after administration of folinic acid rescue and IV fluids containing sodium bicarbonate. The authors make reference to a case report of 4 normal-weight adults who had nephrotoxicity following an intermediate dose (200 mg/m2) of methotrexate.56 It is unclear how the child's obesity might have related to the toxicity he had with methotrexate, given that other risk factors were not reported.
In the retrospective review by Hijiya et al.46, no significant difference was identified in mean CL of high-dose methotrexate for the normal-weight (114.1 mL/min/m2), risk-of-overweight (115.3 mL/min/m2), and overweight (114.9 mL/min/m2) children (p=0.47). Of note, high-dose methotrexate (1500 mg/m2) was used for induction. On the basis of this information, a reasonable approach would be to dose methotrexate based on BSA calculated using TBW and to monitor clinically for signs of toxicity.
Teniposide
In the retrospective review by Hijiya et al.46, no significant difference existed in mean CL of teniposide for the normal-weight (14.0 mL/min/m2), risk-of-overweight (12.1 mL/min/m2) and overweight (14.2 mL/min/m2) children (p=0.35). This finding suggests that teniposide should be dosed based on BSA calculated using TBW.
Neuromuscular Blockers
One dose-response study of the neuromuscular blocking agent succinylcholine was available.57 Succinylcholine is an ionized drug that is rapidly metabolized in the plasma by pseudocholinesterases to succinylmonocholine, which is eliminated renally.25 Rose et al.57 studied 30 children 9 to 15 years old who had a BMI > 30 kg/m2. The purpose of the study was to determine the potency of succinylcholine in obese children. These children received ranitidine, metoclopramide, and midazolam preoperatively. Anesthesia was induced with thiopental and fentanyl. Neuromuscular blockade was monitored at baseline and after administration of succinylcholine using the response of the adductor pollicis muscle to supramaximal train-of-four stimuli of the ulnar nerve at 10 second intervals for 30 seconds. The first 20 children were randomized to receive succinylcholine (100 mcg/kg or 250 mcg/kg) based on TBW. The subsequent 10 children received succinylcholine (150 mcg/kg) based on TBW because the investigators estimated this to be the dose that produced a 50% depression of neuromuscular function, otherwise known as the effective dose (ED50). The authors used linear regression to determine the ED to depress 50%, 90%, and 95% of the baseline twitch (ED50, ED90, and ED95). The estimated ED50, ED90, and ED95 were reported in mcg/kg TBW: 152.8 (95% CI, 77.8–299.5), 275.4 (95% CI, 142–545.7), and 344.3 (95% CI, 175.3–675.3). The authors compared these values with those obtained in a similar study of succinylcholine that involved 40 normal-weight children 11 to 15 years.58 The ED50 and ED95 ± SD, reported in mcg/kg TBW, were 147 ± 32 and 270 ± 70. The authors concluded similar potency of succinylcholine in obese and normal-weight children and recommended the dose be based on TBW.
Although information to guide dosing of neuromuscular blocking agents is available only for succinylcholine, it is likely that the dosing requirements for the other neuromuscular blockers can be determined using clinical monitoring. The child's clinical condition and organ function should be considered when dosing these agents for obese children.
Vaccines
Hepatitis B
Minana et al.59 studied 427 children to examine immune responsiveness to the hepatitis B vaccine and to predict the duration of protection. Children 12 years of age received 3 intramuscular (into deltoid muscle) doses of hepatitis B vaccine (20 mcg) at 0, 1, and 6 months. One month after the last immunization, the children were tested for serum concentrations of antibody to hepatitis B surface antigen (anti-HBs), which were measured using radioimmunoassay. Weight, height, and BMI data were tested for a correlation with anti-HBs concentrations. A significant weak correlation was found between BMI and anti-HBs concentrations (r= −0.118; p=0.015). The median anti-HBs concentrations were lower in obese children than in normal-weight children (34,186 IU/L vs 47,186 IU/L). Obesity was defined as a BMI > 90th percentile. All of the children had anti-HBs concentrations that were above the recommended threshold of 10 IU/L.
Tetanus
Eliakim et al.60 examined inflammatory mediators, circulating immunoglobulins, and tetanus antibodies in overweight and normal-weight children who had received childhood immunizations at the recommended intervals per parent report. The timing of the last tetanus immunization relative to the study period was not provided. The study participants were 15 overweight children—with overweight defined as BMI > 85th percentile—and 15 normal-weight children, with the latter serving as age-matched controls. Children were between 8 and 17 years of age (mean, 13 years). Overweight and normal-weight children had a mean BMI ± SD of 29.1 kg/m2 ± 6.2 kg/m2 and 18.4 kg/m2 ± 2.7 kg/m2, respectively, and a mean percentage of fat ± SD of 36.2% ±7.7% and 18.9% ± 5.4%, respectively. The mean concentration ± SD of antitetanus immunoglobulin G (IgG) was significantly lower for overweight (2.6 ± 2.3 IU/mL) than for normal-weight (4.2 ± 1.9 IU/mL) children (p<0.05). The authors noted that the antitetanus IgG concentrations were above the recommended threshold of 0.1 IU/mL in all children.
General Conclusions about Vaccines
It is unclear whether obese children have an altered immune response to vaccines or whether factors such as dose relative to body size, absorption from injection site, or distribution of the injected vaccine contribute to a reduced response to immunization. Given that the antibodies produced to tetanus and hepatitis B immunization in overweight and obese children were well above the recommended threshold, there is probably minimal clinical significance of a reduced response to immunization. Overweight and obese children should receive the same immunization doses as normal-weight children in accordance with local immunization guidelines.
Vitamin D
In an open-label study, Rajakumar et al.61 compared the vitamin D status and response to supplementation during the winter months in 21 obese and 20 normal-weight African American children 6 to 10 years of age. Obesity and was defined as BMI > 95th percentile, and normal-weight was defined as BMI 5th to 75th percentile. Children were required to complete a validated food frequency questionnaire and were supplemented with vitamin D3 400 units daily for one month. Serum 25-hydroxyvitamin D (25[OH]D); 1,25-dihydroxyvitamin D (1,25[OH]2D); calcium; phosphorus; and other markers were assessed at baseline and at completion of the study. The obese and normal-weight children were matched for age, sex, skin color, and pubertal maturation. The mean weight ±SD for the obese children was 49.1 ± 14.3 kg, and for the normal-weight children it was 29.9 ± 5.8 kg. The mean BMI ± SD for the obese children was 25.5 ± 4.8 kg/m2, and for the normal-weight children it was 16.3 ± 0.9 kg/m2. Obese children had a significantly lower mean ± SD vitamin D intake than the normal-weight children (218.1 IU/day ± 112 IU/day vs 339 IU/day ± 153 IU/day). At baseline, the obese and normal-weight children were similar for serum 25(OH)D; 1,25(OH)2D; calcium; and phosphorus. After 1 month of supplementation, no significant difference existed between the groups in the proportion of vitamin D deficiency or insufficiency. The proportion of vitamin D deficiency decreased from 57% to 24% in the obese group and from 40% to 11% in the normal-weight group (p>0.05). The proportion of vitamin D insufficiency decreased from 24% to 5% in the obese group and from 25% to 11% in the non-obese group (p>0.05). Despite potential confounding of results by dietary vitamin D intake in this study, the findings suggest that obese and normal-weight children have similar vitamin D status and respond similarly to vitamin D supplementation.
CONCLUSIONS
It is difficult to make generalizations about the pharmacokinetic differences between obese and normal-weight children because of the paucity of trials that include obese children. In general, drug absorption is unlikely to be affected by obesity. The Vd, as expressed per kg of TBW, is likely higher for lipophilic drugs and lower for hydrophilic drugs in obese children compared children of normal weight. To our knowledge, no published information exists about phase I (e.g., oxidation) or phase II (e.g., conjugation, glucuronidation, or sulfation) metabolism in obese children. No validated equation exists for estimating GFR in obese children; however, the SCr concentration is higher in obese children than normal-weight children.
The available pharmacokinetic and dosing information suggests that TBW is an appropriate size descriptor for calculating doses of antineoplastics, cefazolin, and succinylcholine in obese children. This is because no difference exists in CL as expressed per kg of TBW between obese and normal-weight children for cefazolin and no difference in CL as expressed per m2 between obese and normal-weight children for any of the antineoplastics studied. Additionally, no difference exists in effective dose as expressed per kg of TBW between obese and normal-weight children for succinylcholine. Initial tobramycin doses may be calculated using an ABW, although using TBW and monitoring tobramycin serum concentrations would also be an appropriate strategy.
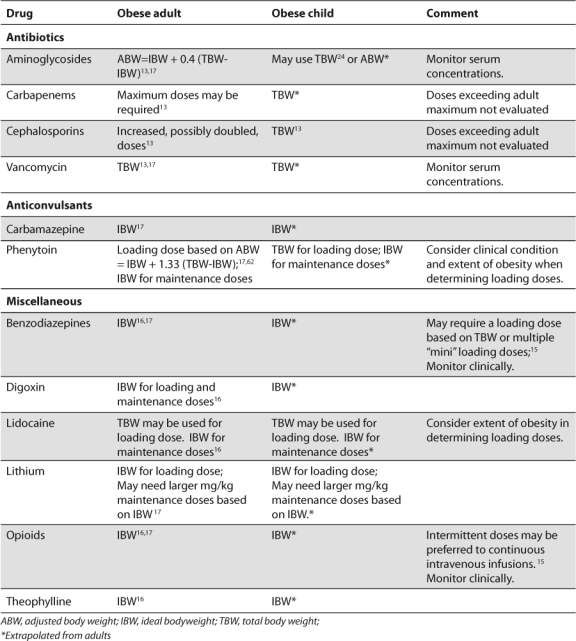
The available data are limited by small numbers of children in some of the studies, as well as the type of studies. Case reports, retrospective studies, and open-label studies have inherent design limitations. Additionally, the use of historical controls for normal-weight children in the context of a pharmacokinetic study in obese children is not ideal. The number and type of drugs that have been studied also limit our understanding of the pharmacokinetics in obese children. No information exists on using any of the following types of drugs in obese children: opioids; antibiotics such as penicillins, carbapenems, vancomycin, and linezolid; antifungals; cardiac drugs such as digoxin and amiodarone; corticosteroids; benzodiazepines; and anticonvulsants. In particular, no information exists about drugs that are widely distributed to or can accumulate in adipose tissue. In the absence of information for dosing drugs in obese children, practitioners should consider the nature and severity of the child's illness, the extent of the child's obesity, any comorbidities and organ function, as well as the toxicity of the drug. Providers can extrapolate from available adult data (Table), as long as they consider the effects of growth and development on the pharmacokinetics relevant to the child's age. Lastly, the physiochemical properties of the drug should be considered.
Table.
Recommended Dosing Weight for Selected Drugs in Children and Adults
ABBREVIATIONS
- 1,25(OH)2D
1,25-dihydroxyvitamin D
- 25(OH)D
25-hydroxyvitamin D
- ABW
adjusted body weight
- ACE
angiotensin converting enzyme
- ALL
acute lymphoblastic leukemia
- anti-HBs
antibody to hepatitis B surface antigen
- AUC
area under the serum concentration time curve
- BMI
body mass index
- BSA
body surface area
- CI
confidence interval
- CL
clearance
- ED
effective dose
- GFR
glomerular filtration rate
- HPLC
high performance liquid chromatography
- IBW
ideal body weight
- IgG
immunoglobulin G
- IV
intravenous
- LBW
lean body weight
- OR
odds ratio
- NADPH
nicotinamide adenine dinucleotide phosphate
- SCr
serum creatinine
- SD
standard deviation
- TBW
total body weight
- t1/2
half-life
- Vd
volume of distribution
- Vss
volume of distribution at steady state
- WHO
World Health Organization
Footnotes
DISCLOSURE The authors declare no conflicts or financial interest in any product or service mentioned in the manuscript, including grants, equipment, medications, employment, gifts, and honoraria.
REFERENCES
- 1.Lobstein T, Baur L, Uauy R. International Obesity TaskForce. Obesity in children and young people. Obes Rev. 2004;5(Suppl 1):4–85. doi: 10.1111/j.1467-789X.2004.00133.x. [DOI] [PubMed] [Google Scholar]
- 2.Ogden CL, Carroll MD, Flegal KM. High body mass index for age among US children and adolescents, 2003–2006. JAMA. 2008;299:2401–2405. doi: 10.1001/jama.299.20.2401. [DOI] [PubMed] [Google Scholar]
- 3.Wang Y, Lobstein T. Worldwide trends in childhood overweight and obesity. Int J Pediatr Obes. 2006;1:11–25. doi: 10.1080/17477160600586747. [DOI] [PubMed] [Google Scholar]
- 4.WHO. Childhood overweight and obesity 2008. Available at: http://www.who.int/dietphysicalactivity/childhood/en/index.html. Accessed December 16, 2009.
- 5.Gundogdu Z. Relationship between BMI and blood pressure in girls and boys. Public Health Nutr. 2008;11:1085–1088. doi: 10.1017/S1368980008002280. [DOI] [PubMed] [Google Scholar]
- 6.Plachta-Danielzik S, Landsberg B, Johannsen M, et al. Association of different obesity indices with blood pressure and blood lipids in children and adolescents. Br J Nutr. 2008;100:208–218. doi: 10.1017/S0007114508882980. [DOI] [PubMed] [Google Scholar]
- 7.Weiss R, Kaufman FR. Metabolic complications of childhood obesity. Diabetes Care. 2008;31(Suppl 1):S310–316. doi: 10.2337/dc08-s273. [DOI] [PubMed] [Google Scholar]
- 8.Nathan BM, Moran A. Metabolic complications of obesity in childhood and adolescence: more than just diabetes. Curr Opin Endocrinol Diabetes Obes. 2008;15:21–29. doi: 10.1097/MED.0b013e3282f43d19. [DOI] [PubMed] [Google Scholar]
- 9.Choudhary AK, Donnelly LF, Racadio J, et al. Diseases associated with childhood obesity. AJR. 2007;188:1118–1130. doi: 10.2214/AJR.06.0651. [DOI] [PubMed] [Google Scholar]
- 10.Strauss RS. Childhood obesity. Pediatr Clin North Am. 2002;49:175–201. doi: 10.1016/s0031-3955(03)00114-7. [DOI] [PubMed] [Google Scholar]
- 11.Biro FM, Khoury P, Morrison JA. Influence of obesity on timing of puberty. Int J Androl. 2006;29:272–277. doi: 10.1111/j.1365-2605.2005.00602.x. [DOI] [PubMed] [Google Scholar]
- 12.Dunger DB, Ahmed ML, Ong KK. Effects of obesity on growth and puberty. Best Pract Res Clin Endocrinol Metab. 2005;19:375–390. doi: 10.1016/j.beem.2005.04.005. [DOI] [PubMed] [Google Scholar]
- 13.Pai MP, Bearden DT. Antimicrobial dosing considerations in obese adult patients. Pharmacotherapy. 2007;27:1081–1091. doi: 10.1592/phco.27.8.1081. [DOI] [PubMed] [Google Scholar]
- 14.Lee JB, Winstead PS, Cook AM. Pharmacokinetic alterations in obesity. Orthopedics. 2006;29:984–988. doi: 10.3928/01477447-20061101-08. [DOI] [PubMed] [Google Scholar]
- 15.Casati A, Putza M. Anesthesia in the obese patient: pharmacokinetic considerations. J Clin Anesth. 2005;17:134–115. doi: 10.1016/j.jclinane.2004.01.009. [DOI] [PubMed] [Google Scholar]
- 16.Erstad BL. Dosing of medications in morbidly obese patients in the intensive care unit setting. Intensive Care Med. 2004;30:18–31. doi: 10.1007/s00134-003-2059-6. [DOI] [PubMed] [Google Scholar]
- 17.Cheymol G. Effects of obesity on pharmacokinetics implications for drug therapy. Clin Pharmacokinet. 2000;39:215–231. doi: 10.2165/00003088-200039030-00004. [DOI] [PubMed] [Google Scholar]
- 18.Wurtz R, Otokazu G, Rodvold K. Antimicrobial dosing in obese patients. Clin Infect Dis. 1997;25:112–118. doi: 10.1086/514505. [DOI] [PubMed] [Google Scholar]
- 19.Cheymol G. Clinical pharmacokinetics of drugs in obesity. An update. Clin Pharmacokinet. 1993;25:103–114. doi: 10.2165/00003088-199325020-00003. [DOI] [PubMed] [Google Scholar]
- 20.Cheymol G. Drug pharmacokinetics in the obese. Fundam Clin Pharmacol. 1988;2:239–256. doi: 10.1111/j.1472-8206.1988.tb00635.x. [DOI] [PubMed] [Google Scholar]
- 21.Blouin RA, Warren GW. Pharmacokinetic considerations in obesity. J Pharm Sci. 1999;88:1–7. doi: 10.1021/js980173a. [DOI] [PubMed] [Google Scholar]
- 22.Wells JCK, Fewtrell MS, Williams JE, et al. Body composition in normal weight, overweight, and obese children: matched case-control analyses of total and regional tissue masses, and body composition trends in relation to relative weight. Int J Obes. 2006;30:1506–1513. doi: 10.1038/sj.ijo.0803402. [DOI] [PubMed] [Google Scholar]
- 23.Battistini N, Virgili F, Severi S, et al. Relative expansion of extracellular water in obese vs. normal children. J Appl Physiol. 1995;79:94–96. doi: 10.1152/jappl.1995.79.1.94. [DOI] [PubMed] [Google Scholar]
- 24.Koshida R, Nakashima E, Taniguchi N, et al. Prediction of the distribution volumes of cefazolin and tobramycin in obese children based on physiological and pharmacokinetic concepts. Pharm Res. 1989;6:486–491. doi: 10.1023/a:1015968407226. [DOI] [PubMed] [Google Scholar]
- 25.McEvoy GK, editor. AHFS Drug Information. Bethesa: American Society of Health-System Pharmacists; 2009. [Google Scholar]
- 26.Ritzmo C, Soderhall S, Karlen J, et al. Pharmacokinetics of doxorubicin and etoposide in a morbidly obese pediatric patient. Pediatr Hematol Oncol. 2007;24:437–445. doi: 10.1080/08880010701451343. [DOI] [PubMed] [Google Scholar]
- 27.Mattman A, Eintracht S, Mock T, et al. Estimating pediatric glomerular filtration rates in chronic kidney disease staging. J Am Soc Nephrol. 2006;17:487–496. doi: 10.1681/ASN.2005010034. [DOI] [PubMed] [Google Scholar]
- 28.Counahan R, Chantler C, Ghazali S, et al. Estimation of glomerular filtration rate from plasma creatinine concentration in children. Arch Dis Child. 1976;51:875–878. doi: 10.1136/adc.51.11.875. [DOI] [PMC free article] [PubMed] [Google Scholar]
- 29.Schwartz GJ, Haycock GB, Edelmann CM, Jr, et al. A simple estimate of glomerular filtration rate in children derived from body length and plasma creatinine. Pediatrics. 1976;58:259–263. [PubMed] [Google Scholar]
- 30.Leger F, Bouissou F, Coulais Y, et al. Estimation of glomerular filtration rate in children. Pediatr Nephrol. 2002;17:903–907. doi: 10.1007/s00467-002-0964-5. [DOI] [PubMed] [Google Scholar]
- 31.Schwartz GJ, Munoz A, Schneider MF, et al. New equations to estimate GFR in children with CKD. J Am Soc Nephrol. 2009;20:629–637. doi: 10.1681/ASN.2008030287. [DOI] [PMC free article] [PubMed] [Google Scholar]
- 32.Kasap B, Soylu A, Turkmen M, et al. Effect of obesity and overweight on cyclosporine blood levels and renal functions in renal adolescent recipients. Transplant Proc. 2006;38:463–465. doi: 10.1016/j.transproceed.2005.12.054. [DOI] [PubMed] [Google Scholar]
- 33.Cindik N, Baskin E, Agras PI, et al. Effect of obesity on inflammatory markers and renal functions. Acta Paediatr. 2005;94:1732–1737. doi: 10.1111/j.1651-2227.2005.tb01845.x. [DOI] [PubMed] [Google Scholar]
- 34.Bartelink IH, Rademaker CMA, Schobbem AFAM, et al. Guidelines on paediatric dosing on the basis of developmental physiology and pharmacokinetic considerations. Clin Pharmacokinet. 2006;45:1077–1097. doi: 10.2165/00003088-200645110-00003. [DOI] [PubMed] [Google Scholar]
- 35.Mosteller RD. Simplified calculation of body-surface area. N Engl J Med. 1987;317:1098. doi: 10.1056/NEJM198710223171717. [DOI] [PubMed] [Google Scholar]
- 36.Green B, Duffull SB. What is the best size descriptor to use for pharmacokinetic studies in the obese? Br J Clin Pharmacol. 2004;58:119–133. doi: 10.1111/j.1365-2125.2004.02157.x. [DOI] [PMC free article] [PubMed] [Google Scholar]
- 37.Phillips S, Eldbeck A, Kirby M, et al. Ideal body weight in children. Nutr Clin Pract. 2007;22:240–245. doi: 10.1177/0115426507022002240. [DOI] [PubMed] [Google Scholar]
- 38.Veyckemans F. Child obesity and anaesthetic morbidity. Curr Opin Anesthesiol. 2008:308–312. doi: 10.1097/ACO.0b013e3282f82bbb. [DOI] [PubMed] [Google Scholar]
- 39.Samuels PJ. Anesthesia for adolescent bariatric surgery. Int Anesthesiol Clin. 2006;44:17–31. doi: 10.1097/01.aia.0000196250.61280.65. [DOI] [PubMed] [Google Scholar]
- 40.Smith HL, Meldrum DJ, Brennan LJ. Childhood obesity: a challenge for the anaesthetist? Paediat Anaesth. 2002;12:750–761. doi: 10.1046/j.1460-9592.2002.00781.x. [DOI] [PubMed] [Google Scholar]
- 41.Koshida R, Nakashima E, Ichimura F, et al. Comparative distribution kinetics of cefazolin and tobramycin in children. J Pharmacobio-Dyn. 1987;10:436–442. doi: 10.1248/bpb1978.10.436. [DOI] [PubMed] [Google Scholar]
- 42.Hanafy S, Pinsk M, Jamali F. Effect of obesity on response to cardiovascular drugs in pediatric patients with renal disease. Pediatr Nephrol. 2009;24:815–821. doi: 10.1007/s00467-008-1064-y. [DOI] [PubMed] [Google Scholar]
- 43.Sparreboon A, Wolff AC, Mathijssen RHJ, et al. Evaluation of alternate size descriptors for dose calculation of anticancer drugs in the obese. J Clin Oncol. 2007;25:4707–4713. doi: 10.1200/JCO.2007.11.2938. [DOI] [PubMed] [Google Scholar]
- 44.Hunter RJ, Navo MA, Thaker PH, et al. Dosing chemotherapy in obese patients: actual versus assigned body surface area (BSA) Cancer Treat Rev. 2009;35:69–78. doi: 10.1016/j.ctrv.2008.07.005. [DOI] [PubMed] [Google Scholar]
- 45.Baillargeon J, Langevin AM, Lewis M, et al. L-Asparaginase as a marker of chemotherapy dose modification in children with acute lymphoblastic leukemia. Cancer. 2005;104:2858–2861. doi: 10.1002/cncr.21584. [DOI] [PubMed] [Google Scholar]
- 46.Hijiya N, Panetta JC, Zhou Y, et al. Body mass index does not influence pharmacokinetics or outcome of treatment of children with acute lymphoblastic leukemia. Blood. 2006;108:3997–4002. doi: 10.1182/blood-2006-05-024414. [DOI] [PMC free article] [PubMed] [Google Scholar]
- 47.Dupuis LL, Najdova M, Saunders EF. Retrospective appraisal of busulfan dose adjustment in children. Bone Marrow Transplant. 2000;26:1143–1147. doi: 10.1038/sj.bmt.1702700. [DOI] [PubMed] [Google Scholar]
- 48.Dupuis LL, Najdova M, Saunders EF. Retrospective appraisal of busulfan dose adjustment in children-Corrigendum. Bone Marrow Transplantation. 2003;31:729. doi: 10.1038/sj.bmt.1703926. [DOI] [PubMed] [Google Scholar]
- 49.Evans WE, Relling MV, Rodman JH, et al. Conventional compared with individualized chemotherapy for childhood acute lymphoblastic leukemia. N Engl J Med. 1998;338:499–505. doi: 10.1056/NEJM199802193380803. [DOI] [PubMed] [Google Scholar]
- 50.Wall AM, Gajjar A, Link A, et al. Individualized methotrexate dosing in children with relapsed acute lymphoblastic leukemia. Leukemia. 2000;14:221–225. doi: 10.1038/sj.leu.2401673. [DOI] [PubMed] [Google Scholar]
- 51.Relling MV, Hancock ML, Boyett JM, et al. Limited and optimal sampling strategies for etoposide and etoposide catechol in children with leukemia. J Pharmacokinet Pharmacodyn. 2002;29:171–188. doi: 10.1023/a:1019755608555. [DOI] [PubMed] [Google Scholar]
- 52.Eksborg S, Palm C, Bjork O. A comparative pharmacokinetic study of doxorubicin and 4-epi-doxorubicin in children with acute lymphoblastic leukemia using a limited sampling procedure. Anti-Cancer Drugs. 2000;11:129–136. doi: 10.1097/00001813-200002000-00010. [DOI] [PubMed] [Google Scholar]
- 53.Thompson PA, Rosner GL, Matthay KK, et al. Impact of body composition on pharmacokinetics of doxorubicin in children: A Glaser Pediatric Research Network study. Cancer Chemother Pharmacol. 2009;64:243–251. doi: 10.1007/s00280-008-0854-z. [DOI] [PubMed] [Google Scholar]
- 54.Eksborg S, Soderhall S, Frostvik-Stolt M, et al. Plasma pharmacokinetics of etoposide (VP-16) after i.v. administration to children. Anti-cancer Drugs. 2000;11:237–241. doi: 10.1097/00001813-200004000-00002. [DOI] [PubMed] [Google Scholar]
- 55.Sauer M, Rydholm N, Piatkowski J, et al. Nephrotoxicity due to intermediate-dose methotrexate without rescue in an obese adolescent with acute lymphoblastic leukemia. Pediatr Hematol Oncol. 2002;19:135–140. doi: 10.1080/08880010252825722. [DOI] [PubMed] [Google Scholar]
- 56.Stark AN, Jackson G, Carey PJ, et al. Severe renal toxicity due to intermediate-dose methotrexate. Can Chemother Pharm. 1989;24:243–245. doi: 10.1007/BF00257626. [DOI] [PubMed] [Google Scholar]
- 57.Rose JB, Theroux MC, Katz MS. The potency of succinylcholine in obese adolescents. Anesth Analg. 90:576–578. doi: 10.1097/00000539-200003000-00015. 200. [DOI] [PubMed] [Google Scholar]
- 58.Brown TCK, Meretoja OA, Bell B, et al. Suxamethonium-electromyographic studies in children. Anaesth Intens Care. 1990;18:473–476. doi: 10.1177/0310057X9001800409. [DOI] [PubMed] [Google Scholar]
- 59.Minana JS, Ganuza MG, Millan PF, et al. Hepatitis B immunoresponsiveness in adolescents: a revaccination proposal after primary vaccination. Vaccine. 1996;14:103–106. doi: 10.1016/0264-410x(95)00176-2. [DOI] [PubMed] [Google Scholar]
- 60.Eliakim A, Swindt C, Zaldivar F, et al. Reduced tetanus antibody titers in overweight children. Autoimmunity. 2006;39:137–141. doi: 10.1080/08916930600597326. [DOI] [PMC free article] [PubMed] [Google Scholar]
- 61.Rajakumar K, Fernstrom JD, Holick MF, et al. Vitamin D status and response to vitamin D3 in obese vs. non-obese African American children. Obesity. 2008;16:90–95. doi: 10.1038/oby.2007.23. [DOI] [PubMed] [Google Scholar]
- 62.Abernethy DR, Greenblatt DJ. Phenytoin disposition in obesity: Determination of loading dose. Arch Neurol. 1985;42:468–471. doi: 10.1001/archneur.1985.04060050066010. [DOI] [PubMed] [Google Scholar]