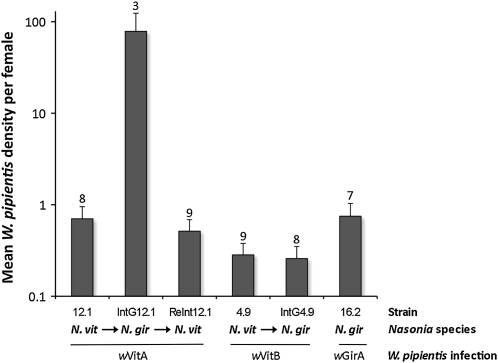
Figure 5.—
Increase in W. pipientis densities is specific to the bacterial genotype. Columns denote the mean W. pipientis densities ± standard error in the native N. vitripennis host (A-infected 12.1 and B-infected 4.9), the native N. giraulti host (A-infected 16.2), and the introgressed N. giraulti (A-infected IntG12.1 and B-infected IntG4.9) and reintrogressed N. vitripennis (A-infected ReInt12.1) genetic backgrounds. Numbers above columns denote female sample size.

