Figure 1.—
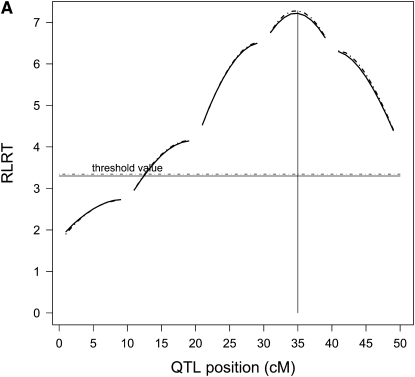
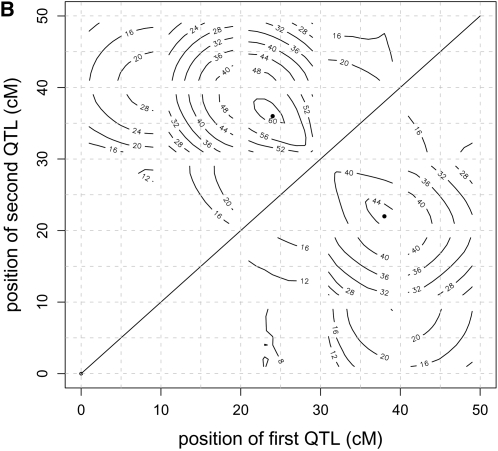
For a single QTL (scenario 1) average RLRT profiles (A) of the individual model (dashed line) and the reduced model (solid line) nearly coincide, and so do their significance thresholds. When two QTL were present (scenario 3), contour plots (B) of the RLRT surfaces from the reduced model (below diagonal) and the individual model (above diagonal) showed a similar shape, but different absolute heights (respective RLRT maxima 44.52 and 60.62). Averaging was over 1000 replications.


