Abstract
In basic research on spinal cord injury (SCI), behavioral evaluation of the SCI animal model is critical. However, it is difficult to accurately evaluate function in the mouse SCI model due to the small size of mice. Although the open-field scoring scale is an outstanding appraisal method, supplementary objective tests are required. Using a compact SCANET system, in which a mouse carries out free movement for 5 min, we developed a novel method to detect locomotor ability. A SCANET system samples the horizontal coordinates of a mouse every 0.1 s, and both the speed and acceleration of its motion are calculated at each moment. It was found that the maximum speed and acceleration of motion over 5 min varied by injury severity. Moreover, these values were significantly correlated with open-field scores. The maximum speed and acceleration of SCI model mice using a SCANET system are objective, easy to obtain, and reproducible for evaluating locomotive function.
1. Introduction
In basic research on spinal cord injury (SCI), accurate evaluation of motor function in animal models is important. Although the Basso-Beattie-Bresnahan (BBB) score and the Basso Mouse Scale (BMS) are widely used [1, 2], objective supplemental tests are desirable, and various methods have been developed [3–8]. However, with any method of observing the motion of an animal, detection of the best performance of the hindlimbs is almost impossible, since the animal does not perform as the observer intends. A novel method to evaluate the maximum locomotor ability of a mouse using the SCANET system is presented [9]. SCANET system is originally a device which measures voluntary motor activity of an animal. It consists of 45-cm-square Plexiglas cage, frames which contain infrared sensors and enclose the cage, and a notebook computer. Infrared sensors were horizontally placed throughout the cage, and the X-Y coordinates of a freely moving animal in the box were recorded every 0.1 s. After recording for 5 min, the change in the coordinates per unit time was calculated for the speed, and the change in the speed per unit time was calculated as the acceleration. The maximum speed and maximum acceleration extracted from the 5 min of data were taken as the best locomotor function. There were significant differences in these parameters among the contusion, the transection, and the control groups throughout the observation period, and, especially in the contusion group, they were significantly correlated with the BMS score during the recovery process.
2. Materials and Methods
2.1. Spinal Cord Injury Model
Seventeen 6-week-old adult female C57BL/6J mice were used. The mice were anesthetized with an intraperitoneal injection of ketamine (100 mg/kg) and xylazine (10 mg/kg). The dorsal surface of the dura mater at the T10 level was exposed by laminectomy, and spinal cord injury was induced by (1) producing moderate contusion with an IH impactor (n = 6, impact force = 60 kdyn), as reported previously [10] or (2) transecting the spinal cord transversely with microscissors (n = 6). Only laminectomy was performed in the control group (n = 5). The muscles and skin were closed in layers, and the animals were placed in a temperature-controlled chamber until thermoregulation was re-established. Manual voiding of the bladder was performed twice per day until reflex bladder emptying was re-established. All the experiments and procedures in our study were approved by the Keio University Animal Research Committee in accordance with the Laboratory Animal Welfare Act, the Guide for the Care and Use of Laboratory Animals (National Institutes of Health, Bethesda, USA), and the Guidelines and Policies for Animal Surgery provided by the Animal Study Committees of the Central Institute for Experimental Animals and of Keio University.
2.2. Basso Mouse Scale Score
Motor function of the hindlimbs was evaluated by open-field testing using the methodology of the Basso Mouse Scale (BMS) score on postoperative days (POD) 1, 7, 14, 21, 28, 35, and 42, as described by Basso et al. [2].
2.3. SCANET
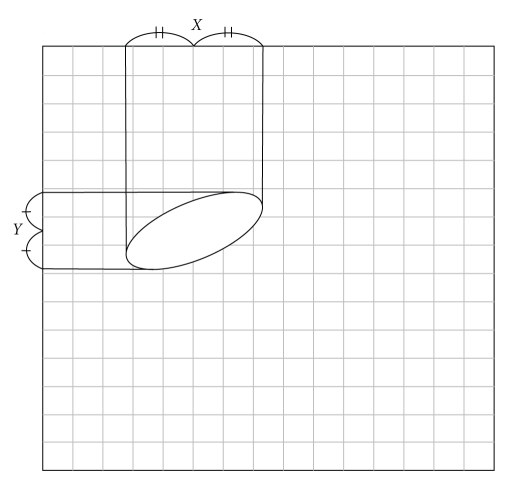
The SCANET MV-40 (MELQUEST Co., Ltd., Toyama, Japan) is an automatic analysis system for measuring the locomotor activity of small animals that has been previously described in [9, 11]. Briefly, infrared sensors are arranged in a horizontal plane of a transparent Plexiglas box of 45 cm around to make a sensor field with a 6-mm grid pattern. When something interferes with the paths of the infrared rays, the coordinates of the center of the object are recorded in a computer every 0.1 s (Figure 1). Moreover, by inserting another sensor frame perpendicularly, we can simultaneously observe at different height levels and detect rearing of the mouse. The height of the lower frame was set at 1.5 cm from the floor, and the upper frame was 9.5 cm from the floor. We waited for 10 s after putting each mouse into the box until it calmed down, and then we measured for 5 min. The test was conducted 1, 7, 14, 21, 35, and 42 days after injury in the same environment. The default data obtained by SCANET system are “M1,” which is the number of episodes of movement longer than 12 mm “M2,” which is the number of episodes of movement longer than 60 mm; “RG,” which is the number of episodes of rearing. However, the X and Y coordinates are recorded as raw data every 0.1 s and are available from the computer (Table 1). From these, the amount of the distance moved per unit time (speed) and the change in the speed per unit time (acceleration) were calculated at each instant of time. Since the time interval was 0.1 s and the unit length in raw data was 0.6 cm, speed and acceleration were calculated as follows:
Figure 1.
Schema of the inside of the Plexiglas cage. An ellipse expressed a mouse. Infrared sensors were arranged in a grid pattern, and the coordinates X and Y of the center of the object were recorded continuously.
Table 1.
An example of the list of raw data, calculated speed, and acceleration.
| Time (mm:ss.f) | X | Y | Speed (m/s) | Acceleration (m/s2) |
|---|---|---|---|---|
| — | — | — | — | — |
| — | X1 | Y1 | — | — |
| — | X2 | Y2 | S1 | — |
| 59:09.6 | 3.5 | 8.5 | S2 | A1 |
| 59:09.7 | 4.0 | 9.0 | 0.0424 | A2 |
| 59:09.8 | 4.0 | 7.0 | 0.1200 | 0.7757 |
| 59:09.9 | 5.0 | 5.5 | 0.1082 | −0.1183 |
| 59:10.0 | 6.5 | 4.5 | 0.1082 | 0.0000 |
| 59:10.1 | 6.0 | 7.0 | 0.1530 | 0.4480 |
| 59:10.2 | 4.0 | 16.0 | 0.5532 | 4.0020 |
| — | — | — | — | — |
| (1) |
Then, the maximum speed and the maximum acceleration were extracted from the whole 5 min of data as measures of the best locomotor function. Since the SCANET system sometimes lacks the time or coordinate data for a moment, only successive data were used.
2.4. Histological Analysis
To confirm the reproducibility of SCI model in each mouse, histological analysis was performed. 56 days after SCI, all animals were deeply anesthetized with an intraperitoneal injection of ketamine (100 mg/kg) and xylazine (10 mg/kg) and transcardially perfused with 4% paraformaldehyde in 0.1 M phosphate-buffered saline (PBS). The spinal cord tissue was removed and postfixed in 4% paraformaldehyde in PBS for a few hours at room temperature. The tissue samples were immersed in 10% sucrose in PBS at 4°C for 24 hs, placed in 30% sucrose in PBS for 48 hs, and embedded in OTC compound. The embedded tissue was immediately frozen in liquid nitrogen and stored at −80°C until use. Frozen spinal cord tissues were sectioned on a cryostat at 20 μm in the axial plane. The sections were dried and stained with hematoxylin and eosin.
2.5. Statistics Analysis
All values are reported as the means ± SEM. Between-group comparisons were made by analysis of variance (ANOVA) followed by Scheffe's post hoc test at each postinjury time point. The strength of correlation with the BMS score was determined using the Pearson correlation coefficient.
3. Result
3.1. Histological Findings
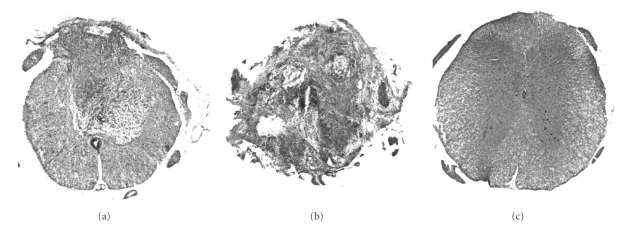
The representative axial sections of the transection and contusion groups are shown in Figure 2. In the contusion group, infiltration of the inflammatory cells was observed at the dorsal part of the lesion site, and the ventral part of the spinal cord was preserved (Figure 2(a)). On the other hand, in the transection group, normal construction of the spinal cord was totally destroyed and replaced by inflammatory cells and fibrous tissues (Figure 2(b)).
Figure 2.
HE staining of representative axial spinal cord sections from the three groups of mice. (a) Contusion model: the ventral part of the spinal cord tissue was preserved, whereas the dorsal part was replaced by fibrous scar tissue after SCI. (b) Transection model: normal structure of the spinal cord totally disappeared. (c) Control mouse.
3.2. BMS Score
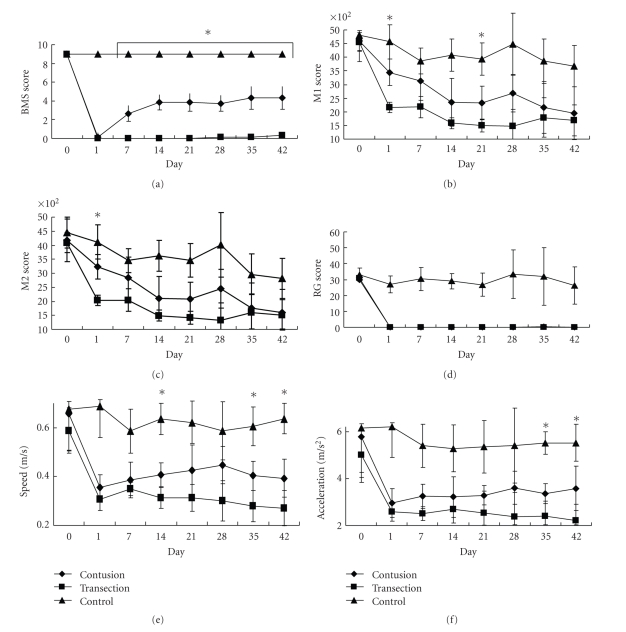
Both the contusion and the transection injury resulted in complete paraplegia on POD 1 (Figure 3(a)). Although the BMS scores of the transection group did not show any recovery, those of the contusion group gradually increased and reached a plateau around a score of 4 on POD 14. Significant differences in BMS scores were observed among the three groups at all time points examined, except for POD 1.
Figure 3.
Time course of each parameter. (a) BMS score. (b) M1 score. (c) M2 score. (d) Rearing score (RG). (e) Speed. (f) Acceleration. M1 and M2 scores hardly showed a difference between the contusion and transection groups after 1 week, and they gradually decreased despite the animal's recovery of BMS score. The speed and acceleration showed clear differences among the three groups, especially in the late phase of SCI. *P < .05.
3.3. Evaluation by SCANET
The control group showed the highest values of M1, M2, speed, and acceleration, followed by the contusion group and the transection group (Figure 3). The contusion and transection groups had very low RG numbers, while the control group had a stable number of RGs (Figure 3(d)). There were no significant differences in M1 and M2 among the three groups, except on PODs 1 and 21 (Figure 3(b)). However, speed was significantly different on PODs 14, 35, and 42 among the three groups, and the acceleration was significantly different on PODs 35 and 42 (Figures 3(e) and 3(f)). These results suggest that speed and acceleration reflected the severity of spinal cord injury better than M1 and M2 in the chronic phase of SCI.
3.4. Correlation between BMS Score and Speed/Acceleration of Movement
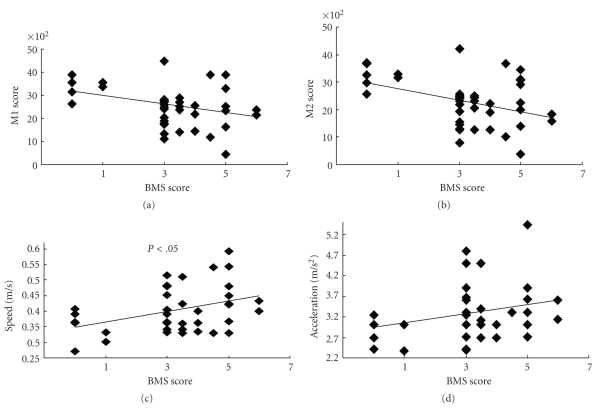
The correlation diagrams of M1, M2, speed, and acceleration with the BMS score in the contusion group are shown in Figure 4. Since M1 and M2 decreased gradually despite the increase in BMS score, there were no significant correlations between the BMS score and M1 and M2. On the other hand, speed and acceleration increased gradually, and the speed showed a significant correlation with the BMS score. These results suggest that the speed and acceleration are the best measures for observing functional recovery, not only to reflect the severity of injury.
Figure 4.
Correlation diagrams of parameters. M1 and M2 scores had minus correlations with the BMS score, while the speed and acceleration showed a strong correlation. Coefficients of correlation are −0.84 for M1 and BMS, −0.83 for M2 and BMS, 0.75 for speed and BMS, and 0.77 for acceleration and BMS.
3.5. Specific Features of Speed and Acceleration
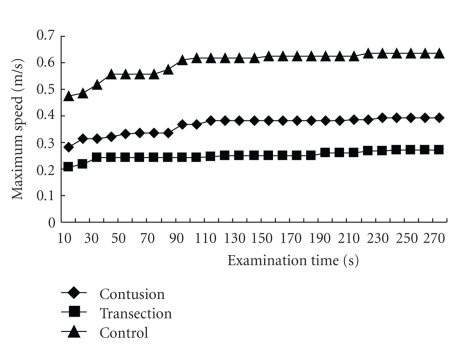
For the BMS score, 5 min of observation are required for each mouse, so the same observation period was adopted for the present method. In order to examine how many minutes were suitable for the evaluation of the animal's performance by SCANET, the maximum speed of the mice on POD 42 was plotted for each time-duration (Figure 5). The maximum speed gradually increased and reached a plateau within 2 min in all groups. Therefore, 5 min were sufficient, and an even shorter examination time might has been enough for the SCANET evaluation.
Figure 5.
The maximum speed values to each time point were plotted with POD 42 data. They gradually increased and reached plateaus around 2 min in all groups. More than 2 minutes of examination time yielded slight difference.
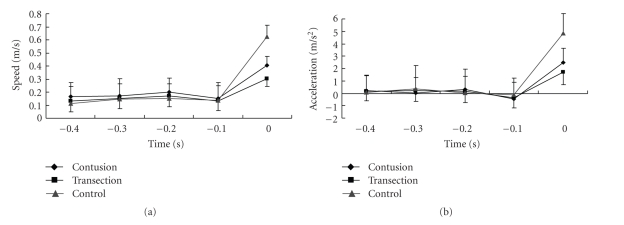
The changes in speed and acceleration just before the maximum speed were also investigated, because we hypothesized that the mice with high BMS reached the maximum speed in a moment with their high instantaneous force, while the mice with low BMS increased their speed gradually. All mice reached the top speed within 0.1 s from a certain speed (Figure 6). The acceleration tended to decrease just before the maximum speed, and this might reflect the “premotion silent period” (exhaustion just before putting power into a voluntary muscle [12]) of an animal, because acceleration and muscle power were strongly correlated by the equation Force = Mass × Acceleration.
Figure 6.
Shifting of the speed and acceleration just before reaching the maximum speed. Time 0 was the moment of maximum speed. Speed did not gradually increase to the maximum, and mice of all groups showed explosive power in 0.1 s to the maximum speed. Interestingly, acceleration 0.1 s before the maximum speed was under zero and that suggests muscles that were released just before strong contraction.
4. Discussion
In the present study, measurements of the maximum speed and acceleration of SCI model mice were found to be good indicators of the mice's motor performance, because they were constant in the control and transection groups and increased in the contusion group during the recovery of hindlimb function. In the transection group, the mice were not able to move their hindlimbs at all, but performed at half the speed of the control mice with only their forelimbs.
In this system, the moment of the best performance of a freely moving mouse can be detected. Therefore, the speed and acceleration may increase unwillingly if a mouse jumps by being surprised at a noise or a mouse is upset just after being put in the SCANET box. Avoidance of loud sound or shaking is critical for accurate evaluation.
Although the small movement M1 and the large movement M2 were also correlated with BMS at first, they gradually decreased during the follow-up period, as previously reported [9]. This might be due to the animal's habituation to the device, followed by lack of motivation. On the other hand, speed and acceleration did not decrease, suggesting that even a lackadaisical mouse had a moment to perform to its best ability during 5 min of observation. We also reconfirmed that the RG scores were almost zero in the contusion group, suggesting that it was difficult for C57BL/6 mice to stand up with only the hindlimbs after a 60-kdyn-contusive SCI.
Objectivity is one of the most important factors when evaluating motor function. While the open-field score is the simplest method, its value depends on the examiner, and subjectivity easily affects its accuracy [3]. Although evaluations using footprints or a treadmill seem objective, examiners discriminate certain parts or a range from the huge amount of data, so they still remain subjective [4, 5, 13]. In the present method, the values never vary by examiner and are calculated from the complete data, so they are always completely objective.
Furthermore, ethical approval is necessary for animal studies, and the procedure must be as noninvasive as possible [14]. Behavioral analyses, such as the inclined test, beam walking test, and ladder test, cause mechanical stress to mice [7, 8, 15]. In belt-using devices, like a treadmill and automatic gait-recording machines, mouse behavior is severely restricted, and the moving belt sometimes harms the hindlimbs. With the present method, mice move freely as in a cage, and there is no stimulation and little stress. Hence, the present method is entirely noninvasive.
A simple and easy procedure is also desired for long-term follow-up of mice. Behavioral analysis, such as the inclined test, the beam walking test, or the ladder test, requires simple devices, but the cooperation of capricious mice is required, and examiners often have difficulty obtaining stable data. In contrast, using the present method, a mouse simply needs to be placed in the SCANET box, so that the acquisition of data is extremely easy.
5. Conclusion
In the evaluation of locomotor function in SCI model mice, inspections from various perspectives are desirable. Evaluation of maximum speed and acceleration of mouse movement with a SCANET system is simple, objective, and ethical. It is a novel and fine method for spinal cord-injured model mice and can complement other existing tests. Further examinations will be required for other animals.
Acknowledgments
The authors are grateful to Ms. Harada for the special care of the mice and to Drs. Nori and Yasuda for their excellent technical assistance during the surgical operations and data collection. This work was supported by the Project for Realization of Regenerative Medicine and Support for the core institutes for iPS cell research from the Ministry of Education, Culture, Sports, Science and Technology of Japan (MEXT).
References
- 1.Basso DM, Beattie MS, Bresnahan JC. A sensitive and reliable locomotor rating scale for open field testing in rats. Journal of Neurotrauma. 1995;12(1):1–21. doi: 10.1089/neu.1995.12.1. [DOI] [PubMed] [Google Scholar]
- 2.Basso DM, Fisher LC, Anderson AJ, Jakeman LB, McTigue DM, Popovich PG. Basso mouse scale for locomotion detects differences in recovery after spinal cord injury in five common mouse strains. Journal of Neurotrauma. 2006;23(5):635–659. doi: 10.1089/neu.2006.23.635. [DOI] [PubMed] [Google Scholar]
- 3.Beare JE, Morehouse JR, Devries WH, et al. Gait analysis in normal and spinal contused mice using the treadscan system. Journal of Neurotrauma. 2009;26(11):2045–2056. doi: 10.1089/neu.2009.0914. [DOI] [PMC free article] [PubMed] [Google Scholar]
- 4.Bervar M. Video analysis of standing—an alternative footprint analysis to assess functional loss following injury to the rat sciatic nerve. Journal of Neuroscience Methods. 2000;102(2):109–116. doi: 10.1016/s0165-0270(00)00281-8. [DOI] [PubMed] [Google Scholar]
- 5.de Medinaceli L, Freed WJ, Wyatt RJ. An index of the functional condition of rat sciatic nerve based on measurements made from walking tracks. Experimental Neurology. 1982;77(3):634–643. doi: 10.1016/0014-4886(82)90234-5. [DOI] [PubMed] [Google Scholar]
- 6.Fehlings MG, Tator CH, Linden RD, Piper IR. Motor and somatosensory evoked potentials recorded from the rat. Electroencephalography and Clinical Neurophysiology. 1988;69(1):65–78. doi: 10.1016/0013-4694(88)90036-3. [DOI] [PubMed] [Google Scholar]
- 7.Goldstein LB, Davis JN. Beam-walking in rats: studies towards developing an animal model of functional recovery after brain injury. Journal of Neuroscience Methods. 1990;31(2):101–107. doi: 10.1016/0165-0270(90)90154-8. [DOI] [PubMed] [Google Scholar]
- 8.Soblosky JS, Colgin LL, Chorney-Lane D, Davidson JF, Carey ME. Ladder beam and camera video recording system for evaluating forelimb and hindlimb deficits after sensorimotor cortex injury in rats. Journal of Neuroscience Methods. 1997;78(1-2):75–83. doi: 10.1016/s0165-0270(97)00131-3. [DOI] [PubMed] [Google Scholar]
- 9.Mikami Y, Toda M, Watanabe M, Nakamura M, Toyama Y, Kawakami Y. A simple and reliable behavioral analysis of locomotor function after spinal cord injury in mice: technical note. Journal of Neurosurgery. 2002;97(1):142–147. doi: 10.3171/spi.2002.97.1.0142. [DOI] [PubMed] [Google Scholar]
- 10.Cafferty WBJ, Gardiner NJ, Das P, Qiu J, McMahon SB, Thompson SWN. Conditioning injury-induced spinal axon regeneration fails in interleukin-6 knock-out mice. Journal of Neuroscience. 2004;24(18):4432–4443. doi: 10.1523/JNEUROSCI.2245-02.2004. [DOI] [PMC free article] [PubMed] [Google Scholar]
- 11.Mikami Y, Okano H, Sakaguchi M, et al. Implantation of dendritic cells in injured adult spinal cord results in activation of endogenous neural stem/progenitor cells leading to de novo neurogenesis and functional recovery. Journal of Neuroscience Research. 2004;76(4):453–465. doi: 10.1002/jnr.20086. [DOI] [PubMed] [Google Scholar]
- 12.Kawahats K, Miyashita M. Electromyogram premotion silent period and tension development in human muscle. Experimental Neurology. 1983;82(2):287–302. doi: 10.1016/0014-4886(83)90402-8. [DOI] [PubMed] [Google Scholar]
- 13.Rossignol S. Neural control of stereotypic limb movements. In: Rowell LB, Sheperd JT, editors. Handbook of Physiology. New York, NY, USA: Oxford University Press; 1996. pp. 173–216. [Google Scholar]
- 14.Gee H. Animal guidelines. Nature. 1988;334(6177):p. 7. doi: 10.1038/334007c0. [DOI] [PubMed] [Google Scholar]
- 15.Rivlin AS, Tator CH. Objective clinical assessment of motor function after experimental spinal cord injury in the rat. Journal of Neurosurgery. 1977;47(4):577–581. doi: 10.3171/jns.1977.47.4.0577. [DOI] [PubMed] [Google Scholar]


