Abstract
Mild hyperthermia is increasingly important for the activation of temperature-sensitive drug delivery vehicles. Noninvasive ultrasound thermometry based on a 2-D speckle tracking algorithm was examined in this study. Here, a commercial ultrasound scanner, a customized co-linear array transducer, and a controlling PC system were used to generate mild hyperthermia. Because the co-linear array transducer is capable of both therapy and imaging at widely separated frequencies, RF image frames were acquired during therapeutic insonation and then exported for off-line analysis. For in vivo studies in a mouse model, before temperature estimation, motion correction was applied between a reference RF frame and subsequent RF frames. Both in vitro and in vivo experiments were examined; in the in vitro and in vivo studies, the average temperature error had a standard deviation of 0.7°C and 0.8°C, respectively. The application of motion correction improved the accuracy of temperature estimation, where the error range was −1.9 to 4.5°C without correction compared with −1.1 to 1.0°C following correction. This study demonstrates the feasibility of combining therapy and monitoring using a commercial system. In the future, real-time temperature estimation will be incorporated into this system.
Keywords: ultrasound, thermometry, speckle tracking, mild hyperthermia, thermal strain
I. INTRODUCTION
Ultrasound-induced hyperthermia has been applied to induce physiological changes and as a method to enhance drug delivery [1, 2]. Although high-intensity focused ultrasound (HIFU) can achieve a temperature of 70 to 80°C for thermal ablation [3–5], in mild hyperthermia, the temperature is elevated to 39 to 42°C to enhance vascular permeability [6], blood flow [7], tissue oxygenation [8], drug delivery efficiency [9] and to decrease pH [10]. Local drug delivery resulting from the combination of temperature-sensitive liposomes and mild hyperthermia has been widely shown to be feasible and can improve the treatment of local lesions [11–14]. According to the Arrhenius relationship, the cumulative equivalent minutes at 43°C (CEM43) defines the threshold of thermal dose for cellular mortality [15]. Our previous study has maintained a CEM43 below 1 to enhance image-guided drug delivery [11, 16].
During therapy, temperature monitoring is essential for controlling thermal dose. Several modalities have been applied for temperature measurement, e.g. insertion of thermocouples, magnetic resonance imaging (MRI) [17], impedance tomography [18], microwave radiometry [19, 20], thermal acoustic noise [21] and ultrasound [22–26]. Measurement by inserting a thermocouple into a target tissue is the most direct method and has the advantages of accurate measurement and high spatial and temporal resolution. A thermocouple incorporated within a needle allows insertion into deep tissue. However, creation of a temperature map for the entire treatment volume is not possible with thermocouples. MRI has the required accuracy and spatial resolution, but usage is restricted by the cost and access to the region of interest during therapy. Therefore, ultrasound is an attractive method with imaging-based thermometry, low cost and convenience.
Ultrasonic temperature measurement uses a temperature-based change in the speed of sound or thermal expansion in the heated region. In each case, the temperature increase is detected by comparing ultrasonic images frame-by-frame over time. The resulting change in the sound velocity results in an apparent speckle displacement in the heated region, and with an adequate acquisition frame rate, the apparent displacement can be measured accurately. Miller et al. defined the fundamental limitations of the technique and the minimum ultrasonic SNR required to visualize the heated region in liver [27]; here, within a superficial tumor, a high SNR facilitated data analysis. Typically, an additional linear array transducer is applied for B-mode or RF data acquisition, and the images are processed off-line for temperature estimation.
A commercial ultrasound scanner has served as the foundation of our system, to which we have added a custom-designed co-linear array ultrasound transducer, modified system software, and a real-time temperature feedback controller. The co-linear array transducer provides the dual functions of imaging and therapy, combining therapeutic 1.54-MHz arrays together with a 5.5-MHz imaging array [28, 29]. Low frequency ultrasound (~1 MHz) has been applied in tissue ablation, cavitation, and hyperthermia. Here, the low frequency array was optimized for high efficiency and thermal conductivity, whereas the imaging array was optimized for high bandwidth and thus axial resolution [28]. High thermal conductivity on the low frequency array decreases power loss and increases the energy delivered to the target. The availability of an imaging array with high bandwidth and a higher center frequency allows the detection of small image changes with temperature, and thus, temperature increases of a few degrees can be detected. Our goal has been to very rapidly increase tissue temperature by 4 to 5°C in a tumor region of interest (ROI) typically on the order of 5 × 5 × 5 mm. Although ultrasound frequencies above 1 MHz increase heat deposition, treatment of large regions is increasingly difficult at higher frequencies (because of the tighter focus) and skin burns are more common for tumors near the skin surface. With the dual array integrated within the clinical scanner, the therapeutic ROI can be controlled via the operator interface. Because the therapy and imaging beams are pre-aligned, additional alignment between therapy and imaging is not required.
A. Background
Noninvasive temperature estimation is accomplished using a correlation-based 2-D speckle tracking algorithm [24, 30]. This method can be applied on both detected B-mode images and RF data. Calculation based on B-mode images is convenient for commercial ultrasound scanners; however, the envelope detection algorithm may sacrifice precision compared with processing RF images. Here, we process the RF echoes, providing a sensitive detection of changes of sound speed, and thus temperature. Shifts in both the lateral and depth directions can be estimated; however, because of the small temperature increments in this study only the displacement along the depth direction is estimated. Abolhassani et al. has used a 1-D model to describe a relationship between cumulative apparent displacement in depth and thermal strain, which is the derivative of the cumulative displacement with respect to distance [24]. Simon et al. derived an expression for the temperature change at depth z, δT(z), with the change of speed of sound and thermal expansion of tissue [31]:
| (1) |
where c0(z) is the speed of sound at depth z, δt(z) is the apparent time shift between echoes of successive frames at a depth of z, α(z) is the linear coefficient of thermal expansion for the tissue at z, and β(z) is the linear coefficient of sound speed and temperature. The change in sound speed is approximately 2 m/s/°C in liver tissue for small deviations from the ambient temperature [26], and in this study, a change of ~13 and ~5 m/s/°C was observed for agarose phantoms and Met-1 tumors, respectively. Both α(z) and β(z) have units of °C−1 and typically, α(z) (~0.01%°C−1) is about one tenth of β(z) (0.07 to 0.13%°C−1) [25, 30, 32, 33]. Compared with the temperature-induced change in the speed of sound, thermal expansion is very small for water-bearing tissues (such as muscle or the tumors considered here) and can be ignored in mild hyperthermia [24]. The 1/(α(z) − β(z)) term is a key tissue dependent property and is usually represented as
| (2) |
Assuming k(z) and c0(z) to be invariant with respect to z, (1) can be represented as
| (3) |
where ΔT(z) is the incremental change in temperature from one sample to another on a given scan line, Δd is the cumulative displacement, Δd=δt× c0/2 and (∂/∂z)(Δd ) is the thermal strain. An approximately linear relationship exists between thermal strain and the temperature difference at depth z in the mild hyperthermia range. To evaluate this relationship, α and β can be measured or a calibration curve can be developed.
There are many gradient operators that can be applied to the cumulative displacements for thermal strain calculation. Here, the Sobel operator was used, and the vertical derivative approximation was implemented for thermal strain in the depth direction. The Sobel operator provides both differencing and smoothing effects [34], and the smoothing effect decreases noise that is enhanced by derivative operations.
We chose to acquire several sets of data with varied temperature changes, and applied a calibration curve to represent thermal strain-temperature difference properties for a specified phantom or tumor. Finally, thermometry maps were generated and overlaid upon structural B-mode images. Temperatures estimated by our algorithm were validated by thermocouple measurements.
B. Objective
The objective of this work is to explore the use of a dual frequency co-linear array geometry for simultaneously generating and monitoring mild-hyperthermia temperature distributions both in vitro and in vivo.
II. MATERIALS AND METHODS
A. Ultrasound system
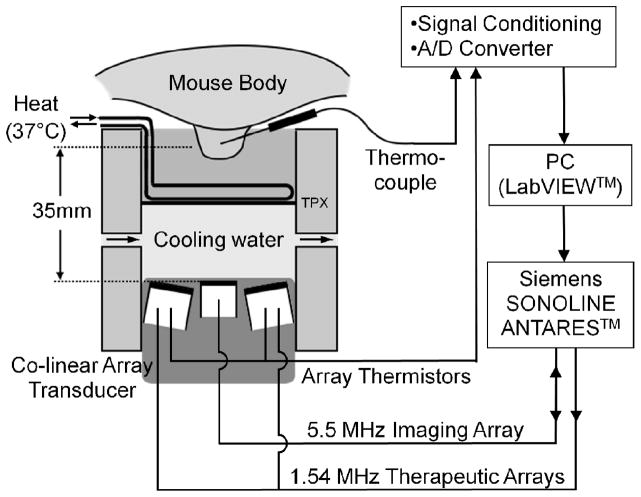
The Siemens Antares ultrasound scanner (Sonoline Antares, Siemens Medical Systems, Inc., Issaquah, WA), a customized co-linear array ultrasound transducer, and a temperature feedback system are combined to create a therapeutic ultrasound system (Fig. 1). The co-linear array transducer consists of three parallel rows of array elements, including two outer rows each with 64 elements at 1.54 MHz and one center row of 128 elements at 5.5 MHz. The two outer rows generate therapeutic beams while the middle array generates the periodic B-mode images at 5.33 MHz for this study. The two therapeutic rows are tilted at 10.6° normally toward to the centerline, and all three rows are co-focused at 35 mm in the depth direction. The co-linear array transducer is installed vertically pointing upward into a double-layer holder; the upper chamber is filled with 37°C water, and the lower chamber contains circulating degassed cold water to improve the efficiency of the transducer. The two layers are separated by a TPX membrane, which is a polymethylpentene material with low distortion of sound waves. The therapeutic target, a phantom (in vitro) or a tumor (in vivo), is placed in the upper chamber for treatment. A 30-gauge × 13-mm T-type needle thermocouple (HYP-1, Omega Engineering, Inc., Stamford, CT) is inserted into the center of the target for real-time temperature monitoring. The focus of the therapeutic beam is located at the tip of this thermocouple. In the in vitro studies, two bare-junction thermocouples (PT-6, Physitemp Instruments, Inc., Clifton, NJ) are inserted into the phantom on each side of the needle thermocouple for multiple-temperature examination. The time constants of the HYP-1 and PT-6 thermocouples are < 0.25 and 0.01 s, respectively. Temperature measurements are then fed back to an analog-to-digital converter (NI SCXI-1600, National Instruments Co., Austin, TX), and the temperature from the needle thermocouple is processed by a proportional-integral-derivative (PID) controller embedded in a LabVIEW program (National Instruments Co.) on a PC for closed-loop control. Besides the regular proportional (Kp), integral (Ki) and derivative (Kd) parameters, this system uses an anti-windup term (Kwu) to prevent overshoot and improve the system stability [35]. The total acoustic power (TAP) is variable, and the LabVIEW system generates pulses whose repetition rate is controlled by the PID algorithm by sending commands to the Antares scanner through the diagnostic user interface (DUI). The DUI is an Internet-based interface specific to the Siemens Antares that allows access to software and hardware variables to control the scanner.
Fig. 1.
Schematic representation of the insonation structure. Therapy (1.54 MHz) and imaging (5.33 MHz) are generated by separate arrays that are combined within a single housing, both driven by the Siemens Antares. Cool water is applied to the transducer surface and warm water to the skin of the mouse. A LabVIEW program controls the therapeutic pulses, with the parameters sent to the Antares through the Diagnostic User Interface (DUI).
The primary PID control parameter is duty factor (DF), which is converted to the pulse repetition frequency (PRF). The PRF limit in this system is between 100 and 5000 Hz, corresponding to a DF from 0.0065 to 0.325. The length of the therapeutic pulse is fixed at 100 cycles, and the mechanical index is maintained below 1.9 to avoid cavitation.
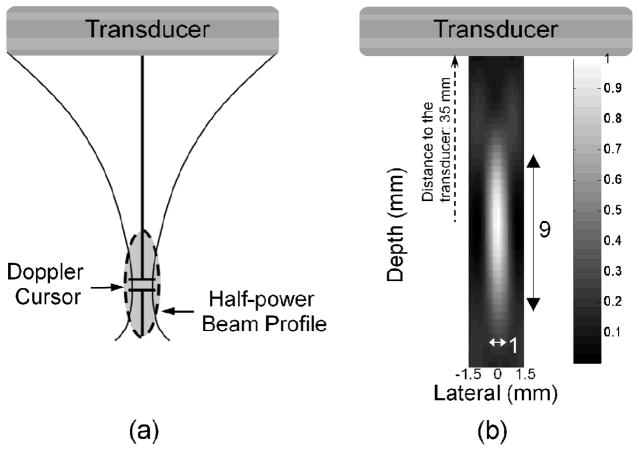
To generate an image with a varied temperature, insonation was directed only along one line of sight, as shown in Fig. 2. Over the range of depth explored here, all therapeutic elements contribute to the single transmitted beam [Fig. 2(a)]. This mode utilizes some pulsed Doppler functions, allowing a Doppler cursor to be used to locate the focus of the therapeutic beam. The focal volume is an ellipsoid, and the half-power beam profile is 1 × 9 × 1.5 mm in lateral, depth, and elevation dimensions, respectively [Fig. 2(b), the elevation direction is not shown]. The beam profile was measured by a hydrophone (Müller-Platte needle probe, Onda Inc., Sunnyvale, CA). The TAP of the single beam mode was measured using a radiation force balance (UPM-DT-1AV, Ohmic Instruments Co., Easton, MD). During therapy, the TAP was maintained at a maximum power of 3.84 W, which corresponds to an acoustic pressure of 2.04 MPa and MI of 1.64.
Fig. 2.
Characteristics of single-beam therapeutic mode. All outer-row transducer elements contribute to a single therapeutic beam (a), and the half-power beam profile is a narrow ellipsoid with dimensions of 1 × 9 × 1.5 mm in the lateral, depth and elevation directions (b). The beam is focused at a depth of 35 mm.
B. Acquisition Frame Rate Determination
This system takes advantage of periodic B-mode image updates interleaved between therapy transmissions. The RF images (backscattered image data) are stored on the Antares scanner for offline temperature estimation. During acquisition, a suitable B-mode frame rate is necessary to prevent aliasing and maintain detectable apparent displacement. To prevent aliasing, if an ROI for the entire target (a phantom or a tumor) is chosen and the temperature distribution in the depth direction is approximately modeled as a Gaussian distribution, the following relationship can be established:
| (4) |
| (5) |
where L denotes the change in sound speed for every degree Celsius increase; D( y) describes the temperature distribution in depth direction within the target ROI, c is the speed of sound (defined to be 1540 m/s in this study) and G( y) is a normalized Gaussian distribution centered at the insonation focus. ΔTincr. is a variable describing a range of temperature increase. The target ROI is divided into infinitesimal segments of length dy (m); t is the period of the carrier frequency (s). Eq. (4) indicates that the difference in the two-way travel time with and without heating must be less than one-half of a period of the carrier frequency to avoid aliasing. The solution is to find ΔTincr. such that equality in (4) is established, and in which D(y) can be defined as:
| (6) |
where ΔTmax is the maximum acceptable temperature increase between two contiguous frames. Therefore, the lower bound of the acquisition frame rate, Frlow, based on a temperature rise of R °C/sec during heating is
| (7) |
On the other hand, to establish the minimum detectable apparent displacement, a relationship similar to (4) is established:
| (8) |
where p is the detection limit and is equivalent to one sample in depth (i.e., one pixel) if interpolation is not applied. Eq. (8) shows that the cumulative apparent displacement in the target ROI cannot be less than the detection limit. Solving the equations (5) and (8), a ΔTmin can be found to establish the equality in (8). ΔTmin is a minimum acceptable temperature increase, and the upper bound of the acquisition frame rate is
| (9) |
The default acquisition frame rate of the system is faster than the upper bound, and frames are sampled such that the effective frame rate is between the two bounds established above. Oversampling of frames may be necessary in in vivo studies with substantial motion of the target.
C. Algorithm for Noninvasive Temperature Estimation
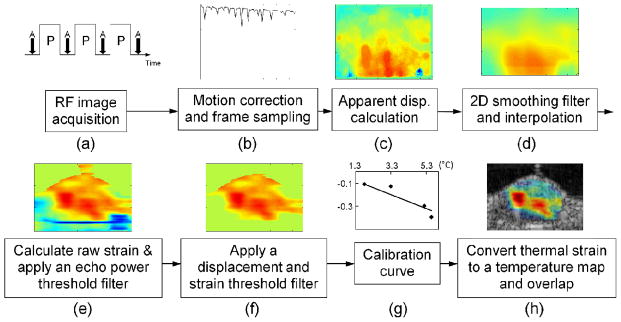
Procedures for achieving temperature estimation included the following steps (Fig. 3). Motion correction was accomplished, speckle displacement was estimated based on the 5.33-MHz image (with ~2.3λ resolution at 5.33 MHz) and the result was filtered. Next, strain was estimated based on the therapeutic transducer wavelength (~ 2.3λ resolution at 1 MHz).
Fig. 3.
Procedures for temperature estimation. A series of RF images were acquired (a), and motion correction was applied for alignment (b). 2-D speckle tracking was used for displacement calculation (c), and a smoothing filter and interpolation were applied (d). A gradient operator was applied, and the resulting strain was processed by power, displacement and strain threshold filters (e and f). The filtered strain was converted to temperature by a calibration function (g) and then overlaid on a B-mode image (h). The peak temperature increase occurred on the left side of the image, where the bright thermocouple can be visualized within the B-mode image.
1) RF Image Frame Acquisition, Motion Correction and Selection of Image Frames
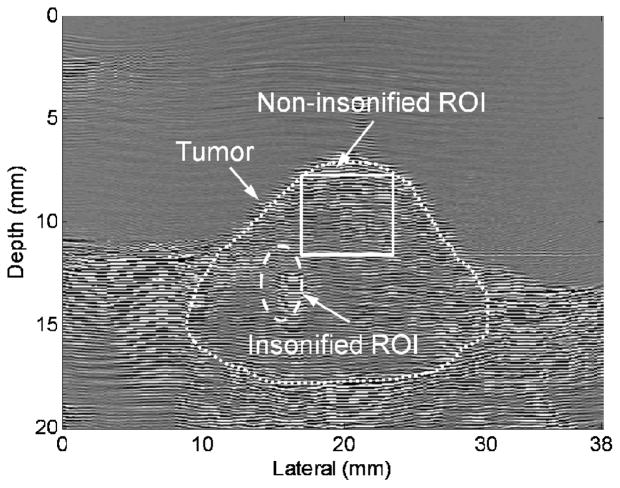
RF frames were acquired by the 5.5-MHz center imaging row (operating at 5.33 MHz frequency) between each two therapeutic pulses [Fig. 3(a)]. In Fig. 3(a), P denotes therapy pulsing, with duration dependent on the PRF, which was variable depending on the feedback controller. A denotes image acquisition, which occurred between therapy pulses. The image frame was 20 mm in height and 38 mm in width. Gross motion correction to compensate for displacement was applied in in vivo studies, with the superficial tumor and skin used as a reference for correction. Square correction ROIs of dimension 4.5 × 4.5 mm (~15λ at 5.33 MHz, λ is the wavelength) were processed to yield a normalized correlation coefficient between successive image frames and the first image frame, the shift was estimated and the frames were aligned. The non-insonified area of the image was then selected to examine the effect of the alignment (Fig. 4) by computation of the autocorrelation, which was defined as
Fig. 4.
Radio-frequency frame acquired before insonation, with approximate tumor region outline. Water bath was present above the skin line. An insonified ROI is circled, with a thermocouple placed within this region. A square non-insonified ROI was selected for autocorrelation to examine motion correction.
| (10) |
where SPr and SPs are kernel regions in the reference image and subsequent images and is the mean over the region, respectively. Assuming the size of the examination ROI is a× a, and the size of SP is b× b, (i, j) is limited to the range of (b/2)≤ i, j≤ (a− b/2). CCA is the autocorrelation map and the mean value of CCA describes the autocorrelation coefficient with respect to the reference frame. By examining the autocorrelation, the coefficient as a function of frame number is plotted to show the improvement resulting from motion correction [Fig. 3(b)]. In our study, each frame was assumed to translate without warping or rotation. The image dimension was cropped to 17.4 mm in depth and 22.7 mm in the lateral direction for in vitro studies, and 15.4 mm in depth and 22.7 mm in the lateral direction for in vivo studies.
2) Apparent Displacement Calculation
In the apparent displacement calculation, a kernel with a dimension of 0.7 × 0.7 mm was defined based on the size of the resolution cell (2.3λ at the imaging frequency of 5.33 MHz), because the sensitivity of speckle tracking is highly dependent on the kernel size. A 2-D speckle tracking algorithm was applied, in which a normalized correlation coefficient was calculated for the apparent displacement in the depth and lateral directions. The normalized 2-D speckle tracking algorithm is typically defined as [24]:
| (11) |
where SPk and SPs are kernel and search regions in the second and first images, respectively. (i, j) describe the pixels in the kernel area, and (m, n) is the searching range. (i, j) is a subset of (m, n), ie., i= 0,1,2,…,m−1; j= 0,1,2,…,n−1. CCS(m, n) is a matrix of the cross-correlation values. Comparing the peak location of CCS(m, n) with the center location of SPk, the shift shows the apparent displacement.
Each pair of two contiguous selected frames was compared to generate an incremental displacement map. A 1.4 × 1.4 mm median filter (4.6λ at 5.33 MHz) was applied to each incremental displacement value, and finally these displacement maps were summed to produce a cumulative displacement map of the image series [Fig. 3(c)]. The change of sound speed dominates lateral speckle shifts during mild hyperthermia, and therefore displacement in the depth direction was used for the thermal strain calculation.
3) 2-D Smoothing Filter, Interpolation, and Thermal Strain Calculation
To smooth the cumulative displacement maps, a 2D mean filter with dimensions of 2.3 × 2.3 mm (2.3λ at 1.54 MHz) was applied (smooth 2a, Greg Reeves, Matlab Central open exchange community, The MathWorks, Inc., Natick, MA). After smoothing the apparent displacement maps, the axial resolution was not interpolated, and lateral interpolation of 11.75 times was applied to improve resolution and to create isotropic pixel dimensions [Fig. 3(d)].
A basic Sobel operator uses two 3 × 3 kernels for horizontal and vertical derivative approximation and the kernels are defined as
| (12) |
where Sx and Sy are the horizontal and vertical derivative component, respectively. By convolving these two kernels with a source image, a derivative approximation can be achieved. In our study, Sobel operators with dimensions from 0.06 × 0.06 to 3.30 × 3.30 mm (corresponding to 3 × 3 to 171 × 171 pixels) were compared, and the effect of operator size was calculated by
| (13) |
where the normalized thermal strain maps were defined by dividing the map by the maximum value on the strain map, and the normalized maps processed by operators with varied dimensions were subtracted from each other, followed by the absolute-value operation and summation of the difference between images at each pixel. N=11,21,31,…,171, is the operator dimension, corresponding to 0.2 to 3.3 mm. In the special case in which N= 11, the comparison was between N= 3 (the smallest operator size) and N= 11. Code to generate operators with a larger order [>(0.06 × 0.06 mm)] was modified based on GSobel by Jeny Rajan from the Matlab Central open exchange community.
4) Filtering and Thresholds
Artifacts and noise were eliminated in further processing. Here, an echo-power threshold of ~33 dB was used to identify the area with sufficient echo-power intensity [Fig. 3(e)] and set strain to zero in regions outside the phantom or subject. A displacement threshold was used to set the strain to zero when the displacement values were below a defined level (on the order of one pixel). Finally, a strain threshold was used to define a minimum strain, assumed to be 0 to 0.2 mm/mm for our imaging conditions [Fig. 3(f)]. Thus, the strain was set to zero when the echo power, displacement or strain was below the relevant threshold.
5) Calibration and Conversion to Temperature Maps
Because thermal strain is approximately linearly proportional to the actual temperature difference in the mild hyperthermia range, a calibration curve was applied to convert the strain map to a temperature difference map. A series of image frames with a known temperature rise was processed to generate in vitro and in vivo [Fig. 3(g)] calibration curves, and temperature difference maps were then generated, the temperature offset added and the result overlaid on B-mode images [Fig. 3(h)].
D. Experimental Setup
1) Phantom Experiments (In Vitro)
An agarose phantom (containing silicon carbide particles) that has properties similar to soft tissue was applied in our in vitro experiments. Three percent agarose powder, 4% silicon carbide, 3% glycerol, and 90% distilled and degassed water were combined followed by heating until boiling and boiling for 1 to 2 more minutes to dissolve components. The solution was then cooled to 50 to 55°C and poured in a cuboid mold with inner dimensions of 25 × 25 × 20 mm. Before insonation, three calibrated thermocouples were inserted into the phantom perpendicular with the lateral-depth plane of the co-linear transducer. The three thermocouples were placed at a single depth, spaced 4 mm and 10 mm lateral to the middle thermocouple; a needle thermocouple was positioned in the center and bare-junction thermocouples were placed on the side. The phantom was placed in the insonation chamber filled with room-temperature water. After the thermal equilibrium was reached, insonation along a single beam was applied in the center of the image, and the insonation focus was centered on the middle thermocouple. RF image frames were acquired during insonation and the acquired RF images were then processed off-line. During insonation, the reading of the middle thermocouple was used for temperature feedback control. Sequences generating four different peak temperature increases (2.5°C, 4.3°C, 5.8°C, and 7.4°C) were executed for the calibration curve. The range of temperature elevation in the in vitro study was 2.5 to 7.4°C.
2 )In vivo studies
All in vivo studies were approved by the UC Davis Institutional Animal Care and Use Committee (IACUC). Five female FVB mice were implanted with Met-1 tumor fragments in the fourth right and left mammary pads, and tumors were grown to a 10-mm diameter size for treatment. Before insonation, each mouse was anesthetized using 2% isofluorane-inhaled anesthesia and then shaved to remove all hair surrounding the tumor. Each mouse was placed on the insonation holder with the tumor facing down and submerged in a 37°C warm water bath. A needle-type thermocouple was inserted near the center of the tumor, and a Doppler cursor was used to locate the insonation focus on the thermocouple tip. The development of temperature distribution maps was done with the Doppler cursor in a fixed position. After the tumor reached the 37°C equilibrium state, insonation began and RF images were acquired. Five RF image series were acquired (as in Fig. 4), which corresponded to a peak temperature increase of 1.8, 2.4, 3.3, 5.2, and 5.6°C. The range of temperature elevation in the in vivo study was 1.8 to 5.6°C.
III. RESULTS
With a transmitted center frequency of 5.33 MHz, the corresponding period of one cycle is ~0.19 μs and half of a period was used for the determination of the lower bound of the frame rate. The digitization precision of the ultrasound image in the axial direction was 0.0193 mm. When computing the apparent displacement, 10× interpolation was applied to the in vivo data to handle the small phase shifts resulting from motion. Therefore, the axial resolution (digitization precision) of the apparent displacement maps was 0.0193 mm in vitro and 0.00193 mm in vivo. The rate of temperature increase was measured as ~0.1°C/sec both in vitro and in vivo. Based on (4)–(9), the range of frame rate satisfying aliasing and detection limits was 0.05 to 0.2 Hz in vitro and 0.02 to 0.6 Hz in vivo. After downsampling of the frames, the applied frame rates were ~0.15 Hz and ~0.3 Hz for in vitro and in vivo studies, respectively.
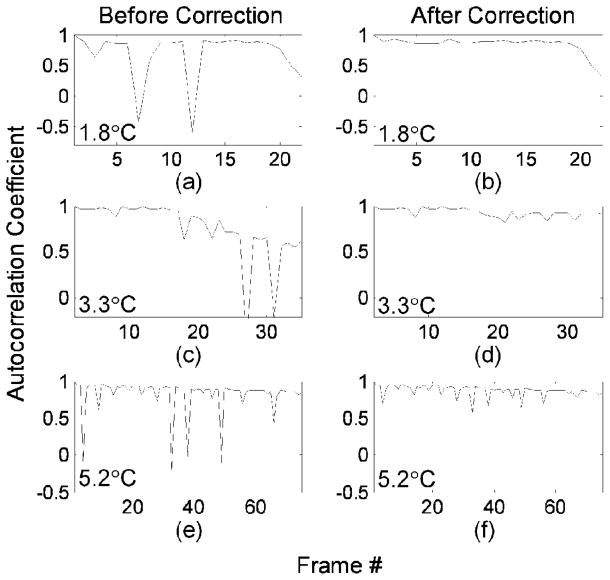
After motion correction, the autocorrelation of each frame with the first frame was evaluated to assess the accuracy of motion correction (Fig. 5). The range of the autocorrelation coefficient is between 1 and −1, corresponding to a perfect match of two ROIs (zero-wavelength shift) or a half-wavelength displacement, respectively. In Fig. 5, in vivo frame series with peak temperature increases of 1.8, 3.3, and 5.2°C were compared. After the correction algorithm, the maximum differences in autocorrelation coefficients between two consecutive frames decreased from 170% to 1%, 160% to 10%, and 120% to 40% for 1.8, 3.3, and 5.2°C series, respectively. In Figs. 5(a), 5(c), and 5(e), the discontinuities in the curves were produced by tissue motion, and were reduced after alignment of the frames [Figs. 5(b), 5(d), and 5(f)]. In some cases, the simple linear displacement algorithm applied here was insufficient to restore the frame-to-frame correlation and such frames were not used in apparent displacement calculation.
Fig. 5.
Autocorrelation of the first frame within the data set with subsequent image frames [based on (10)] demonstrates the effect of motion correction on the in vivo data sets acquired over insonation which increased the temperature in the region of interest by 1.8°C (a and b), 3.3°C (c and d) and 5.2°C (e and f). Discontinuities corresponding to motion were apparent before motion correction (a, c, e) and reduced after motion correction was applied (b, d, f).
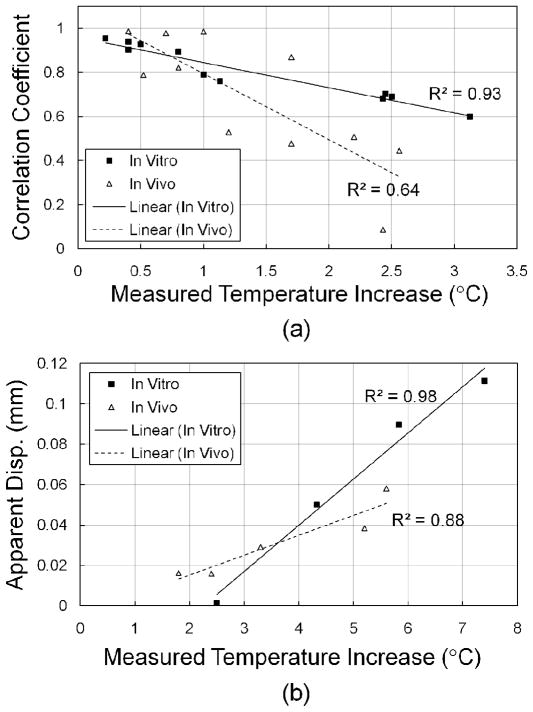
The correlation coefficient at the insonation focus was also examined as a function of the temperature increase [Fig. 6(a)]. In vitro and in vivo studies showed that the correlation coefficient decreased as the temperature increased, indicating that a higher temperature increase resulted in a greater apparent displacement. With a temperature increase up to 2.5°C, the correlation coefficient decreases from 1 to 0.67 and 0.35 for in vitro and in vivo studies, respectively. R2 values of 0.93 and 0.64 for in vitro and in vivo studies, respectively, also showed that both in vitro and in vivo tests had a linear relationship between correlation coefficients and temperature increase.
Fig. 6.
Correlation coefficient (a) and apparent displacement (b) as a function of the temperature increase within various in vitro and in vivo studies. The ROI was selected at the insonation focus. R2 values demonstrate the linear relationship between the correlation coefficient and measured temperature increase, and between apparent displacement and measured temperature increase.
In the far field, assuming the temperature distribution profile along the depth direction is a Gaussian function, the predicted cumulative apparent displacement at the insonation focus will increase exponentially as a function of temperature. When the temperature increase is limited to several degrees Celsius, this relationship can be approximated as a linear function. Both in vitro and in vivo data were examined in Fig. 6(b), showing that at the insonation focus the cumulative apparent displacement is approximately proportional to the temperature increase.
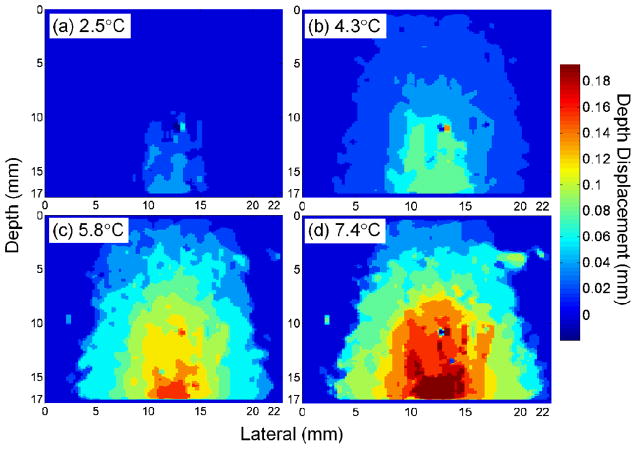
As the temperature increased, the region within which a displacement was detected broadens (Fig. 7). Maps of in vitro displacement before filtering and interpolation demonstrated the increasing amplitude and spatial extent of displacement as the temperature increased from 2.5 to 4.3, 5.8, and 7.4°C, respectively [Figs. 7(a)–7(d)]. Larger values denote greater displacement toward the transducer surface. The largest cumulative displacement was 0.039, 0.077, 0.154, and 0.193 mm for peak temperature increases of 2.5, 4.3, 5.8, and 7.4°C, respectively. As a result of heat diffusion, the −6dB width of the displacement was 4.93, 8.50, 11.93, and 13.33 mm in Figs. 7(a)–7(d).
Fig. 7.
Displacement maps for in vitro phantom data as a function of the temperature increase produced at the focus, following a peak increase of 2.5°C (a), 4.3°C (b), 5.8°C (c) and 7.4°C (d). Larger values denote greater displacement toward the transducer surface. The peak and breadth of the displacement increased as the temperature increased.
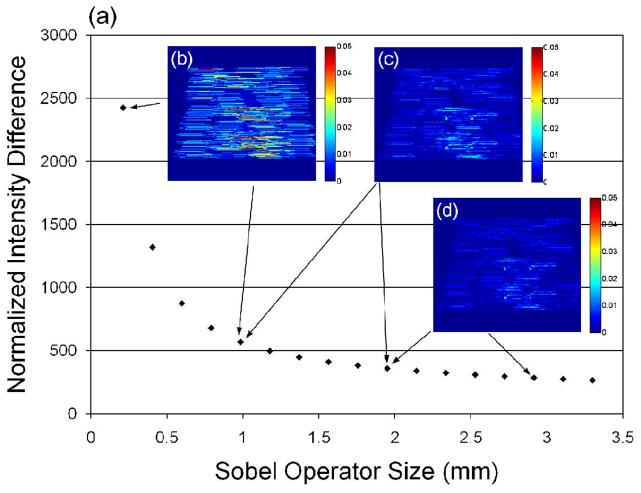
Sobel operators with a range of different sizes were examined on the in vitro 4.3°C sample (Fig. 8). Pairs of successive points show a normalized intensity difference resulting from a 0.19-mm difference (10 pixels) in the size of the operator. The normalized intensity difference decreased as the Sobel operator size increased [Fig. 8(a)]. Three pairs of subtracted images are shown, including subtractions between 0.06 and 0.98 mm [Fig. 8(b)], between 0.98 and 1.95 mm [Fig. 8(c)], and between 1.95 and 2.91 mm [Fig. 8(d)], corresponding to a cumulative intensity difference of 5.9 × 10³, 2.1 × 10³ and 1.6 × 10³, respectively. In Fig. 8(a), when the operator dimension was greater than ~2.3 mm, the normalized intensity difference stabilized. Therefore, an operator dimension of 2.3 × 2.3 mm (and smoothing filter with the same dimension) was applied for thermal strain calculation in this study.
Fig. 8.
Change in normalized thermal strain maps produced by different-sized Sobel operators in an in vitro study with a peak temperature increase of 4.3°C. Operator dimensions from 0.06 × 0.06 mm to 3.30 × 3.30 mm were evaluated. The effect of increasing dimension was small for operators larger than 2.3 mm (a). Examples of subtracted images are shown, between 0.06 and 0.98 mm (b), between 0.98 and 1.95 mm (c), and between 1.95 and 2.91 mm (d).
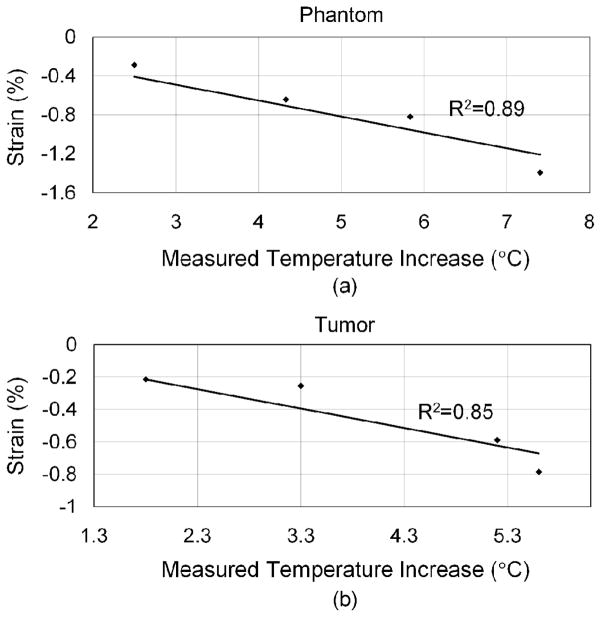
From (3), we assume the tissue parameters α and β are constant in the experiments, and the thermal strain is approximately proportional to the temperature difference. The in vitro and in vivo calibration curves show this relationship (Fig. 9). In each case, four data sets were applied for linear regression, and the R2 values were 0.89 and 0.85 for in vitro and in vivo data, respectively. The slope in Fig. 9 denotes the values of (α − β), which are −0.16% and −0.12% in vitro and in vivo, respectively. Assuming α is on the order of one tenth of β and can be ignored, the linear coefficient of sound speed change, β, is ~0.16%°C−1 and ~0.12%°C−1 for the phantom and Met-1 tumors, respectively. To match the zero thermal strain with a zero temperature increase, the intercept of the regression lines was set to zero at both axes.
Fig. 9.
Calibration curves for in vitro (a) and in vivo data (b) as a function of the temperature increase.
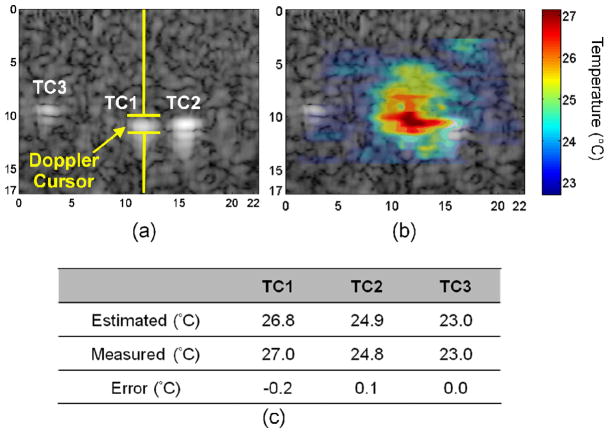
The accuracy of temperature mapping was demonstrated in in vitro experiments in which three thermocouples, TC1, TC2, and TC3 were implanted as shown on the B-mode image (Fig. 10), and the Doppler cursor was placed on the middle thermocouple (TC1) [Fig. 10(a)]. The estimated temperature map was overlaid on the B-mode image, and the highest temperature appeared at the insonation focus with a temperature gradient measured [Fig. 10(b)] ranging from 22.7°C to 27.1°C. Regions with dimensions of 0.97 mm (depth) by 2.31 mm (lateral) were selected on the temperature maps, corresponding to the TC locations. For the TC1 location, the estimated temperature by the thermal strain algorithm was 26.8 °C, and the measured temperature by the thermocouple was 27.0°C. For TC2 and TC3 locations, the estimated temperatures were 24.9°C and 23.0°C, and the measured temperatures were 24.8°C and 23.0°C, respectively. Temperature errors for the three TCs were −0.2°C, 0.1°C, and 0.0°C, respectively (Fig. 10(c)). Comparing the estimated with measured results in all in vitro groups, the temperature error had a standard deviation of 0.7°C.
Fig. 10.
In vitro phantom data from a multi-thermocouple study in which the peak temperature within the phantom was increased by 4.3°C. Three thermocouples were placed in the phantom in the positions marked as TC1, TC2 and TC3 (a), and the overlaid map shows the temperature distribution (b). Estimated temperatures closely agreed with the measured temperatures (c).
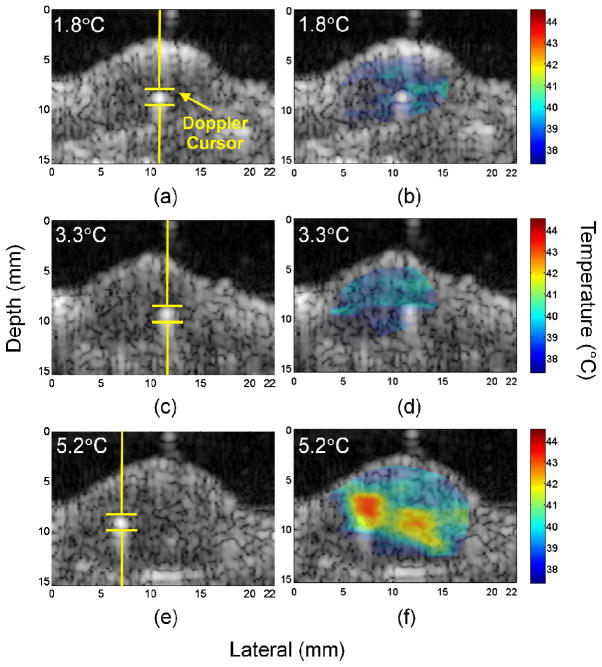
With identical settings to the in vitro studies, close agreement between thermocouple and thermal strain temperature estimates was also observed for in vivo studies (Fig. 11 and Table I). An area of dimensions of 0.97 mm (depth) by 2.31 mm (lateral) was selected and the mean value was calculated as the estimated temperature. Temperature estimation algorithms with and without motion correction were executed and compared (Table I). With settings predicted to produce 1.8, 2.4, 3.3, 5.2, and 5.6°C increases, the strain-estimated temperatures were 39.4, 44.3, 38.9, 43.2, and 43.5°C without motion correction, and 39.3, 40.4, 39.7, 42.2, and 44.0°C with motion correction, respectively. The temperature measured by the thermocouple was 39.3, 39.8, 40.8, 42.7, and 43.0°C, respectively. The error range for studies without and with motion correction were −1.9 to 4.5°C and −1.1 to 1.0°C, resulting in a standard deviation of 2.3°C and 0.8°C, respectively.
Fig. 11.
Images acquired from insonation of Met-1 tumors containing a thermocouple. Insonation was directed along a single line-of-sight as indicated by the Doppler cursor with a peak temperature increase of 1.8 °C (a and b), 3.3°C (c and d) and 5.2°C (e and f). The B-mode images (a, c, e) show the insonation focus, and windowed temperature maps (b, d, f) were overlaid on the B-mode images.
Table I.
Summary of estimated temperatures from an in vivo study of the Met-1 tumor model with and without motion correction (MC).
| Estimated/Measured (Error) (°C) | ||
|---|---|---|
| Temperature Increase | Without MC | With MC |
| 1.8°C | 39.4/39.3 (0.1) | 39.3/39.3 (0.0) |
| 2.4°C | 44.3/39.8 (4.5) | 40.4/39.8 (0.6) |
| 3.3°C | 38.9/40.8 (−1.9) | 39.7/40.8 (−1.1) |
| 5.2°C | 43.2/42.7 (0.5) | 42.2/42.7 (−0.5) |
| 5.6°C | 43.5/43.0 (0.5) | 44.0/43.0 (1.0) |
| Std of Error | 2.3°C | 0.8°C |
The B-mode image shows the thermocouple location and the insonation focus [Figs. 11(a), 11(c), and 11(e)], with the overlay providing the temperature distribution in the tumor [Figs. 11(b), 11(d), and 11(f)]. The temperature distribution maps were windowed based on tumor boundaries before overlaying. Wider temperature distribution was observed to correspond to a higher temperature increase at the insonation focus. For in vivo studies in which the ambient tissue temperature was 37°C, when 1.8, 3.3, and 5.2°C increases were predicted, temperatures spanning 37.5 to 40.5°C, 37.6 to 40.6°C, and 37.3 to 43.2°C were measured, respectively.
IV. DISCUSSION AND CONCLUSION
In this study, a speckle tracking-based temperature estimation algorithm was shown to be useful for temperature monitoring during hyperthermia. A dual frequency transducer was used to generate high resolution maps of thermal strain resulting from mild hyperthermia. This transducer is capable of interleaved therapy and imaging and enables the use of a lower frequency for therapy compared with the higher resolution and higher frequency used during imaging. The array that was employed here was designed for application in breast and head and neck tumors, where tumor depths on the order of centimeters are anticipated; lowering the imaging center frequency would enable additional applications in liver and kidney lesions. The maximum output power, ~4 W, was sufficient to elevate 5 × 5 × 5 mm tissue volume by 5°C or more for mild hyperthermia. The MI was below 1.9 and therefore cavitation was not anticipated. Cavitation was not detected in this study or similar studies with these parameters. Such dual frequency transducers are not widely available; further development could facilitate image-guided therapy. In addition, the operating mode of the ultrasound system was modified to integrate imaging and therapy insonation by interleaving pulses. Here again, typical ultrasound-guided therapy is accomplished by combining an imaging system with a therapeutic transducer and pulser, complicating the development of integrated image and therapy modes. The development of combined systems and dissemination of software and systems would facilitate development.
Our study showed that combining a 2-D speckle tracking algorithm, a motion correction function, and customized filters facilitates precise temperature estimation. The standard deviation of the error in temperature estimation in the in vitro and in vivo studies was 0.7°C and 0.8°C, respectively. A multi-step process was required and thresholds were evaluated for the echo power, displacement and thermal strain. The motion correction algorithm improved the accuracy of estimation, and thus is a crucial component of the technique.
In this study, image processing operators were applied with dimensions typically on the order of the resolution cell. Motion correction requires a relatively large region of interest; here, severe physiologic motion was minimized by the 4.5 × 4.5 mm ROI. The size of the Sobel operator (2.3λ) and low pass imaging filter were next selected as slightly larger than the effective therapeutic beam width; larger operators did not significantly alter the resulting map and smaller operators increased the variance. The apparent displacement calculation was similarly chosen to be slightly greater than the speckle dimensions at the imaging frequency (2.3λ). Finally, we found that processing the apparent displacement map with a median filter before the Sobel operation further reduced the variance, where the median filter (4.6λ) was effective when the dimension was greater than that of the displacement operator.
The original acquisition frame rate of RF data at ~1.5 Hz was faster than required, where frame rates of 0.05 to 0.2 and 0.02 to 0.6 Hz were required in vitro and in vivo, respectively. After 10× and 5× downsampling of the frames, the equivalent frame rates were ~0.15 Hz and ~0.3 Hz for in vitro and in vivo, respectively. Oversampling was useful for in vivo studies in that frames with significant motion artifact could be eliminated from the data set without penalty if motion correction was unsuccessful.
When mapping ultrasound-induced hyperthermia with thermocouples, artifacts have been reported [36] in which the measured temperature is typically higher than the true temperature. Thermocouples encased in steel needles have minimal or negligible temperature artifacts in ultrasound thermometry. Waterman et al. used a 23-gauge needle microprobe, a beef phantom, and 1 and 3 MHz, 10 to 50 W continuous wave (CW) ultrasound for temperature measurement, and an artifact of 0.7±0.1°C was reported [36]. Here, we used 30-gauge stainless-steel encasing needle-type thermocouples (HYP-1) for the temperature feedback control, and the heat capacity was one fourth to one fifth of the 23-gauge probe. Because our study combined periodic imaging during hyperthermia, the thermocouple artifact can be estimated from the temperature curve. During hyperthermia, therapeutic pulsing was generated at a desired PRF, and the detected temperature was a combination of the actual temperature rise and artifact. The artifact was quantified by interrupting the beam and measuring the temperature change. The measured artifact for the HYP-1 thermocouple was 0.08±0.02°C in vitro and 0.04±0.02°C in vivo.
Real time computing is the eventual goal for this study. Based on our system structure, RF image frames can be exported to the PC in real-time. A PC equipped with acceleration hardware is capable of calculating temperature maps off-line and generating real-time temperature information in a selected ROI. The temperature can then be fed into the PID system and the resulting control parameters delivered to the Antares system through a DUI interface. Thus, real-time operation in future studies is feasible.
Acknowledgments
We would like to thank the NIH for their generous support for this project under NIH CA103828 and EB009434 and the Focused Ultrasound Surgery Foundation.
References
- 1.Moroz P, et al. Status of hyperthermia in the treatment of advanced liver cancer. J Surg Oncol. 2001;77:259–269. doi: 10.1002/jso.1106. [DOI] [PubMed] [Google Scholar]
- 2.Khaibullina A, et al. Pulsed high-intensity focused ultrasound enhances uptake of radiolabeled monoclonal antibody to human epidermoid tumor in nude mice. J Nucl Med. 2008 February 1;49:295–302. doi: 10.2967/jnumed.107.046888. [DOI] [PubMed] [Google Scholar]
- 3.Paek BW, et al. Tissue ablation using high-intensity focused ultrasound in the fetal sheep model: Potential for fetal treatment. American Journal of Obstetrics and Gynecology. 2003;189:702–705. doi: 10.1067/s0002-9378(03)00664-1. [DOI] [PubMed] [Google Scholar]
- 4.Wu F, et al. Pathological changes in human malignant carcinoma treated with high-intensity focused ultrasound. Ultrasound Med Biol. 2001;27:1099–1106. doi: 10.1016/s0301-5629(01)00389-1. [DOI] [PubMed] [Google Scholar]
- 5.Kennedy JE, et al. High intensity focused ultrasound: surgery of the future? British Journal of Radiology. 2003;76:590–599. doi: 10.1259/bjr/17150274. [DOI] [PubMed] [Google Scholar]
- 6.Kong G, et al. Characterization of the effect of hyperthermia on nanoparticle extravasation from tumor vasculature. Cancer Res. 2001 April 1;61:3027–3032. [PubMed] [Google Scholar]
- 7.Song CW, et al. Implications of increased tumor blood flow and oxygenation caused by mild temperature hyperthermia in tumor treatment. Int J Hyperthermia. 2005 Dec;21:761–767. doi: 10.1080/02656730500204487. [DOI] [PubMed] [Google Scholar]
- 8.Jones EL, et al. Thermochemoradiotherapy improves oxygenation in locally advanced breast cancer. Clin Cancer Res. 2004 July 1;10:4287–4293. doi: 10.1158/1078-0432.CCR-04-0133. [DOI] [PubMed] [Google Scholar]
- 9.Ferrara KW. Driving delivery vehicles with ultrasound. Adv Drug Deliv Rev. 2008 Jun;60:1097–1102. doi: 10.1016/j.addr.2008.03.002. [DOI] [PMC free article] [PubMed] [Google Scholar]
- 10.Sun Y, et al. Simultaneous measurements of temperature and pH in vivo using NMR in conjunction with TmDOTP5- NMR Biomed. 2000;13:460–466. doi: 10.1002/nbm.676. [DOI] [PubMed] [Google Scholar]
- 11.Kheirolomoom A, et al. Enhanced in vivo bioluminescence imaging using liposomal luciferin delivery system. J Control Release. 2010;141:128–136. doi: 10.1016/j.jconrel.2009.08.029. [DOI] [PMC free article] [PubMed] [Google Scholar]
- 12.Ponce AM, et al. Targeted bioavailability of drugs by triggered release from liposomes. Future Lipidol. 2006;1:25–34. [Google Scholar]
- 13.Needham D, et al. A new temperature-sensitive liposome for use with mild hyperthermia: Characterization and testing in a human tumor xenograft model. Cancer Res. 2000;60:1197–1201. [PubMed] [Google Scholar]
- 14.Hauck ML, et al. Phase I trial of doxorubicin-containing low temperature sensitive liposomes in spontaneous canine tumors. Clin Cancer Res. 2006;12:4004–4010. doi: 10.1158/1078-0432.CCR-06-0226. [DOI] [PubMed] [Google Scholar]
- 15.Jones EL, et al. Randomized trial of hyperthermia and radiation for superficial tumors. J Clin Oncol. 2005 May 1;23:3079–3085. doi: 10.1200/JCO.2005.05.520. [DOI] [PubMed] [Google Scholar]
- 16.Kruse DE, et al. Spatial and temporal controlled tissue heating on a modified clinical ultrasound scanner for generating mild hyperthermia in tumors. 2007 IEEE Ultrason Symp. 2007:313–318. doi: 10.1109/TBME.2009.2029703. [DOI] [PMC free article] [PubMed] [Google Scholar]
- 17.Quesson B, et al. Magnetic resonance temperature imaging for guidance of thermotherapy. J Magn Reson Imaging. 2000;12:525–533. doi: 10.1002/1522-2586(200010)12:4<525::aid-jmri3>3.0.co;2-v. [DOI] [PubMed] [Google Scholar]
- 18.Paulsen KD, et al. Initial in vivo experience with EIT as a thermal estimator during hyperthermia. Int J Hyperthermia. 1996;12:573–591. doi: 10.3109/02656739609027666. [DOI] [PubMed] [Google Scholar]
- 19.Meaney PM, et al. Microwave imaging for tissue assessment: Initial evaluation in multitarget tissue-equivalent phantoms. IEEE Trans Biomed Eng. 1996;43:878–890. doi: 10.1109/10.532122. [DOI] [PubMed] [Google Scholar]
- 20.Leroy Y, et al. Non-invasive microwave radiometry thermometry. Physiological Measurement. 1998;19:127–148. doi: 10.1088/0967-3334/19/2/001. [DOI] [PubMed] [Google Scholar]
- 21.Bowen T. Acoustic radiation temperature for noninvasive thermometry. Automedica|Automedica. 1987;8:247–67. [Google Scholar]
- 22.Arthur RM, et al. Non-invasive estimation of hyperthermia temperatures with ultrasound. Int J Hyperthermia. 2005;21:589–600. doi: 10.1080/02656730500159103. [DOI] [PubMed] [Google Scholar]
- 23.Seip R, Ebbini ES. Noninvasive estimation of tissue temperature response to heating fields using diagnostic ultrasound. IEEE Trans Biomed Eng. 1995;42:828–839. doi: 10.1109/10.398644. [DOI] [PubMed] [Google Scholar]
- 24.Abolhassani MD, et al. Noninvasive temperature estimation using sonographic digital images. J Ultrasound Med. 2007 February 1;26:215–222. doi: 10.7863/jum.2007.26.2.215. [DOI] [PubMed] [Google Scholar]
- 25.Maass-Moreno R, Damianou CA. Noninvasive temperature estimation in tissue via ultrasound echo-shifts.1. Analytical model. J Acoust Soc Am. 1996;100:2514–2521. doi: 10.1121/1.417359. [DOI] [PubMed] [Google Scholar]
- 26.Varghese T, et al. Ultrasound monitoring of temperature change during radiofrequency ablation: Preliminary in-vivo results. Ultrasound Med Biol. 2002;28:321–329. doi: 10.1016/s0301-5629(01)00519-1. [DOI] [PubMed] [Google Scholar]
- 27.Miller NR, et al. Fundamental limitations of noninvasive temperature imaging by means of ultrasound echo strain estimation. Ultrasound Med Biol. 2002;28:1319–1333. doi: 10.1016/s0301-5629(02)00608-7. [DOI] [PubMed] [Google Scholar]
- 28.Stephens DN, et al. 5A-1 Multi-frequency array development for drug delivery therapies: Characterization and first use of a triple row ultrasound probe. presented at the Oct. 2nd, 2006 IEEE Ultrason. Symp.; 2006. [Google Scholar]
- 29.Stephens DN, et al. Efficient array design for sonotherapy. Phys Med Biol. 2008 Jul;53:3943–3969. doi: 10.1088/0031-9155/53/14/014. [DOI] [PMC free article] [PubMed] [Google Scholar]
- 30.Huang SW, et al. Inducing and Imaging thermal strain using a single ultrasound linear array. IEEE Trans Ultrason Ferroelectr Freq Control. 2007;54:1718–1720. doi: 10.1109/tuffc.2007.454. [DOI] [PubMed] [Google Scholar]
- 31.Simon C, et al. Two-dimensional temperature estimation using diagnostic ultrasound. IEEE Trans Ultrason Ferroelectr Freq Control. 1998 Jul;45:1088–1099. doi: 10.1109/58.710592. [DOI] [PubMed] [Google Scholar]
- 32.Duck FA. Physical Properties of Tissue. London: Academic Press; 1990. [Google Scholar]
- 33.Maass-Moreno R, et al. Noninvasive temperature estimation in tissue via ultrasound echo-shifts.2. In vitro study. J Acoust Soc Am. 1996;100:2522–2530. doi: 10.1121/1.417360. [DOI] [PubMed] [Google Scholar]
- 34.Gonzalez RC, Woods RE. Digital Image Processing. Addison Wisley; 1992. [Google Scholar]
- 35.Bohn C, Atherton DP. An analysis package comparing PID anti-windup strategies. IEEE Contr Syst Mag. 1995;15:34–40. [Google Scholar]
- 36.Waterman FM, Leeper JB. Temperature artifacts produced by thermocouples used in conjunction with 1 and 3 MHz ultrasound. Int J Hyperthermia. 1990 Mar–Apr;6:383–399. doi: 10.3109/02656739009141146. [DOI] [PubMed] [Google Scholar]


