

Abstract
Cones release glutamate-filled vesicles continuously in darkness, and changing illumination modulates this release. Because sustained release in darkness is governed by vesicle replenishment rates, we analyzed how cone membrane potential regulates replenishment. Synaptic release from cones was measured by recording postsynaptic currents in Ambystoma tigrinum horizontal or OFF bipolar cells evoked by depolarization of simultaneously voltage-clamped cones. We measured replenishment after attaining a steady state between vesicle release and replenishment using trains of test pulses. Increasing Ca2+ currents (ICa) by changing the test step from −30 to −10 mV increased replenishment. Lengthening −30 mV test pulses to match the Ca2+ influx during 25 ms test pulses to −10 mV produced similar replenishment rates. Reducing Ca2+ driving force by using test steps to +30 mV slowed replenishment. Using UV flashes to reverse inhibition of ICa by nifedipine accelerated replenishment. Increasing [Ca2+]i by flash photolysis of caged Ca2+ also accelerated replenishment. Replenishment, but not the initial burst of release, was enhanced by using an intracellular Ca2+ buffer of 0.5 mm EGTA rather than 5 mm EGTA, and diminished by 1 mm BAPTA. This suggests that although release and replenishment exhibited similar Ca2+ dependencies, release sites are <200 nm from Ca2+ channels but replenishment sites are >200 nm away. Membrane potential thus regulates replenishment by controlling Ca2+ influx, principally by effects on replenishment mechanisms but also by altering releasable pool size. This in turn provides a mechanism for converting changes in light intensity into changes in sustained release at the cone ribbon synapse.
Introduction
Vertebrate cone photoreceptors are responsible for phototransduction and transmitting the resulting light responses to second-order neurons. The relatively depolarized resting membrane potential of cones in darkness (approximately −40 mV) promotes the opening of L-type Ca2+ channels. This elevates [Ca2+] at the cone ribbon synapse to micromolar levels (Steele et al., 2005; Szikra and Krizaj, 2006; Choi et al., 2008; Jackman et al., 2009), sustaining the tonic release of glutamate. Synaptic vesicles must be continually replenished to maintain this tonic release for long periods in darkness. However, replenishment does not simply ensure the continued release of vesicles, but directly controls the rate of sustained release in darkness (Jackman et al., 2009). This results from the fact that synaptic release from photoreceptors is extremely sensitive to Ca2+ (Rieke and Schwartz, 1996; Thoreson et al., 2004) and thus intraterminal Ca2+ levels in darkness are sufficient to deplete the releasable pool of vesicles from the base of the synaptic ribbon (Jackman et al., 2009). The rate-limiting step in sustained release from cones in darkness is therefore not the rate at which vesicles can fuse, but the rate at which vesicles replenish the releasable pool (Jackman et al., 2009). Because replenishment governs the rate of sustained release and sustained release is diminished by light-evoked hyperpolarization, replenishment rates in cones should be voltage dependent.
Voltage-dependent regulation of replenishment could result from at least three possible mechanisms: (1) voltage: similar to intrinsically voltage-dependent phosphatases (Murata et al., 2005), membrane potential changes might directly influence proteins involved in replenishment; (2) pool size: if each release site is replenished at a constant rate, then increasing the number of release sites can increase the rate of replenishment; and (3) calcium: the rate at which release-ready vesicles are replenished may be directly regulated by intracellular [Ca2+]. Using Ca2+ to regulate replenishment provides a mechanism for coupling replenishment rates to the activity of voltage-dependent Ca2+ channels. Furthermore, replenishment is known to be modulated by Ca2+ at other synapses, including Drosophila neuromuscular junction (Kuromi and Kidokoro, 2002, 2005), cerebellar basket cells (Sakaba, 2008), calyx of Held (Wang and Kaczmarek, 1998; Sakaba and Neher, 2001; Hosoi et al., 2007), Purkinje cells (Dittman and Regehr, 1998), hippocampal neurons (Stevens and Wesseling, 1998), inner hair cells (Johnson et al., 2008), and retinal bipolar cells (Mennerick and Matthews, 1996; Gomis et al., 1999; Singer and Diamond, 2006).
In this study, we recorded simultaneously from cones and postsynaptic neurons to determine factors regulating vesicle replenishment and sustained release at the cone ribbon synapse. We found that replenishment matched sustained release over a range of membrane potentials, supporting other evidence that replenishment is rate limiting for sustained release (Jackman et al., 2009). In addition, we found that replenishment exhibited a voltage dependence arising principally from direct regulation by [Ca2+]i, although it also involves changes in releasable pool size. Ca2+-dependent regulation of replenishment provides a mechanism for cones to convert changes in membrane potential into changes in sustained release and thereby encode changes in illumination at the cone ribbon synapse.
Materials and Methods
Retinal slice preparation.
Aquatic tiger salamanders (Ambystoma tigrinum, Kons Scientific or Charles Sullivan) of both sexes (18–25 cm in length) were handled according to protocols approved by the Institutional Animal Care and Use Committee at the University of Nebraska Medical Center. The salamander was decapitated with heavy shears, the cranium hemisected, and the spinal cord rapidly pithed. Animals were kept on a 12 h light/dark cycle and killed 1–2 h after the beginning of subjective night. After enucleation, the anterior segment of the eye, including the lens, was removed. The resulting eyecup was cut into thirds, and a section was placed vitreal side down on a piece of filter paper (2 × 5 mm, type AAWP, 0.8 μm pores, Millipore). After the retina adhered to the filter paper, the retina was isolated under chilled amphibian superfusate. The retina and filter paper were cut into 125 μm slices using a razor blade (121-6, Ted Pella) tissue chopper (Stoelting). Retinal slices were rotated 90° to view the retinal layers when placed under a water-immersion objective (60×, 1.0 NA) on an upright fixed stage microscope (Nikon E600FN).
Electrophysiology.
Cones were voltage clamped simultaneously with adjacent postsynaptic horizontal or OFF bipolar cells using a Multiclamp patch-clamp amplifier (Molecular Devices). Cones, horizontal cells, and OFF bipolar cells were identified by their morphology and response characteristics (Thoreson et al., 1997). Recording pipettes were positioned with Huxley-Wall micromanipulators (Sutter Instruments) and visualized through the eyepieces or using a video camera (Watec 502H) mounted on the microscope. Currents were low-pass filtered at 2 kHz and acquired using a Digidata 1322 interface with pClamp 9.2 software (Molecular Devices). Photoreceptors were voltage clamped at −70 mV, and horizontal and OFF bipolar cells were clamped at −50 and −60 mV, respectively. Cells were identified by their morphology, light responses, and voltage-dependent currents (Cadetti et al., 2008). Acceptable access resistance was <60 MΩ. In the salamander retina slice preparation, OFF bipolar cells, cones, and many horizontal cells exhibit single-exponential charging curves, indicating compact electrotonic structures (Cadetti et al., 2005).
Patch pipettes were pulled on a PP-830 vertical puller (Narishige USA) from borosilicate glass pipettes (1.2 mm OD, 0.9 mm ID, with internal filament, World Precision Instruments) and had tips of ∼1–2 μm OD with resistance values of 10–15 MΩ. The presynaptic recording pipette was filled with a solution containing (in mm) 40 Cs-glutamate, 50 Cs-gluconate, 9.4 tetraethylammonium chloride (TEACl), 3.5 NaCl, 1 CaCl2, 1 MgCl2, 9.4 MgATP, 0.5 GTP, 5 EGTA, and 10 HEPES, pH 7.2. In some experiments, we replaced 5 mm EGTA with 0.5 mm EGTA or 1 mm 1,2-bis(o-aminophenoxy)ethane-N,N,N′,N′-tetraacetic acid (BAPTA). Postsynaptic pipettes were filled with a solution containing (in mm) 94 Cs-gluconate, 9.4 TEACl, 1.9 MgCl2, 9.4 MgATP, 0.5 GTP, 5 EGTA, and 32.9 HEPES, pH 7.2. The osmolarity of pipette solutions was adjusted, if necessary, to ∼240 mOsm.
Extracellular solutions were applied by a single-pass, gravity-feed perfusion system, which delivered superfusate to the slice chamber at a rate of ∼1 ml/min. The normal amphibian superfusate contained the following (in mm): 111 NaCl, 2.5 KCl, 1.8 CaCl2, 0.5 MgCl2, 10 HEPES, and 5 glucose, pH 7.8. Use of HEPES as a pH buffer limited effects of proton feedback (DeVries, 2001; Hirasawa and Kaneko, 2003; Hosoi et al., 2005). The osmolarity was measured with a vapor pressure osmometer (Wescor) and adjusted, if necessary, to ∼245 mOsm. Solutions were bubbled continuously with 100% O2.
To measure replenishment rates, we attained a steady state where the rate of replenishment balances the rate of release by applying a 7 s train of depolarizing pulses to the cone (Schneggenburger et al., 1999, 2002). We used test pulses of ≥25 ms, which are sufficient to deplete the entire readily releasable pool (Rabl et al., 2005; Bartoletti et al., 2010). The interpulse intervals of 75 or 150 ms are shorter than the time constant for recovery from paired-pulse depression at cone synapses (≥250 ms) (Rabl et al., 2006). To assess the amount of glutamate release, we measured the cumulative charge transfer by integrating EPSCs evoked during the pulse train. Baseline currents were subtracted before integration to remove leak currents and synaptic currents arising from neighboring photoreceptor cells. The rate of replenishment was calculated from the slope of a straight line fit to the cumulative charge transfer during the final 1–2 s of the train.
Fluorescence measurements and flash photolysis of caged Ca 2+.
Fluorescence measurements of [Ca2+]i were obtained from cones in retinal slices using a laser confocal scan head (PerkinElmer UltraView LCI) equipped with a cooled CCD camera (Orca ER) and mounted to a fixed stage upright microscope (Nikon E600 FN). The single frame duration was 57 ms and pixel values were binned 2 × 2. Excitation and emission were controlled by a Sutter Lambda 10–2 filter wheel and controller. Images were acquired and analyzed using UltraView Imaging Suite software.
DM-nitrophen (Kaplan and Ellis-Davies, 1988) was photolyzed by flashes of UV light derived from a Xenon arc flash lamp (JML-C2 Flash Lamp System, Rapp OptoElectronic) centered on the cone terminal and coupled through the epifluorescence port of the microscope. This flash lamp was also used for photolytic reversal of inhibition of the Ca2+ current (ICa) by nifedipine (Sanguinetti and Kass, 1984). Photolysis of DM-nitrophen allows rapid and uniform increases in [Ca2+]i throughout the terminal (Kaplan and Ellis-Davies, 1988; Naraghi et al., 1998). The pipette solution for Ca2+ uncaging experiments consisted of the following (in mm): 10 DM-nitrophen (Invitrogen), 0.5 Oregon-Green BAPTA-6F (OGB6-F; Invitrogen), 8 CaCl2, 2 diaminopropanoltetraacetic acid (DPTA), 40 Cs-gluconate, 20 Cs-glutamate, 40 HEPES, 10 TEACl, 1 MgCl2, and 0.5 GTP. Intraterminal Ca2+ was calculated using the following equation (Lev-Ram et al., 1992):
 |
ΔF/F represents the fractional change in OGB-6F fluorescence resulting from stimulation. (ΔF/F)max was determined from the maximal fluorescence change produced by application of 500 ms depolarizing steps to −10 mV. We used the Kd of 3 μm for OGB-6F provided by Invitrogen. The resting Ca2+ concentration ([Ca2+]rest) was determined ratiometrically from an aliquot of the pipette solution using 0.2 mm Fura-2 as described previously (Thoreson et al., 2004).
Unless otherwise stated, chemicals were obtained from Sigma-Aldrich. The criterion for statistical significance was chosen to be p < 0.05 and evaluated using GraphPad Prism 4.0. Variability is reported as ±SEM.
Results
Comparison of replenishment and sustained release
The rate of sustained release in darkness is governed by the rate of replenishment (Jackman et al., 2009). To test whether replenishment remains rate limiting for sustained release at more hyperpolarized membrane potentials, we examined the balance between rates of release and replenishment over a range of potentials spanning the normal physiological voltage range for cones. For these experiments, we applied lengthy depolarizing steps (8 s) to a range of test potentials from −65 to −40 mV. At the end of the 8 s test step, we applied a probe step to −10 mV to stimulate release of all vesicles remaining in the readily releasable pool. As illustrated by the example in Figure 1A, application of a lengthy step from −70 to −65 mV evoked no detectable EPSC, but the probe step to −10 mV evoked a large EPSC of 210 pA. Increasing the amplitude of the 8 s test step in 5 mV increments from −60 to −40 mV caused a progressive increase in the size of the initial EPSC and a decrease in the EPSC evoked by the probe step to −10 mV. Thus, in this same cell, a test step to −40 mV evoked an EPSC of 38 pA and the subsequent probe step to −10 mV evoked an EPSC of 119 pA (Fig. 1B). Although there was some rundown, the sum of these two responses (157 pA) is similar to the amplitude of the EPSC evoked by the probe step from −65 to −10 mV. The amplitude of the initial EPSC as a function of test step voltage is shown by the black bars in Figure 1C. The amplitude of the EPSC evoked by the probe step to −10 mV is shown by the white bars. If release rates exceed replenishment rates, then the releasable pool should be progressively depleted during the 8 s depolarization and the sum of the initial plus final EPSCs should diminish. If replenishment exceeds release, then the EPSC should recover during the steady depolarizing step and the sum of the two EPSCs should increase. Instead, the sum of both responses remained constant and equal to the size of the EPSC evoked by the probe step from −65 to −10 mV (Fig. 1C) (ANOVA, p = 0.90). These data indicate that replenishment and release rates match one another, as expected if replenishment is rate limiting for sustained release.
Figure 1.
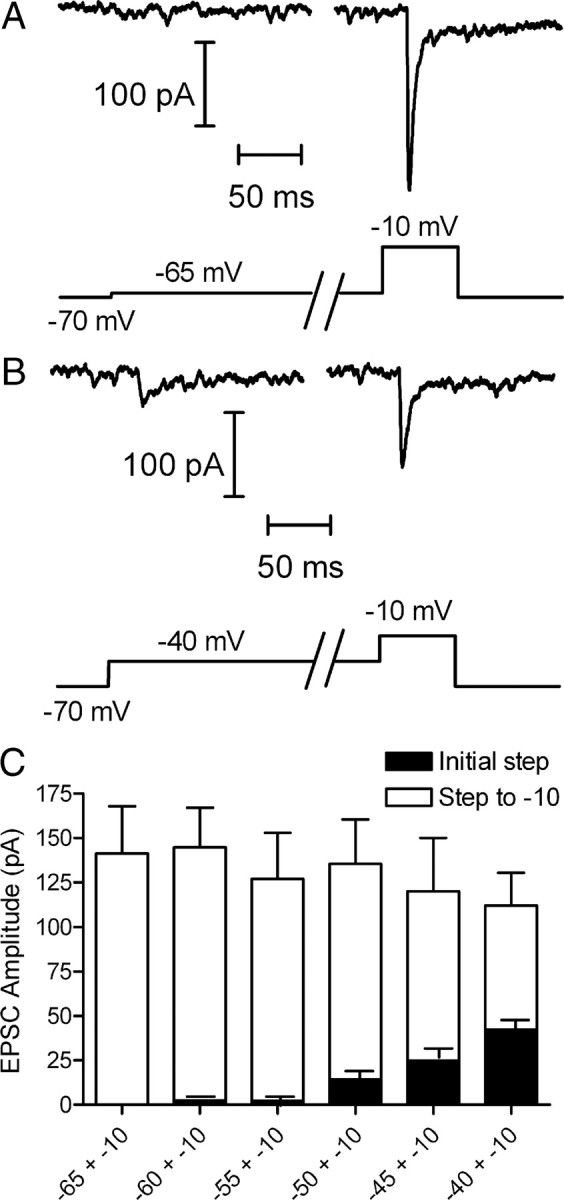
Replenishment rates match release rates during sustained depolarization in the physiological voltage range. A, Membrane current recorded from a voltage-clamped horizontal cell while applying a voltage step in the cone to −65 for 8 s. This lengthy test step was followed by a probe step to −10 mV for 100 ms to stimulate release of the remainder of the readily releasable pool. B, EPSC evoked in the same horizontal cell by an initial 8 s step to −40 mV and the subsequent probe step to −10 mV. C, Stacked amplitudes of the initial 8 s test step (black bars, n = 13) and subsequent probe step to −10 mV (white bars). The sum of both responses remained constant over the range of test steps from −65 to −40 mV (ANOVA, p = 0.90), consistent with a balance between replenishment and release. The slight decrease in the summed response is due to response rundown during this extensive series of experiments.
Postsynaptic receptor saturation and desensitization with long-lasting stimuli
To measure rates of replenishment at the cone synapse, we recorded simultaneously from a cone and postsynaptic OFF bipolar or horizontal cell. We applied a 7 s train of depolarizing pulses to the cone to empty the releasable pool and thereby attain a steady state where the rate of replenishment limits the rate of release (Schneggenburger et al., 1999, 2002). In the example in Figure 2, a train of 25 ms test steps from −70 to −10 mV was applied at a frequency of 13.3 Hz. The EPSC evoked by the first pulse in the train, which reflects release of the entire readily releasable pool of ∼20 vesicles per ribbon (Rabl et al., 2005; Bartoletti et al., 2010), averaged 110 ± 6.4 pA (n = 50). Release diminished dramatically after the first EPSC with a slight recovery after ∼200 ms (Fig. 2B). Maintained stimulation empties a reserve pool of ∼90 additional vesicles with a time constant of ∼400 ms (Innocenti and Heidelberger, 2008; Bartoletti et al., 2010). To assess synaptic release during the train, we measured the cumulative charge transfer by integrating the series of EPSCs evoked by the entire train. We calculated the rate of replenishment from the slope of a straight line fit to the cumulative charge transfer during the final 2 s of the train when replenishment balances release (Schneggenburger et al., 1999; Sakaba et al., 2002).
Figure 2.
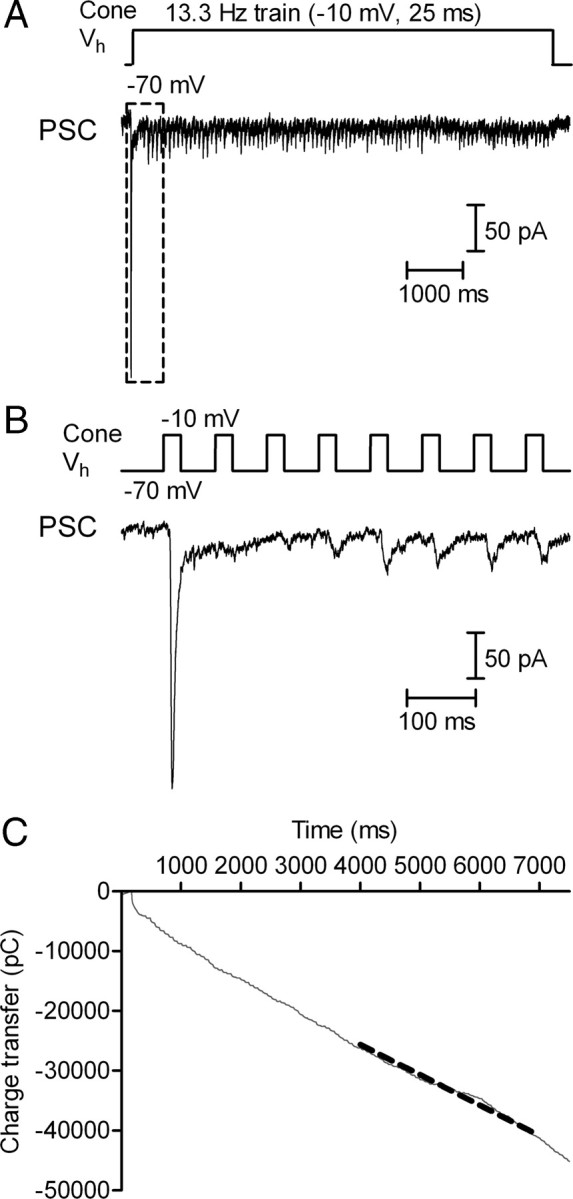
Measurement of replenishment rate at the cone synapse using pulse trains. A, A 7 s pulse train (13.3 Hz, 25 ms steps to −10 mV) was applied to the cone while we simultaneously recorded the EPSC from an OFF bipolar cell. Vh, Membrane holding potential. B, Responses to the first 8 test pulses (dashed square in A). C, Cumulative EPSC charge transfer measured by integrating the entire EPSC trace. The replenishment rate was calculated from the linear slope of cumulative charge transfer during the final 2 s of the train. The dashed gray line shows the straight line fit to this region.
Although receptor saturation and desensitization may shape the kinetics of individual mEPSCs, mEPSCs exhibit sufficient spatiotemporal independence so that EPSCs evoked in horizontal or OFF bipolar cells by brief test steps applied to presynaptic cones can be constructed from a linear sum of individual mEPSCs (Cadetti et al., 2005, 2008). If continued release of glutamate during a pulse train caused a progressive increase in the amount of receptor saturation or desensitization, then one would expect to see a progressive decrease in the slope of the charge transfer relationship. This was not observed, suggesting that desensitization and saturation do not increase during the train.
One key piece of evidence for the ability of quanta to sum linearly during EPSCs was the finding that blocking glutamate receptor desensitization caused a comparable broadening of both quantal mEPSCs and EPSCs evoked by a brief depolarizing test step (Cadetti et al., 2005, 2008). To test whether EPSC charge transfer continues to provide an accurate measure of glutamate release with continued release during the pulse train, we tested effects of blocking desensitization with cyclothiazide (CTZ) (Patneau et al., 1993; Yamada and Tang, 1993). As expected (Kawai, 1999; Maple et al., 1999; Cadetti et al., 2005), CTZ (100 μm) broadened OFF bipolar cell mEPSCs, increasing the quantal charge transfer by 38 ± 9.6% (n = 7 cells). If quanta sum linearly, then the increase in individual mEPSC charge transfer should cause the same broadening of the overall EPSC (Cadetti et al., 2008). As illustrated in Figure 3, CTZ increased the initial EPSC (compare insets) as well as the slope of cumulative charge transfer during the final 2 s of the train (Fig. 3C). Normalizing the integrated EPSC in Figure 3C by the single quantal charge measured in control and CTZ-treated conditions yielded a very similar release profile in both conditions (Fig. 3D). On average, the fast EPSC component increased by 36.1 ± 13.4% (n = 7; control: 9663 ± 1687 pC; CTZ: 13,562 ± 2656 pC) and the slope of cumulative charge transfer during the final 2 s of the train increased by 43.8 ± 22.4% (control: 4.51 ± 0.983 pC/ms; CTZ: 5.65 ± 1.02 pC/ms). These values did not differ significantly from the increase in quantal charge transfer (ANOVA, p = 0.94), suggesting that during protracted stimulation with a train of pulses, the postsynaptic effects of individual mEPSCs continue to sum linearly with one another and that charge transfer measurements provide a reliable measure of glutamate release throughout the train.
Figure 3.

Cone synapses do not exhibit progressively increasing desensitization. A, EPSC recorded from a voltage-clamped horizontal cell evoked by a pulse train (13.3 Hz, 25 ms steps to −10 mV) applied to a simultaneously voltage-clamped cone. Responses to the first five pulses are magnified in the inset. B, Simultaneous recording from the same cone/horizontal cell pair after application of 100 μm CTZ. Responses to the first five pulses are shown in the inset. C, EPSC charge transfer from the same horizontal cell measured in control conditions (black line) and after application of CTZ (red line). The linear fits to the final 2 s are shown by heavy dashed lines in both conditions. D, EPSC charge transfer in C divided by quantal amplitude in control (20.2 ± 1.03 pC, n = 121 events) and CTZ-treated conditions (31.3 ± 1.56 pC, n = 100). After normalizing for differences in quantal size, the rate of quantal release during the final 2 s of the train did not differ greatly in control (black trace, 133 vesicles/s) and CTZ (red trace, 149 vesicles/s).
Voltage dependence of replenishment
To test whether replenishment rates vary with membrane voltage, we stimulated cones with a train of pulses to −30 mV (from −70 mV) and then increased the pulse amplitude to −10 mV midway through the pulse train (Fig. 4A). Increasing the pulse amplitude to −10 mV stimulated a significantly (p = 0.0003, paired t test) faster replenishment rate (slope = 3.26 ± 0.48 pC/ms, n = 14) than the rate measured with pulse trains to −30 mV (slope = 1.71 ± 0.27 pC/ms). Similar to the linear relationship between exocytosis and ICa at the photoreceptor synapse (Thoreson et al., 2004; Rabl et al., 2006), rates of replenishment varied in a nearly linear fashion with changes in cone ICa amplitude (slope = 0.84 ± 0.062) evoked by steps to different test potentials (−40 mV pulse train, n = 8; −30 mV train, n = 14; −20 mV train, n = 11; −10 mV train, n = 22).
Figure 4.
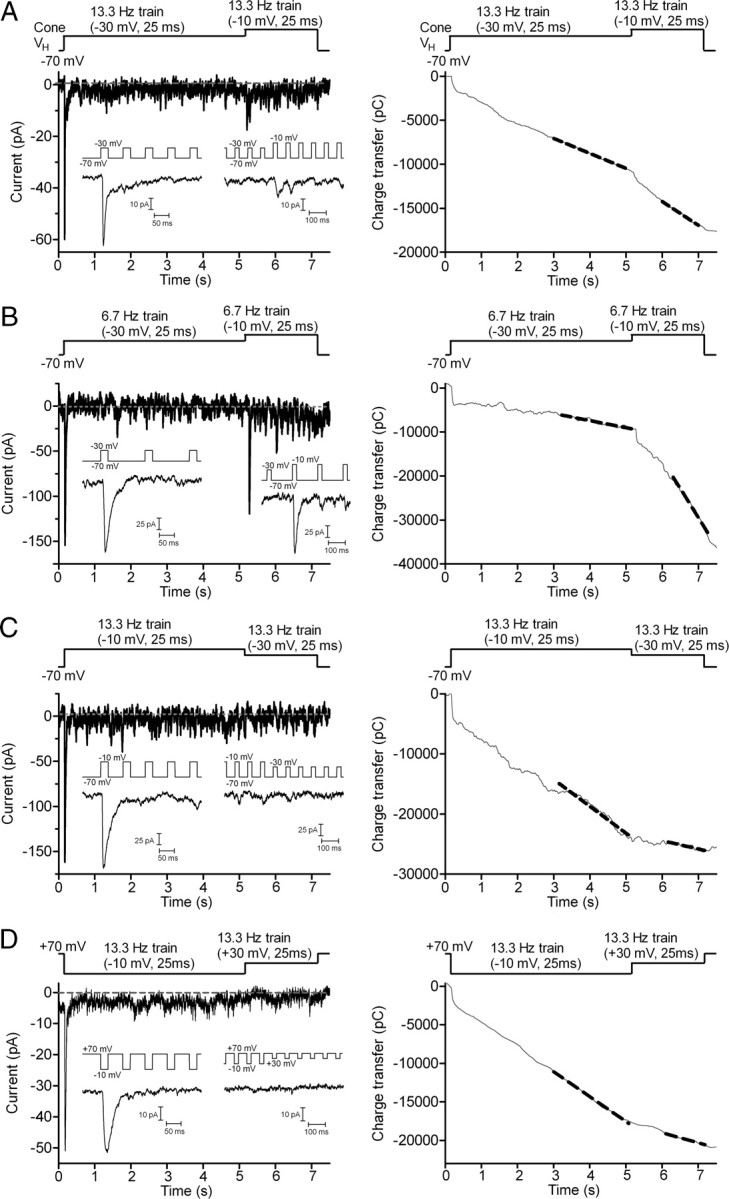
The rate of replenishment shows a voltage dependence arising from voltage-dependent changes in Ca2+ influx. A, EPSC recorded from a voltage-clamped OFF bipolar cell evoked by a pulse train (13.3 Hz, 25 ms steps from −70 to −30 mV) applied to a simultaneously voltage-clamped cone. After 5 s, the test step amplitude was increased to more strongly activate ICa and thereby increase Ca2+ influx (13.3 Hz, 25 ms steps from −70 to −10 mV). Insets show EPSCs evoked by the first five steps at the beginning of the pulse train and immediately after increasing test step amplitude. Right panel of A, Cumulative charge transfer of the OFF bipolar EPSC shown at the left. Dashed line shows the straight line fits used to determine replenishment rates. The steeper slope indicates that replenishment rate increased after the test step was changed from −30 mV to −10 mV. B, EPSC recorded from a different cone/OFF bipolar cell pair using a longer interpulse interval (150 ms). After applying a 5 s train of pulses to −30 mV (6.7 Hz, 25 ms steps), the test step amplitude was increased to −10 mV. Insets show EPSCs evoked at the beginning of the pulse train and immediately after increasing test step amplitude. Right panel of B, Cumulative charge transfer of the OFF bipolar EPSC shown at the left. C, OFF bipolar cell EPSC evoked by a pulse train beginning with a train of steps to −10 mV (25 ms, 75 ms interpulse intervals, 13.3 Hz) for 5 s followed by a 2 s train of steps to −30 mV. Insets show EPSCs evoked at the beginning of the pulse train and immediately after changing test step amplitude. Right panel of C: Cumulative charge transfer of the OFF bipolar EPSC in C shows a decline in replenishment when the test pulse amplitude was reduced from −10 to −30 mV. The same cell pair was used in B. D, EPSC recorded from another OFF bipolar cell during application of a pulse train (13.3 Hz, 25 ms steps from +70 to −10 mV) to a simultaneously voltage-clamped cone. After 5 s, the test step amplitude was changed to reduce Ca2+ driving force and thereby reduce Ca2+ influx (13.3 Hz, 25 ms steps from +70 to +30 mV). Insets show EPSCs evoked at the beginning of the pulse train and immediately after changing test step amplitude. Right panel of D, Cumulative charge transfer of the OFF bipolar EPSC in C shows a decline in replenishment when the test pulse amplitude was changed to +30 mV.
We also examined replenishment using a longer interpulse interval of 150 ms (6.7 Hz) (Fig. 4B). As found with an interval of 75 ms, increasing test pulse amplitude from −30 mV to −10 mV stimulated a significantly faster replenishment rate (slope = 7.32 ± 2.35 pC/ms, n = 8) than the rate measured with the train to −30 mV (slope = 3.54 ± 1.47 pC/ms; p = 0.02, paired t test). Replenishment rates obtained with trains of test pulses to −10 mV did not differ significantly between the two interpulse intervals (p = 0.46, n = 13).
The rate of replenishment could also be slowed by reducing test pulse amplitude from −10 mV to −30 mV (Fig. 4C). Using the 75 ms interpulse interval (13.3 Hz), replenishment rate declined significantly (p = 0.0045, paired t test) from 5.13 ± 1.19 (n = 8) to 3.68 ± 1.17 pC/ms. With the 150 ms interpulse interval (6.7 Hz), replenishment rate declined significantly (p = 0.0018, paired t test) from 5.10 ± 0.83 (n = 7) to 2.79 ± 1.00 pC/ms.
To test whether voltage-dependent changes in the rate of replenishment represent a direct effect of membrane voltage on proteins involved in replenishment (Murata et al., 2005) or a voltage-dependent increase in Ca2+ influx through L-type Ca2+ channels (Wilkinson and Barnes, 1996), we tested a train with strongly depolarizing steps to +30 mV. Because of the reduced driving force for Ca2+ entry at positive potentials, steps to +30 mV stimulated less Ca2+ influx than steps to −10 mV. If replenishment is Ca2+ dependent, then the rate should decline with steps to +30 mV. On the other hand, if replenishment is purely voltage dependent, then the rate should increase or remain the same with use of more strongly depolarizing test steps. We held the cell at +70 mV, near the Ca2+ reversal potential. We applied a train of 25 ms pulses to −10 mV for the first 5 s and then switched to +30 mV pulses. As shown in Figure 4C, changing the pulse amplitude to +30 mV diminished replenishment rates by 64% (slope of −10 train: 2.36 ± 0.47 pC/ms, +30 train: 0.85 ± 0.12 pC/ms, n = 6, p = 0.0147), suggesting that the voltage dependence of replenishment is a result of voltage-dependent changes in Ca2+ influx.
Lengthening stimulus pulse duration accelerates replenishment
As an additional test of the hypothesis that replenishment is Ca2+ dependent, we lengthened −30 mV test steps to match the amount of Ca2+ influx during a 25 ms step to −10 mV. On average, 65 ms steps to −30 mV stimulated the same amount of Ca2+ entry as 25 ms steps to −10 mV (65.5 ± 3.53 ms, n = 9) (Fig. 5A,B). Consistent with Ca2+ dependence of replenishment, use of a 13.3 Hz train consisting of 65 ms pulses to −30 mV produced nearly the same rate of replenishment [3.07 ± 0.66 pC/ms; 154.3 ± 33.3 vesicles (v)/s/cone] as a 13.3 Hz train with 25 ms steps to −10 mV (3.20 ± 0.67 pC/ms, 160.9 ± 33.7 v/s/cone, p = 0.122; n = 10) (Fig. 5C,D). Consistent with results of Figure 4, a train of 25 ms pulses to −30 mV stimulated a significantly slower replenishment rate (1.42 ± 0.30 pC/ms; 71.1 ± 15.1 v/s/cone; p = 0.0017) (Fig. 5E). This indicates that replenishment depends more on the amount of Ca2+ influx than on the pure voltage change in the membrane.
Figure 5.
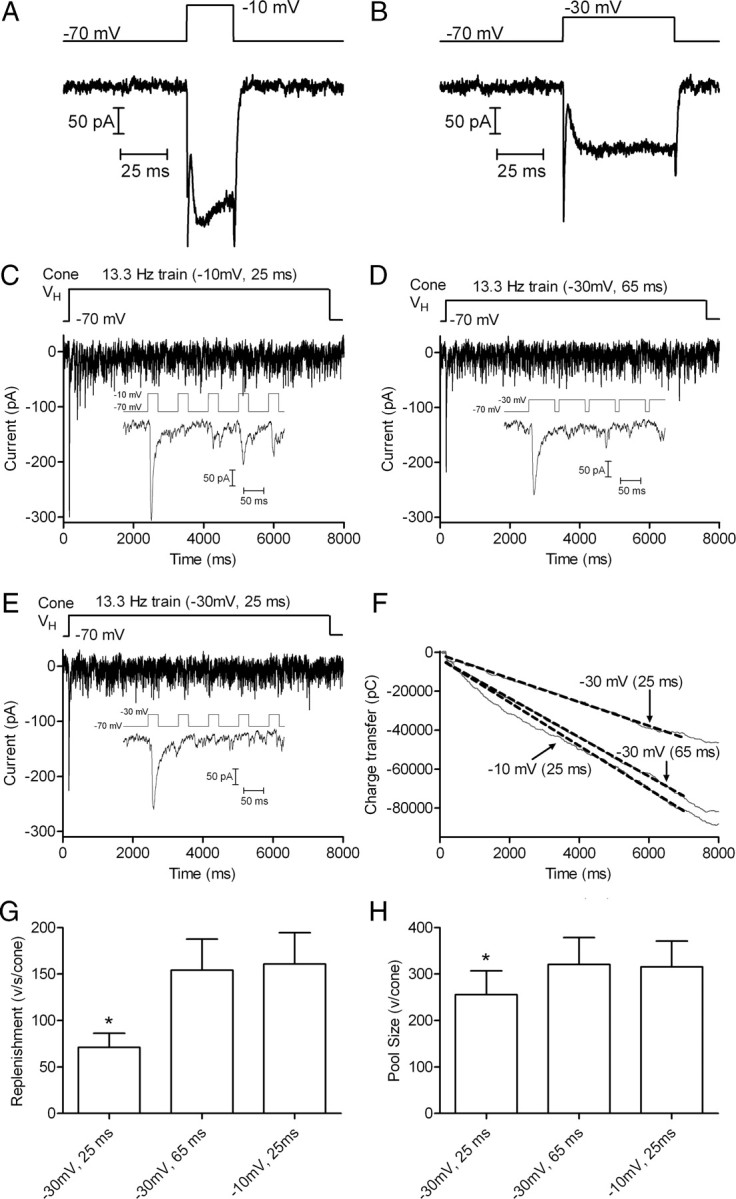
Matching calcium influx during steps to −30 and −10 mV yields matching replenishment rates. A, ICa recorded from a cone in response to a 25 ms step from −70 to −10 mV. Capacitative and leak currents were subtracted using a P/8 protocol. B, ICa recorded from the same cone in response to 65 ms step from −70 to −30 mV. Although the amplitude differed, the charge transfer during ICa was similar with both stimuli: 6338 pC during the 25 ms step to −10 mV and 6692 pC during the 25 ms step to −30 mV. C, EPSCs recorded from an OFF bipolar cell by application of 13.3 Hz train of pulses (−70 to −30 mV, 25 ms) to a presynaptic cone. Inset shows the EPSC evoked by the first five pulses. D, EPSCs evoked in the same OFF bipolar cell by application of a 13.3 Hz train using stronger pulses (−70 to −10 mV, 25 ms) that stimulated greater Ca2+ influx into the presynaptic cone. E, EPSCs evoked in the same OFF bipolar cell using a 13.3 Hz train of pulses to −30 mV that were lengthened to 65 ms to match the Ca2+ influx accompanying 25 ms pulses to −10 mV. F, Plot of cumulative charge transfer during the EPSC for the 3 different pulse trains from the same cell pair. Data points from 5 to 7 s were fit by linear regression to obtain the slope (replenishment rate) and Y-intercept (releasable pool size). G, Comparison of mean replenishment rates obtained with the three different pulse train protocols (n = 10 pairs). H, Comparison of releasable pools measured with the three different pulse train protocols in the same cell pairs.
Extrapolating the straight line fit to the cumulative release function back to time 0 provides the size of the total vesicle pool that was initially available for release (Schneggenburger et al., 1999; Sakaba et al., 2002). We compared the size of the releasable pool by determining the Y-intercept of the straight line fit to the cumulative charge transfer functions obtained with different pulse train protocols. Charge transfer measurements were converted into quanta using an average amplitude of mEPSCs measured in 7 OFF bipolar cells of 19.9 pC/vesicle (n = 325 events). The vesicle pool emptied by a train of 25 ms steps to −30 mV was 5094 ± 1010 pC (256.0 ± 50.74 v/cone, n = 10), ∼20% smaller than the pool emptied by a train of 25 ms steps to −10 mV (6281 ± 1102 pC, 315.6 ± 55.4 v/cone, n = 10; p = 0.0001) or a train of 65 ms steps to −30 mV (6386 ± 1144 pC, 320.9 ± 57.5 v/cone, n = 10, p = 0.0012) (Fig. 5). Scaled for the average amplitude of mEPSCs in OFF bipolar cells (6.7 ± 0.14 pA, n = 325 events), a single ribbon would be expected to contribute 54 pA to the amplitude of the initial EPSC (Bartoletti et al., 2010). Thus, the amplitude of EPSCs in this sample of 10 cells (149.7 ± 25.7 pA) suggests that each cone contacted each OFF bipolar cell at an average of 2.8 ribbons. This in turn implies that trains of 25 ms steps to −10 mV or 65 ms steps to −30 mV empty a releasable pool of ∼115 vesicles per ribbon, close to the releasable pool size of ∼110 vesicles per ribbon estimated previously (Bartoletti et al., 2010).
Every vesicle that is released at the synapse exits through the readily releasable pool. Therefore, expanding the size of the readily releasable pool would be expected to cause a linear increase in replenishment by increasing the number of available exits. Consistent with this, replenishment rates varied nearly linearly with the size of the readily releasable pool measured in different cell pairs (slope = 0.82 ± 0.18, r2 = 0.47, n = 26). The reduction in replenishment rate observed with 25 ms steps to −30 mV can thus be partly explained by the availability of 20% fewer release sites. However, a 20% reduction in pool size accounts for less than half of the 55% observed reduction in replenishment rate, suggesting that in addition to expanding the readily releasable pool, Ca2+ speeds the recruitment of vesicles to this pool. Consistent with this, replenishment rate increased when Ca2+ influx was enhanced, but the size of the readily releasable pool did not expand. A train of 25 ms pulses to −10 mV completely empties the readily releasable pool (Bartoletti et al., 2010), and lengthening the pulse duration to 50 ms did not stimulate a larger EPSC, indicating that it did not evoke additional release (Fig. 6A). Although it did not expand the readily releasable pool, lengthening the pulse duration to 50 ms (256.6 ± 40.4 v/ s/cone) caused significantly more rapid replenishment than the 25 ms pulse train (181.9 ± 32.2 v/s/cone, p < 0.0001) (Fig. 6B).
Figure 6.
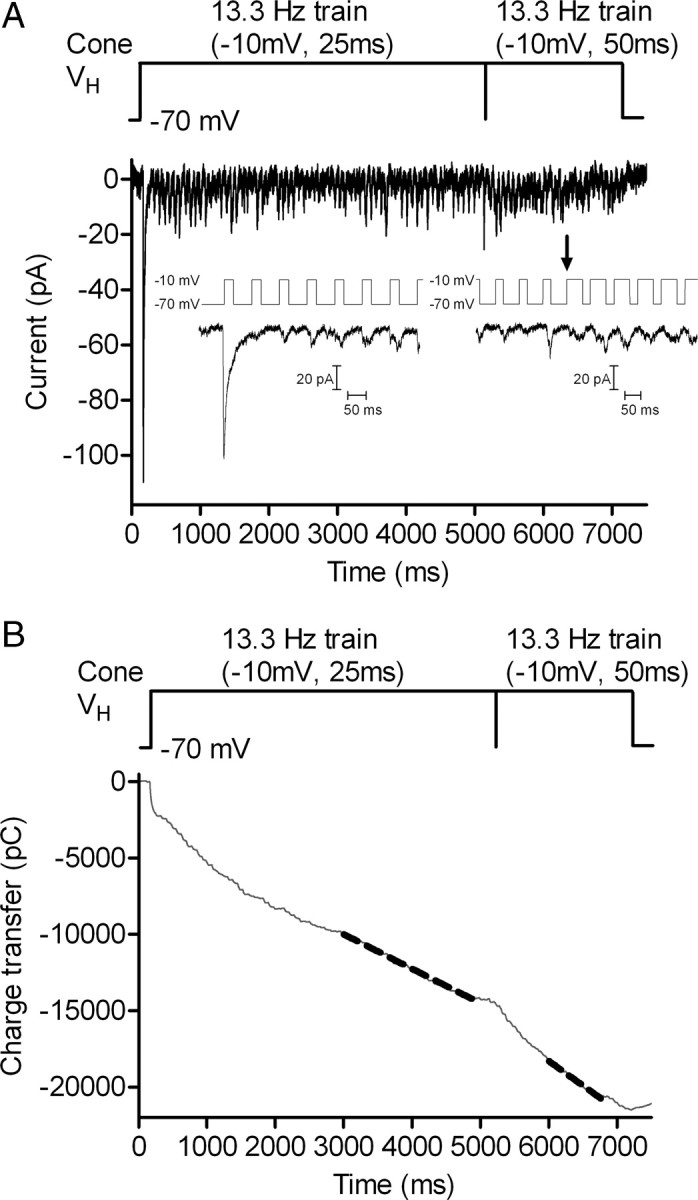
Lengthening a strong depolarizing pulse elevated replenishment rate without expanding the readily releasable pool. A, EPSCs recorded from a horizontal cell in response to a pulse train (13.3 Hz, −70 to −10 mV) applied to a simultaneously voltage-clamped cone. Five seconds into the trial, the pulse duration was lengthened from 25 to 50 ms. Insets show the EPSCs evoked by the first five steps and when the test pulse was lengthened (arrow). Lengthening the test pulse did not evoke an appreciably larger EPSC, consistent with results from Bartoletti et al. (2010) that a 25 ms test pulse to −10 mV empties the readily releasable pool. B, Cumulative release fit with straight lines at the end of each stimulus condition.
Elevation of intraterminal calcium accelerates replenishment
The results presented so far indicate that Ca2+ plays an important role in recruiting vesicles to the readily releasable pool. To test whether Ca2+ entry through L-type Ca2+ channels can accelerate replenishment, we abruptly increased Ca2+ influx into cones during a pulse train (13.3 Hz, steps to −10 mV for 25 ms) by taking advantage of the fact that inhibitory effects of nifedipine on L-type ICa can be relieved by a bright UV light flash (Sanguinetti and Kass, 1984). Figure 7A shows that a brief UV flash enhanced cone ICa recorded in the presence of 3 μm nifedipine by 30%. This disinhibition persisted beyond the end of the train (>1 s). Increasing Ca2+ influx by unblocking nifedipine's inhibitory effects significantly accelerated the replenishment rate during a pulse train (Fig. 7) from 67.3 ± 16.5 to 199.5 ± 25.1 v/s/cone (p = 0.0002, n = 13). We did not observe a larger EPSC immediately after the UV flash (Fig. 7B, inset), indicating that the Ca2+-dependent increase in replenishment is not due to expansion of the readily releasable vesicle pool.
Figure 7.
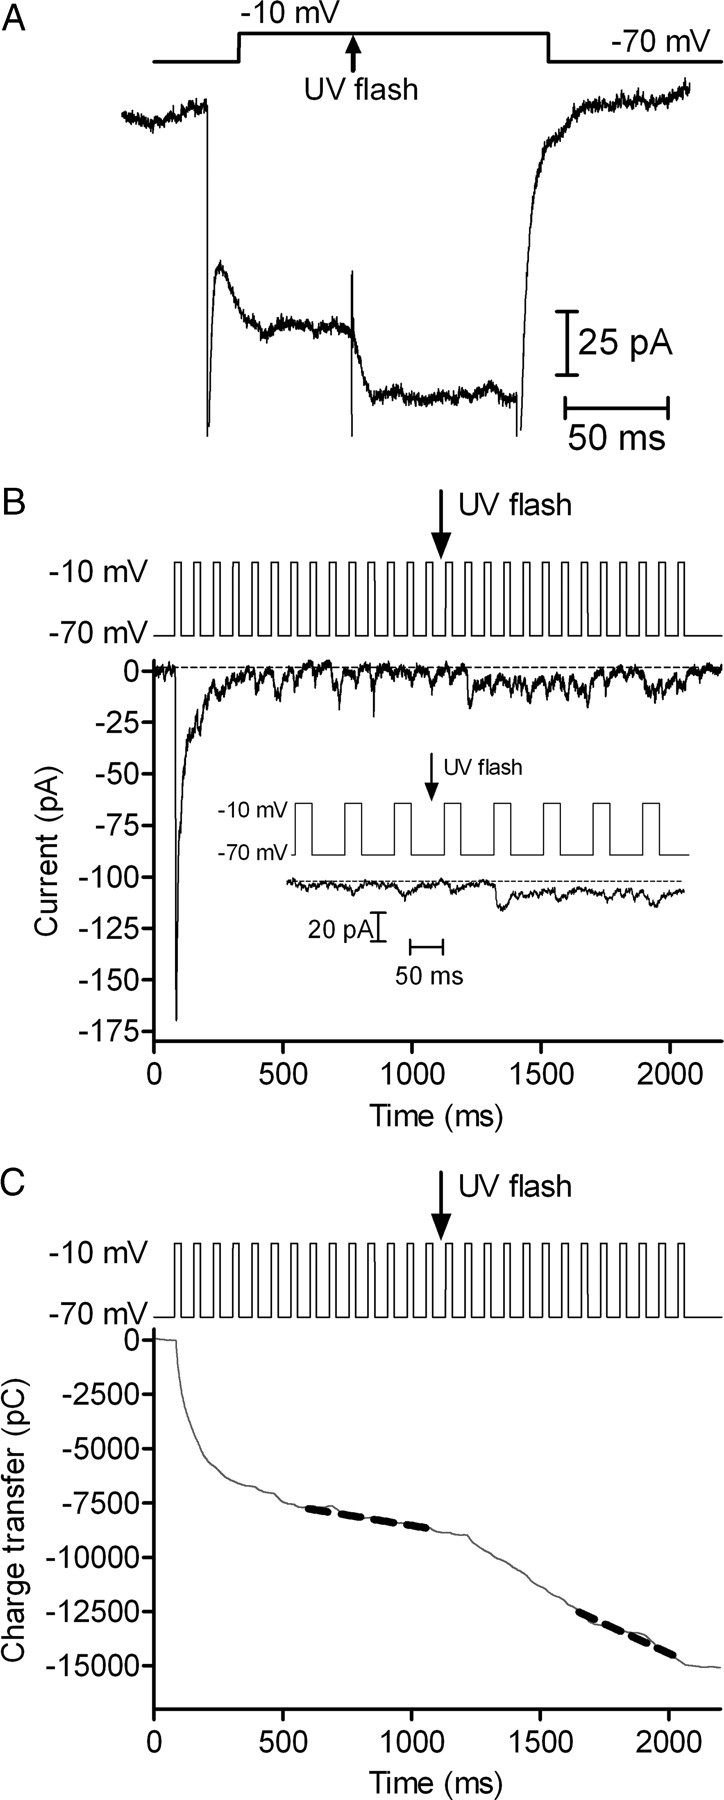
Abruptly unblocking L-type calcium channels increases replenishment rates. A, Cone ICa recorded in the presence of 3 μm nifedipine and evoked by a step from −70 mV to −10 mV (150 ms). Capacitative and leak currents were subtracted using a P/8 protocol. A brief UV light flash applied in the middle of the step (arrow) abruptly increased ICa by photolytically unblocking the antagonistic effects of nifedipine (Sanguinetti and Kass, 1984). B, EPSCs recorded from an OFF bipolar cell in response to a pulse train (13.3 Hz, −70 to −10 mV) applied to a simultaneously voltage-clamped cone. Recording was obtained in the presence of 3 μm nifedipine. A UV flash was applied in the middle of the pulse train to unblock nifedipine. Inset magnifies a section of the record to show EPSCs shortly before and after the flash. C, Cumulative charge transfer during the EPSC. Dashed gray line shows the straight line fits used to estimate the replenishment rates.
Focusing more directly on the role of Ca2+, we tested effects of elevating Ca2+ by flash photolysis of the caged Ca2+ compound, DM-nitrophen. Cones were dialyzed for 2–5 min with DM-nitrophen and a Ca2+ indicator dye, OGB6-F, through the patch pipette. Ca2+ was uncaged in the middle of a pulse train (13.3 Hz, 25 ms steps to −10 mV). Figure 8 shows an example of Ca2+ changes from a single confocal section of a cone during one such experiment. Before uncaging, the pulse train stimulated a Ca2+ increase in the synaptic terminal region at the base of the cone. Consistent with the localization of Ca2+ channels to cone terminals (Nachman-Clewner et al., 1999; Xu and Slaughter, 2005), there was a smaller increase in the soma than in the terminal. Uncaging Ca2+ from DM-nitrophen with a short UV flash further increased [Ca2+]i to similar levels in the terminal and soma (Fig. 8C). The slightly higher level attained in the terminal is likely due to the higher level present in the terminal before the flash. We acquired images of the cone every 60 ms and measured [Ca2+]i as close as possible to the terminal. As shown in Figure 9, abruptly elevating [Ca2+]i in a cone 5 s into the pulse train by photolytic uncaging of DM-nitrophen speeded replenishment from 125.2 ± 31.6 v/s/cone to 312.2 ± 79.64 v/s/cone (p = 0.0037). Figure 9C shows the increase in replenishment from multiple cells plotted as a function of [Ca2+]i. The replenishment rate increased when [Ca2+]i was elevated above ∼300 nm, and this Ca2+-dependent increase showed a slope of 2.3 when plotted on log/log axes (Fig. 9C). These properties are similar to Ca2+ dependence of exocytosis from cones, which exhibits a threshold of ∼400 nm and power law relationship of ∼2 (Duncan et al., 2010).
Figure 8.

An example of calcium uncaging in a cone. A, Single confocal section showing an image of a cone in the retinal slice loaded with DM-nitrophen (10 mm) and the Ca2+ indicator dye OGB-6F (0.5 mm) before stimulation (image was obtained at time point A in the graph). Scale bar is 10 μm. B, Applying a train of pulses (13.3 Hz, −70 mV to −10 mV, 25 ms) increased fluorescence in the terminal and soma regions of the cone (time point B in the graph). C, [Ca2+]i was rapidly elevated in both the soma and terminal by a flash of UV light (time point C in the graph). OS, Outer segment; IS, inner segment; S, soma; T, terminal. D, [Ca2+]i change during the −10 mV train and the UV flash. Open circles show the Ca2+ level of the terminal and solid line shows the [Ca2+]i change measured in the center of the soma.
Figure 9.
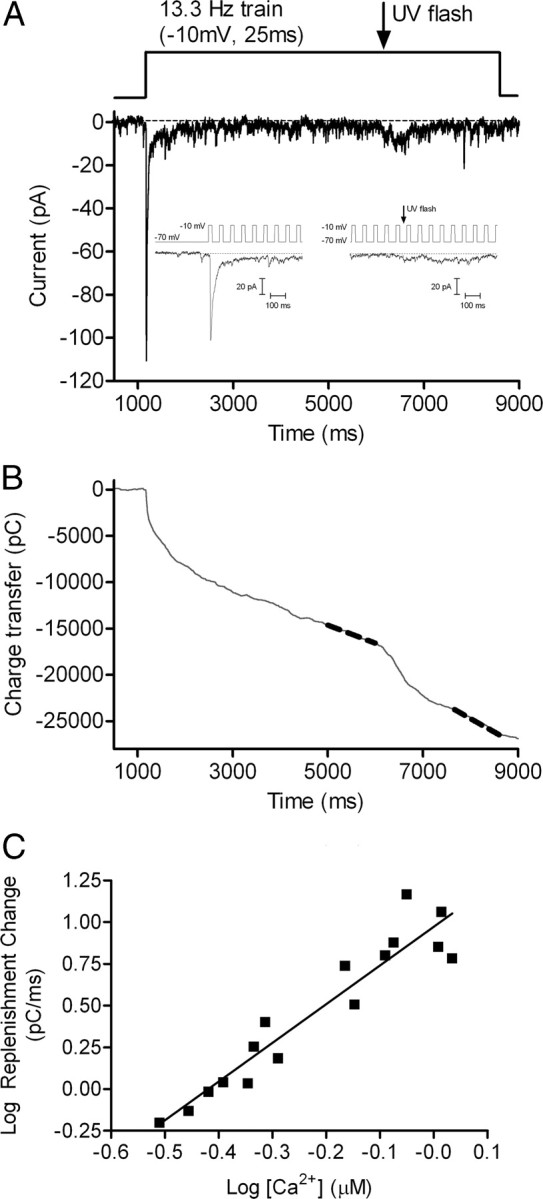
Intracellular calcium dependence of replenishment. A, EPSCs recorded from an OFF bipolar cell in response to a pulse train (13.3 Hz, −70 to −10 mV) applied to a simultaneously voltage-clamped cone. Ca2+ was uncaged from DM-nitrophen by application of a UV light flash 5 s into the trial. Insets magnify EPSCs at the start of the stimulus train and at the time of the UV flash. B, Cumulative charge transfer during the pulse train. Dashed gray line shows the straight line fits used to determine the replenishment rate. C, The relation between the change in replenishment rate observed after Ca2+ uncaging and postflash [Ca2+]i measured near the cone terminal. [Ca2+]i was determined from OGB-6F fluorescence changes using Equation 1. Data were plotted on log/log axes. Solid line shows the straight line fit with a slope of 2.32 ± 0.21.
Location of Ca2+-dependent sites in replenishment
Replenishment and release exhibit similar Ca2+ dependencies, but do both mechanisms involve the same sites? To address this question, we compared the locations of Ca2+-dependent sites involved in replenishment and release by using different Ca2+ buffers to limit the spread of Ca2+ from voltage-gated Ca2+ channels. We compared the effects on EPSC charge transfer of increasing the pulse amplitude from −30 mV (25 ms, 13.3 Hz) to −10 mV (25 ms, 13.3 Hz) when using 1 mm BAPTA, 0.5 mm EGTA, or 5 mm EGTA in the cone patch pipette. Figure 10, A and B, illustrates EPSCs obtained from different cell pairs using 1 mm BAPTA and 0.5 mm EGTA, respectively. Figure 10C shows the cumulative EPSC charge transfer during the pulse trains in these same two experiments. Increasing pulse strength from −30 to −10 mV stimulated a much larger increase in replenishment (steeper slope) when using 0.5 mm EGTA than with 5 mm BAPTA in the patch pipette (Fig. 10C). Figure 4A showed EPSCs obtained with the same experimental protocol using 5 mm EGTA. A comparison of the slopes of the lines fit to cumulative EPSC charge transfer in all three buffer conditions shows that the increase in replenishment rate stimulated by increasing pulse strength from −30 mV to −10 mV diminished significantly as Ca2+ buffering was increased (Fig. 10D). Buffer space constants were estimated at 22 nm for 1 mm BAPTA (kon = 6 × 10⁸ m−1 · s−1) (Tsien, 1980), 200 nm for 5 mm EGTA (kon = 1.5 × 10⁶ m−1 · s−1) (Adler et al., 1991), and 632 nm for 0.5 mm EGTA (Roberts, 1993). The finding that replenishment rates differed in all three buffer conditions suggests that replenishment involves sites >200 nm from Ca2+ channels clustered at the base of the ribbon. By contrast, the initial fast EPSC was not significantly diminished by changing the EGTA concentration from 0.5 mm (n = 10) to 5 mm (n = 18, p = 0.26) or use of 1 mm BAPTA (0.5 mm EGTA vs 1 mm BAPTA, p = 0.07; 5 mm EGTA vs 1 mm BAPTA, p = 0.12, n = 11), suggesting that sites of exocytosis are <200 nm from Ca2+ channels and perhaps as close as 20 nm. Thus, although the Ca2+ dependencies are similar, Ca2+-dependent sites of replenishment involve locations that are distinct from fusion sites.
Figure 10.

Effects of exogenous calcium buffers on the rate of replenishment in cones. A, EPSC recorded from a voltage-clamped OFF bipolar cell evoked by a pulse train (13.3 Hz, 25 ms steps from −70 to −30 mV) applied to a simultaneously voltage-clamped cone. After 5 s, the test step amplitude was increased to more strongly activate ICa and thereby increase Ca2+ influx (13.3 Hz, 25 ms steps from −70 to −10 mV). The cone patch pipette in this experiment contained 1 mm BAPTA. Experiments shown in previous figures used 5 mm EGTA in the cone patch pipette. B, Same stimulus protocol performed in a different cell pair using 0.5 mm EGTA in the cone pipette solution. Insets in A and B show EPSCs recorded shortly before and after changing the test pulse amplitude from −30 to −10 mV. C, EPSC charge transfer from the two cell pairs shown in A and B. To emphasize the larger slope change observed with 0.5 mm EGTA, we selected cell pairs that exhibited similar rates during the initial train of pulses to −30 mV. Dashed gray lines show straight line fits used to estimate replenishment rates. D, Change in replenishment rate caused by increasing Ca2+ influx with use of a stronger test pulse in the three different buffering conditions: 1 mm BAPTA, 32.9 ± 10.0 v/s/cone (n = 11); 5 mm EGTA, 83.7 ± 11.3 v/s/cone (n = 15); 0.5 mm EGTA, 129.3 ± 20.8 v/s/cone (n = 8); 1 mm BAPTA versus 5 mm EGTA, p = 0.0037; 1 mm BAPTA versus 0.5 mm EGTA, p = 0.0003; 5 mm EGTA versus 0.5 mm EGTA, p = 0.047.
Discussion
Similar to other neurons, cone photoreceptors possess readily releasable, reserve, and resting pools of synaptic vesicles. The readily releasable pool consists of ∼20 vesicles per ribbon, matching the number of vesicles contacting the plasma membrane at base of the ribbon (Bartoletti et al., 2010). With strong maintained stimulation, a second releasable pool of ∼90 vesicles is depleted with a time constant of ∼400 ms (Innocenti and Heidelberger, 2008; Bartoletti et al., 2010). This reserve pool matches the number of vesicles tethered to the remainder of the ribbon. Consistent with previous results (Bartoletti et al., 2010), the present study yielded a total (readily releasable plus reserve) pool of ∼115 vesicles per ribbon. After depleting the readily releasable and reserve pools, the cone synapse can maintain release indefinitely by accessing the resting pool. Our results support the hypothesis that sustained release evoked by maintained depolarization is limited by the rate of vesicle replenishment. We further show that the replenishment rate, and thus the rate of sustained release, exhibits a voltage dependence conferred largely by a Ca2+ dependence of replenishment.
The evidence for Ca2+ dependence of replenishment includes the following results: (1) matching the amount of Ca2+ influx during steps to different test voltages yielded similar replenishment rates, (2) reducing Ca2+ influx by using a positive (+30 mV) test step to reduce Ca2+ driving force slowed replenishment, (3) photolytic unblocking of Ca2+ channels increased replenishment, and (4) release of caged Ca2+ increased replenishment. One mechanism by which an increase in Ca2+ influx might stimulate replenishment is expansion of the readily releasable pool of vesicles. Expansion of the readily releasable pool increases the number of release sites that can be replenished, and this can cause a linear increase in the rate of replenishment. We found that the size of the releasable pool increased by 20% when test pulse amplitude was increased from −30 mV (25 ms) to −10 mV (25 ms). However, this expansion of the releasable pool only accounts for a portion of the 55% increase in the rate of replenishment stimulated by an increase in pulse amplitude from −30 to −10 mV. The remaining portion reflects more direct actions of Ca2+ on mechanisms of replenishment. Consistent with this, replenishment rates increased with stimuli that enhanced Ca2+ influx but did not expand the readily releasable pool (Fig. 6).
Regulation of replenishment by intracellular Ca2+ levels has been found at other conventional and ribbon synapses (Mennerick and Matthews, 1996; Dittman and Regehr, 1998; Stevens and Wesseling, 1998; Wang and Kaczmarek, 1998; Gomis et al., 1999; Sakaba and Neher, 2001; Kuromi and Kidokoro, 2002, 2005; Singer and Diamond, 2006; Hosoi et al., 2007; Johnson et al., 2008; Sakaba, 2008). At the basket cell synapse in the cerebellum, acceleration of replenishment required high Ca2+ levels matching the high Ca2+ levels needed to stimulate exocytosis (Sakaba, 2008). At other synapses, replenishment is accelerated by much lower levels of Ca2+ than needed for release (Dittman and Regehr, 1998; Stevens and Wesseling, 1998; Wang and Kaczmarek, 1998). At the cone synapse, replenishment and release exhibit a similar Ca2+ dependence to one another, but both are stimulated by very low Ca2+ levels (Rieke and Schwartz, 1996; Thoreson et al., 2004; Sheng et al., 2007). Similar Ca2+ dependencies help these two processes remain in balance with one another. Along with the balance between endocytosis and exocytosis (Rieke and Schwartz, 1996), maintaining a balance between release and replenishment is essential for cones to maintain release for hour upon hour in dim light conditions.
Although release and replenishment at the cone synapse exhibit similar Ca2+ dependencies, effects of Ca2+ buffers indicate that these two processes involve spatially distinct sites. The finding that cone-driven EPSCs were not significantly diminished by the inclusion of 1 mm BAPTA in the cone patch pipette suggests that sites of vesicle release are close (<200 nm) to Ca2+ channels. By contrast, replenishment was significantly diminished by elevating EGTA from 0.5 to 5 mm, indicating that this process involves sites >200 nm from Ca2+ channels. In cone terminals, the synaptic ribbon, which is believed to tether the reserve pool of vesicles (LoGiudice et al., 2008), extends a few hundred nanometers into the cytoplasm (Sjostrand, 1958; Morgans, 2000). Thus, the effects of different Ca2+ buffers are consistent with the idea that the actions of on replenishment may involve sites along the ribbon.
After the initial test pulse had depleted the readily releasable pool, we often observed a quiescent period of release that persisted for a couple hundred milliseconds. During this quiescent period, subsequent pulses evoked little or no release (Fig. 2, inset). After this time, release recovered slightly, although EPSCs remained quite small throughout the remainder of the pulse train. We observed a similar brief quiescent period before the acceleration of release following elevation of Ca2+ levels by Ca2+ uncaging or photolytic disinhibition of nifedipine (Figs. 7, 9, insets). This brief quiescent period may reflect the ∼250 ms delay exhibited by docked vesicles in bipolar cells before they can fuse (Zenisek et al., 2000). Thus, Ca2+ may facilitate replenishment by accelerating the rate at which releasable vesicles dock at the base of the ribbon.
The proteins controlling replenishment and release have not been fully elucidated. At the calyx of Held, the primary Ca2+ sensor responsible for accelerating replenishment appears to be calmodulin (Sakaba and Neher, 2001), but the effects also involve calmodulin's interactions with other different proteins. One target of calmodulin is the GTP-binding protein, rab3A (Kim et al., 2002), which plays a role in regulating replenishment (Leenders et al., 2001). This is an appealing candidate for regulating replenishment at the cone synapse, since rab3A interacts with Rim2 proteins found along the ribbon (Fukuda, 2003; Dulubova et al., 2005; tom Dieck et al., 2005; Deguchi-Tawarada et al., 2006).
When cones are hyperpolarized in the presence of bright illumination, the readily releasable pool can be fully replenished. The depolarization of cones at light offset evokes a burst of release that is closely synchronized with Ca2+ channel openings (Rabl et al., 2005). With sustained release in continued darkness, the readily releasable pool is soon depleted and release rates become governed by replenishment (Jackman et al., 2009). The occurrence of Ca2+ channel openings in depolarized photoreceptors exhibits a Poisson distribution (Thoreson et al., 2000). If the sustained release of vesicles in darkness were tightly coupled to individual Ca2+ channel openings, the resulting Poisson release probability would impair the detection of small responses by the postsynaptic bipolar cell (Schein and Ahmad, 2006). One potential advantage of having replenishment control the rate of sustained release may be to make release more regular. Ca2+-dependent replenishment involves sites situated a few hundred nanometers from Ca2+ channels, allowing average Ca2+ from multiple channels to control release. This can reduce the noise from stochastic Ca2+ channel openings as well as allowing Ca2+ derived from other sources [e.g., CICR or store-operated channels (Cadetti et al., 2006; Szikra et al., 2008, 2009; Babai et al., 2010)] to regulate sustained release.
While Ca2+-dependent mechanisms of replenishment are common to many synapses, the cone ribbon synapse is unusual in that replenishment plays a more direct role in controlling sustained release rates (Jackman et al., 2009). At the cone ribbon synapse, regulation of replenishment by voltage-dependent changes in Ca2+ influx and pool size is thus not simply a way to maintain release for long periods of time but provides a mechanism for encoding light-evoked changes in membrane potential into changes in sustained release rates.
Footnotes
This work was supported by Research to Prevent Blindness, National Institutes of Health Grant EY10542, and a University of Nebraska Medical Center graduate student fellowship (T.M.B.).
References
- Adler EM, Augustine GJ, Duffy SN, Charlton MP. Alien intracellular calcium chelators attenuate neurotransmitter release at the squid giant synapse. J Neurosci. 1991;11:1496–1507. doi: 10.1523/JNEUROSCI.11-06-01496.1991. [DOI] [PMC free article] [PubMed] [Google Scholar]
- Babai N, Morgans CW, Thoreson WB. Calcium-induced calcium release contributes to synaptic release from mouse rod photoreceptors. Neuroscience. 2010;165:1447–1456. doi: 10.1016/j.neuroscience.2009.11.032. [DOI] [PMC free article] [PubMed] [Google Scholar]
- Bartoletti TM, Babai N, Thoreson WB. Vesicle pool size at the salamander cone ribbon synapse. J Neurophysiol. 2010;103:419–423. doi: 10.1152/jn.00718.2009. [DOI] [PMC free article] [PubMed] [Google Scholar]
- Cadetti L, Tranchina D, Thoreson WB. A comparison of release kinetics and glutamate receptor properties in shaping rod-cone differences in EPSC kinetics in the salamander retina. J Physiol. 2005;569:773–788. doi: 10.1113/jphysiol.2005.096545. [DOI] [PMC free article] [PubMed] [Google Scholar]
- Cadetti L, Bryson EJ, Ciccone CA, Rabl K, Thoreson WB. Calcium-induced calcium release in rod photoreceptor terminals boosts synaptic transmission during maintained depolarization. Eur J Neurosci. 2006;23:2983–2990. doi: 10.1111/j.1460-9568.2006.04845.x. [DOI] [PMC free article] [PubMed] [Google Scholar]
- Cadetti L, Bartoletti TM, Thoreson WB. Quantal mEPSCs and residual glutamate: how horizontal cell responses are shaped at the photoreceptor ribbon synapse. Eur J Neurosci. 2008;27:2575–2586. doi: 10.1111/j.1460-9568.2008.06226.x. [DOI] [PMC free article] [PubMed] [Google Scholar]
- Choi S-Y, Jackman S, Thoreson WB, Kramer RH. Light regulation of Ca2+ in the cone photoreceptor synaptic terminal. Vis Neurosci. 2008;25:693–700. doi: 10.1017/s0952523808080814. [DOI] [PMC free article] [PubMed] [Google Scholar]
- Deguchi-Tawarada M, Inoue E, Takao-Rikitsu E, Inoue M, Kitajima I, Ohtsuka T, Takai Y. Active zone protein CAST is a component of conventional and ribbon synapses in mouse retina. J Comp Neurol. 2006;495:480–496. doi: 10.1002/cne.20893. [DOI] [PubMed] [Google Scholar]
- DeVries SH. Exocytosed protons feedback to suppress the Ca2+ current in mammalian cone photoreceptors. Neuron. 2001;32:1107–1117. doi: 10.1016/s0896-6273(01)00535-9. [DOI] [PubMed] [Google Scholar]
- Dittman JS, Regehr WG. Calcium dependence and recovery kinetics of presynaptic depression at the climbing fiber to Purkinje cell synapse. J Neurosci. 1998;18:6147–6162. doi: 10.1523/JNEUROSCI.18-16-06147.1998. [DOI] [PMC free article] [PubMed] [Google Scholar]
- Dulubova I, Lou X, Lu J, Huryeva I, Alam A, Schneggenburger R, Südhof TC, Rizo J. A Munc13/RIM/Rab3 tripartite complex: from priming to plasticity? EMBO J. 2005;24:2839–2850. doi: 10.1038/sj.emboj.7600753. [DOI] [PMC free article] [PubMed] [Google Scholar]
- Duncan G, Rabl K, Gemp I, Heidelberger R, Thoreson WB. Quantitative analysis of synaptic release at the photoreceptor synapse. Biophys J. 2010;98:2102–2110. doi: 10.1016/j.bpj.2010.02.003. [DOI] [PMC free article] [PubMed] [Google Scholar]
- Fukuda M. Distinct rab binding specificity of Rim1, Rim2, rabphilin, and Noc2. identification of a critical determinant of Rab3A/Rab27A recognition by Rim2. J Biol Chem. 2003;278:15373–15380. doi: 10.1074/jbc.M212341200. [DOI] [PubMed] [Google Scholar]
- Gomis A, Burrone J, Lagnado L. Two actions of calcium regulate the supply of releasable vesicles at the ribbon synapse of retinal bipolar cells. J Neurosci. 1999;19:6309–6317. doi: 10.1523/JNEUROSCI.19-15-06309.1999. [DOI] [PMC free article] [PubMed] [Google Scholar]
- Hirasawa H, Kaneko A. pH changes in the invaginating synaptic cleft mediate feedback from horizontal cells to cone photoreceptors by modulating Ca2+ channels. J Gen Physiol. 2003;122:657–671. doi: 10.1085/jgp.200308863. [DOI] [PMC free article] [PubMed] [Google Scholar]
- Hosoi N, Arai I, Tachibana M. Group III metabotropic glutamate receptors and exocytosed protons inhibit L-type calcium currents in cones but not in rods. J Neurosci. 2005;25:4062–4072. doi: 10.1523/JNEUROSCI.2735-04.2005. [DOI] [PMC free article] [PubMed] [Google Scholar]
- Hosoi N, Sakaba T, Neher E. Quantitative analysis of calcium-dependent vesicle recruitment and its functional role at the calyx of held synapse. J Neurosci. 2007;27:14286–14298. doi: 10.1523/JNEUROSCI.4122-07.2007. [DOI] [PMC free article] [PubMed] [Google Scholar]
- Innocenti B, Heidelberger R. Mechanisms contributing to tonic release at the cone photoreceptor ribbon synapse. J Neurophysiol. 2008;99:25–36. doi: 10.1152/jn.00737.2007. [DOI] [PubMed] [Google Scholar]
- Jackman SL, Choi SY, Thoreson WB, Rabl K, Bartoletti TM, Kramer RH. Role of the synaptic ribbon in transmitting the cone light response. Nat Neurosci. 2009;12:303–310. doi: 10.1038/nn.2267. [DOI] [PMC free article] [PubMed] [Google Scholar]
- Johnson SL, Forge A, Knipper M, Münkner S, Marcotti W. Tonotopic variation in the calcium dependence of neurotransmitter release and vesicle pool replenishment at mammalian auditory ribbon synapses. J Neurosci. 2008;28:7670–7678. doi: 10.1523/JNEUROSCI.0785-08.2008. [DOI] [PMC free article] [PubMed] [Google Scholar]
- Kaplan JH, Ellis-Davies GC. Photolabile chelators for the rapid photorelease of divalent cations. Proc Natl Acad Sci U S A. 1988;85:6571–6575. doi: 10.1073/pnas.85.17.6571. [DOI] [PMC free article] [PubMed] [Google Scholar]
- Kawai F. Characterization of spontaneous excitatory synaptic currents in newt retinal bipolar cells. Neurosci Lett. 1999;271:49–52. doi: 10.1016/s0304-3940(99)00511-x. [DOI] [PubMed] [Google Scholar]
- Kim AR, Choi WH, Lee SR, Kim JS, Jeon CY, Kim JI, Kim J, Lee JY, Kim EG, Park JB. Phosphorylation of 46-kDa protein of synaptic vesicle membranes is stimulated by GTP and Ca2+/calmodulin. Exp Mol Med. 2002;34:434–443. doi: 10.1038/emm.2002.61. [DOI] [PubMed] [Google Scholar]
- Kuromi H, Kidokoro Y. Selective replenishment of two vesicle pools depends on the source of Ca2+ at the Drosophila synapse. Neuron. 2002;35:333–343. doi: 10.1016/s0896-6273(02)00777-8. [DOI] [PubMed] [Google Scholar]
- Kuromi H, Kidokoro Y. Exocytosis and endocytosis of synaptic vesicles and functional roles of vesicle pools: lessons from the Drosophila neuromuscular junction. Neuroscientist. 2005;11:138–147. doi: 10.1177/1073858404271679. [DOI] [PubMed] [Google Scholar]
- Leenders AG, Lopes da Silva FH, Ghijsen WE, Verhage M. Rab3a is involved in transport of synaptic vesicles to the active zone in mouse brain nerve terminals. Mol Biol Cell. 2001;12:3095–3102. doi: 10.1091/mbc.12.10.3095. [DOI] [PMC free article] [PubMed] [Google Scholar]
- Lev-Ram V, Miyakawa H, Lasser-Ross N, Ross WN. Calcium transients in cerebellar Purkinje neurons evoked by intracellular stimulation. J Neurophysiol. 1992;68:1167–1177. doi: 10.1152/jn.1992.68.4.1167. [DOI] [PubMed] [Google Scholar]
- LoGiudice L, Sterling P, Matthews G. Mobility and turnover of vesicles at the synaptic ribbon. J Neurosci. 2008;28:3150–3158. doi: 10.1523/JNEUROSCI.5753-07.2008. [DOI] [PMC free article] [PubMed] [Google Scholar]
- Maple BR, Gao F, Wu SM. Glutamate receptors differ in rod- and cone-dominated off-center bipolar cells. Neuroreport. 1999;10:3605–3610. doi: 10.1097/00001756-199911260-00026. [DOI] [PubMed] [Google Scholar]
- Mennerick S, Matthews G. Ultrafast exocytosis elicited by calcium current in synaptic terminals of retinal bipolar neurons. Neuron. 1996;17:1241–1249. doi: 10.1016/s0896-6273(00)80254-8. [DOI] [PubMed] [Google Scholar]
- Morgans CW. Neurotransmitter release at ribbon synapses in the retina. Immunol Cell Biol. 2000;78:442–446. doi: 10.1046/j.1440-1711.2000.00923.x. [DOI] [PubMed] [Google Scholar]
- Murata Y, Iwasaki H, Sasaki M, Inaba K, Okamura Y. Phosphoinositide phosphatase activity coupled to an intrinsic voltage sensor. Nature. 2005;435:1239–1243. doi: 10.1038/nature03650. [DOI] [PubMed] [Google Scholar]
- Nachman-Clewner M, St Jules R, Townes-Anderson E. L-type calcium channels in the photoreceptor ribbon synapse: localization and role in plasticity. J Comp Neurol. 1999;415:1–16. [PubMed] [Google Scholar]
- Naraghi M, Müller TH, Neher E. Two-dimensional determination of the cellular Ca2+ binding in bovine chromaffin cells. Biophys J. 1998;75:1635–1647. doi: 10.1016/S0006-3495(98)77606-4. [DOI] [PMC free article] [PubMed] [Google Scholar]
- Patneau DK, Vyklicky L, Jr, Mayer ML. Hippocampal neurons exhibit cyclothiazide-sensitive rapidly desensitizing responses to kainate. J Neurosci. 1993;13:3496–3509. doi: 10.1523/JNEUROSCI.13-08-03496.1993. [DOI] [PMC free article] [PubMed] [Google Scholar]
- Rabl K, Cadetti L, Thoreson WB. Kinetics of exocytosis is faster in cones than in rods. J Neurosci. 2005;25:4633–4640. doi: 10.1523/JNEUROSCI.4298-04.2005. [DOI] [PMC free article] [PubMed] [Google Scholar]
- Rabl K, Cadetti L, Thoreson WB. Paired-pulse depression at photoreceptor synapses. J Neurosci. 2006;26:2555–2563. doi: 10.1523/JNEUROSCI.3667-05.2006. [DOI] [PMC free article] [PubMed] [Google Scholar]
- Rieke F, Schwartz EA. Asynchronous transmitter release: control of exocytosis and endocytosis at the salamander rod synapse. J Physiol. 1996;493:1–8. doi: 10.1113/jphysiol.1996.sp021360. [DOI] [PMC free article] [PubMed] [Google Scholar]
- Roberts WM. Spatial calcium buffering in saccular hair cells. Nature. 1993;363:74–76. doi: 10.1038/363074a0. [DOI] [PubMed] [Google Scholar]
- Sakaba T. Two Ca(2+)-dependent steps controlling synaptic vesicle fusion and replenishment at the cerebellar basket cell terminal. Neuron. 2008;57:406–419. doi: 10.1016/j.neuron.2007.11.029. [DOI] [PubMed] [Google Scholar]
- Sakaba T, Neher E. Calmodulin mediates rapid recruitment of fast-releasing synaptic vesicles at a calyx-type synapse. Neuron. 2001;32:1119–1131. doi: 10.1016/s0896-6273(01)00543-8. [DOI] [PubMed] [Google Scholar]
- Sakaba T, Schneggenburger R, Neher E. Estimation of quantal parameters at the calyx of held synapse. Neurosci Res. 2002;44:343–356. doi: 10.1016/s0168-0102(02)00174-8. [DOI] [PubMed] [Google Scholar]
- Sanguinetti MC, Kass RS. Voltage-dependent block of calcium channel current in the calf cardiac Purkinje fiber by dihydropyridine calcium channel antagonists. Circ Res. 1984;55:336–348. doi: 10.1161/01.res.55.3.336. [DOI] [PubMed] [Google Scholar]
- Schein S, Ahmad KM. Efficiency of synaptic transmission of single-photon events from rod photoreceptor to rod bipolar dendrite. Biophys J. 2006;91:3257–3267. doi: 10.1529/biophysj.106.091744. [DOI] [PMC free article] [PubMed] [Google Scholar]
- Schneggenburger R, Meyer AC, Neher E. Released fraction and total size of a pool of immediately available transmitter quanta at a calyx synapse. Neuron. 1999;23:399–409. doi: 10.1016/s0896-6273(00)80789-8. [DOI] [PubMed] [Google Scholar]
- Schneggenburger R, Sakaba T, Neher E. Vesicle pools and short-term synaptic depression: lessons from a large synapse. Trends Neurosci. 2002;25:206–212. doi: 10.1016/s0166-2236(02)02139-2. [DOI] [PubMed] [Google Scholar]
- Sheng Z, Choi SY, Dharia A, Li J, Sterling P, Kramer RH. Synaptic Ca2+ in darkness is lower in rods than cones, causing slower tonic release of vesicles. J Neurosci. 2007;27:5033–5042. doi: 10.1523/JNEUROSCI.5386-06.2007. [DOI] [PMC free article] [PubMed] [Google Scholar]
- Singer JH, Diamond JS. Vesicle depletion and synaptic depression at a mammalian ribbon synapse. J Neurophysiol. 2006;95:3191–3198. doi: 10.1152/jn.01309.2005. [DOI] [PubMed] [Google Scholar]
- Sjostrand FS. Ultrastructure of retinal rod synapses of the guinea pig eye as revealed by three-dimensional reconstructions from serial sections. J Ultrastruct Res. 1958;2:122–170. doi: 10.1016/s0022-5320(58)90050-9. [DOI] [PubMed] [Google Scholar]
- Steele EC, Jr, Chen X, Iuvone PM, MacLeish PR. Imaging of Ca2+ dynamics within the presynaptic terminals of salamander rod photoreceptors. J Neurophysiol. 2005;94:4544–4553. doi: 10.1152/jn.01193.2004. [DOI] [PubMed] [Google Scholar]
- Stevens CF, Wesseling JF. Activity-dependent modulation of the rate at which synaptic vesicles become available to undergo exocytosis. Neuron. 1998;21:415–424. doi: 10.1016/s0896-6273(00)80550-4. [DOI] [PubMed] [Google Scholar]
- Szikra T, Krizaj D. The dynamic range and domain-specific signals of intracellular calcium in photoreceptors. Neuroscience. 2006;141:143–155. doi: 10.1016/j.neuroscience.2006.03.054. [DOI] [PMC free article] [PubMed] [Google Scholar]
- Szikra T, Cusato K, Thoreson WB, Barabas P, Bartoletti TM, Krizaj D. Depletion of calcium stores regulates calcium influx and signal transmission in rod photoreceptors. J Physiol. 2008;586:4859–4875. doi: 10.1113/jphysiol.2008.160051. [DOI] [PMC free article] [PubMed] [Google Scholar]
- Szikra T, Barabas P, Bartoletti TM, Huang W, Akopian A, Thoreson WB, Krizaj D. Calcium homeostasis and cone signaling are regulated by interactions between calcium stores and plasma membrane ion channels. PLoS One. 2009;4:e6723. doi: 10.1371/journal.pone.0006723. [DOI] [PMC free article] [PubMed] [Google Scholar]
- Thoreson WB, Nitzan R, Miller RF. Reducing extracellular Cl− suppresses dihydropyridine-sensitive Ca2+ currents and synaptic transmission in amphibian photoreceptors. J Neurophysiol. 1997;77:2175–2190. doi: 10.1152/jn.1997.77.4.2175. [DOI] [PubMed] [Google Scholar]
- Thoreson WB, Nitzan R, Miller RF. Chloride efflux inhibits single calcium channel open probability in vertebrate photoreceptors: chloride imaging and cell-attached patch-clamp recordings. Vis Neurosci. 2000;17:197–206. doi: 10.1017/s0952523800172025. [DOI] [PubMed] [Google Scholar]
- Thoreson WB, Rabl K, Townes-Anderson E, Heidelberger R. A highly Ca2+-sensitive pool of vesicles contributes to linearity at the rod photoreceptor ribbon synapse. Neuron. 2004;42:595–605. doi: 10.1016/s0896-6273(04)00254-5. [DOI] [PMC free article] [PubMed] [Google Scholar]
- tom Dieck S, Altrock WD, Kessels MM, Qualmann B, Regus H, Brauner D, Fejtová A, Bracko O, Gundelfinger ED, Brandstätter JH. Molecular dissection of the photoreceptor ribbon synapse: physical interaction of bassoon and RIBEYE is essential for the assembly of the ribbon complex. J Cell Biol. 2005;168:825–836. doi: 10.1083/jcb.200408157. [DOI] [PMC free article] [PubMed] [Google Scholar]
- Tsien RY. New calcium indicators and buffers with high selectivity against magnesium and protons: design, synthesis, and properties of prototype structures. Biochemistry. 1980;19:2396–2404. doi: 10.1021/bi00552a018. [DOI] [PubMed] [Google Scholar]
- Wang LY, Kaczmarek LK. High-frequency firing helps replenish the readily releasable pool of synaptic vesicles. Nature. 1998;394:384–388. doi: 10.1038/28645. [DOI] [PubMed] [Google Scholar]
- Wilkinson MF, Barnes S. The dihydropyridine-sensitive calcium channel subtype in cone photoreceptors. J Gen Physiol. 1996;107:621–630. doi: 10.1085/jgp.107.5.621. [DOI] [PMC free article] [PubMed] [Google Scholar]
- Xu JW, Slaughter MM. Large-conductance calcium-activated potassium channels facilitate transmitter release in salamander rod synapse. J Neurosci. 2005;25:7660–7668. doi: 10.1523/JNEUROSCI.1572-05.2005. [DOI] [PMC free article] [PubMed] [Google Scholar]
- Yamada KA, Tang CM. Benzothiadiazides inhibit rapid glutamate receptor desensitization and enhance glutamatergic synaptic currents. J Neurosci. 1993;13:3904–3915. doi: 10.1523/JNEUROSCI.13-09-03904.1993. [DOI] [PMC free article] [PubMed] [Google Scholar]
- Zenisek D, Steyer JA, Almers W. Transport, capture and exocytosis of single synaptic vesicles at active zones. Nature. 2000;406:849–854. doi: 10.1038/35022500. [DOI] [PubMed] [Google Scholar]