Abstract
Deep brain stimulation (DBS) is an established therapy for the treatment of a wide range of neurological disorders. Historically, DBS and other neurostimulation technologies have relied on rectangular stimulation waveforms to impose their effects on the nervous system. Recent work has suggested that non-rectangular waveforms may have advantages over the traditional rectangular pulse. Therefore, we used detailed computer models to compare a range of charge-balanced biphasic waveforms with rectangular, exponential, triangular, Gaussian, and sinusoidal stimulus pulse shapes. We explored the neural activation energy of these waveforms in both intracellular and extracellular stimulation. In the context of extracellular stimulation, we compared their effects on both axonal fibers of passage and projection neurons. Finally, we evaluated the impact of delivering the waveforms through a clinical DBS electrode, as opposed to a theoretical point source. Our results suggest that DBS with a 1 ms centered-triangular pulse can decrease energy consumption by 64 % when compared to the standard 100 μs rectangular pulse (energy cost of 48 nJ and 133 nJ, respectively, to stimulate 50 % of a distributed population of axons) and can decrease energy consumption by 10 % when compared to the most energy efficient rectangular pulse (1.25 ms duration). In turn, there may be measureable energy savings when using appropriately designed non-rectangular pulses in clinical DBS applications, thereby warranting further experimental investigation.
Introduction
Neurostimulation is an established method of modulating pathologic neural systems, with numerous clinical applications. For example, deep brain stimulation (DBS) is a widely used treatment for movement disorders, and is garnering evidence for treating psychiatric disorders (Hardesty and Sackeim, 2007). Functional electrical stimulation (FES) can improve the quality of life for people with debilitating diseases such as stroke, spinal cord injury and multiple sclerosis (Peckham and Knutson, 2005). Vagal nerve stimulation (VNS) has demonstrated anticonvulsant effects in epileptic patients (Groves and Brown, 2005). Spinal cord stimulation (SCS) has given relief to numerous patients suffering from chronic pain (Turner et al., 2004). Cochlear stimulation has given the sense of sound to people who were profoundly deaf (Shepherd and McCreery, 2006). These treatment modalities all utilize rectangular stimulus waveforms. Although these waveforms have proven themselves with decades of clinical utility, there are numerous non-rectangular waveforms that may be advantageous for neuromodulation devices.
The principal criterion for selecting a stimulus waveform is that it enables generation of the appropriate neural response to stimulation (i.e. elicits action potentials that subsequently result in the controlled release of neurotransmitter), with minimal risk of stimulation induced tissue damage, and minimal energy requirements. Numerous approaches have been investigated to optimize the stimulation waveform, such as decreasing stimulation induced tissue damage (Lilly et al., 1955), increasing charge injection (Sahin and Tie, 2007; Cogan et al., 2006), and decreasing the energy requirements of stimulation (Jezernik and Morari, 2005; Jezernik et al., 2010; Wongsarnpigoon et al., 2010; Wongsarnpigoon and Grill, 2010). Most of today's clinical neural stimulators implement symmetric, charge-balanced waveforms with a high-amplitude, short-duration stimulation phase followed by a low-amplitude, long-duration recharge phase.
While the functional impact of neurostimulation should be effectively independent of the stimulus waveform, the motivation for using a non-rectangular waveform is rooted in the potential for 1) increasing battery lifetime, 2) increasing time between charges (for rechargeable devices), and 3) decreasing the volume of the implanted stimulator. In the case of DBS, factors that influence battery lifetime include anatomical location of electrode implantation (Voges et al., 2002), polarity of stimulation, peak voltage, pulse width, and stimulation frequency (Ranck, 1975; Tehovnik, 1996; Rizzone et al., 2001; McIntyre et al., 2004; Miocinovic et al., 2006). The stimulation settings are adjusted to fit the specifics of each patient and their corresponding disease. These variables interact to define battery life, clinical benefit, and side effect profile. The average lifetime of non-rechargeable implanted stimulators varies; in the case of Parkinson's disease, it has been reported to be 3.8, 6.9, and 3.1 years (Bin-Mahfoodh et al., 2003; Anheim et al., 2007; Ondo et al., 2007), in which the stimulator lifetime demonstrated a strong correlation with total electrical energy. Therefore, the goal of this study is to investigate potential energy savings through the use of novel stimulus waveforms.
Non-rectangular waveforms have previously demonstrated the ability to activate neurons in model systems with decreased energy consumption. In an analytical nerve membrane model, the optimal waveform was found to be an exponentially rising waveform (Jezernik and Morari, 2005; Jezernik et al., 2010). This waveform has also demonstrated decreased energy consumption in vivo (Klafter and Hrebien, 1976). In a simulated membrane patch model, rectangular, sinusoidal, Gaussian and exponentially increasing waveforms all demonstrated reduced energy requirements, depending on the stimulation pulse width under consideration (Sahin and Tie, 2007). Recently, a genetic algorithm was developed which concluded a waveform similar to a Gaussian was optimal for peripheral nerve stimulation (Wongsarnpigoon and Grill, 2010). While results from these various studies have all concluded that non-rectangular pulses have advantages over rectangular pulses, the specific details of the “optimal pulse” and its direct applicability to specific clinical neurostimulation devices has been less clear. Therefore, we attempted to extend upon this previous work and focus our analysis on DBS.
We compared intracellular, extracellular point source stimulation and extracellular stimulation with a finite element model (FEM) of DBS using a wide range of previously described non-rectangular stimulus pulses. We also included a centered triangular waveform that has not been discussed in previous studies. The threshold for activation was determined for 2500 myelinated fibers of passage, divided into 50 equal populations, and 2500 projection neurons, divided into 50 equal populations. While energy efficiency is the engineering goal, stimulation waveforms must also limit the risk of tissue damage. Therefore, we investigated the charge related safety constraints on energy efficient waveforms, demonstrating increased energy efficiency without injurious charge injection (Shannon, 1992). Further, capacitance of the bulk tissue medium impacts the shape of the stimulus waveform transmitted to the neurons (Butson and McIntyre, 2005), and we evaluated its effect on the energy threshold for the different waveforms. The outcome of our analysis is a theoretical prediction of a stimulus waveform specifically optimized for DBS, and a methodological process for subsequent optimization in other clinical neurostimulation applications. Preliminary portions of this work have been presented in abstract form (Foutz et al., 2008; Foutz and McIntyre, 2009).
Methods
Stimulation waveforms
Clinical neurostimulation devices typically use charge-balanced, biphasic, rectangular stimulus waveforms. Each stimulation period is composed of three variable phases: a stimulus pulse, an interphase interval, and a recharge pulse. The goal of this study was to evaluate the potential energy savings of non-rectangular stimulus pulses relative to the clinical standard (Figure 1). Traditional nomenclature defines the pulse width as the duration of the stimulus pulse. When considering non-rectangular pulses, the definition of pulse width becomes less clear, and can skew the interpretation of results. We defined the pulse width of each waveform by the duration of time in which the amplitude is greater than half its peak amplitude (HPA). The waveforms were constructed such that the interphase interval lasted 0.1 ms, followed by a 5.0 ms passive-recharge phase, which coincides with 136 Hz stimulation using modern DBS devices (Butson and McIntyre, 2007). The amplitude of the recharge phase was scaled to charge balance the stimulus phase. For example, a 100 μs rectangular pulse with amplitude -1 mA creates 0.1 μC of charge, requiring a 5 ms recharge pulse of 0.02 mA. We consider the 100 μs rectangular stimulus pulse as the “gold standard” for neurostimulation devices. Therefore, throughout the paper we present comparisons to this stimulus pulse.
Figure 1.
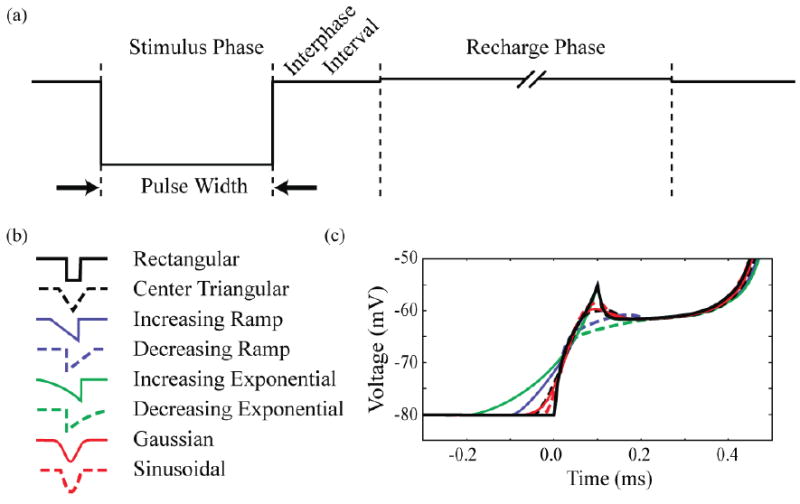
Stimulus waveforms. (a) Rectangular cathodic waveform with labeled phases. The cathodic stimulus pulse is followed by a zero current interphase interval of 0.1 ms, and then by an anodic recharge phase of 5 ms. (b) Cathodic stimulus pulse of the waveforms investigated. The non-rectangular pulses were defined such that their pulse width matched the corresponding rectangular pulse width at 50 % their peak amplitude. (c) Transmembrane voltage response of an axon node to a threshold stimulus using each waveform.
We evaluated 8 different stimulus pulse designs (Figure 1). The fundamental pulse shapes were rectangular, triangular (centered and ramp), exponential, Gaussian, or sinusoidal in nature. Waveforms were investigated at pulse widths ranging from 50 μs to 2 ms, though only those in the range 50 μs to 1.2 ms are displayed in the figures. Waveforms were aligned at HPA, with the interphase interval beginning at the second HPA of the stimulus pulse. Due to this method of normalization, waveforms with equal amplitude do not necessarily inject equal amounts of charge, or equal amounts of energy.
Stimulation Models
We examined three different conditions of constant-current stimulation: 1) intracellular electrode, 2) extracellular point-source electrode, and 3) extracellular DBS electrode. Intracellular stimulation was simulated by inserting a current clamp into the central node of a myelinated axon (see Neuron Models below). Extracellular point-source stimulation generated an extracellular voltage distribution (Ve) (Figure 2a) defined by the equation:
Figure 2.
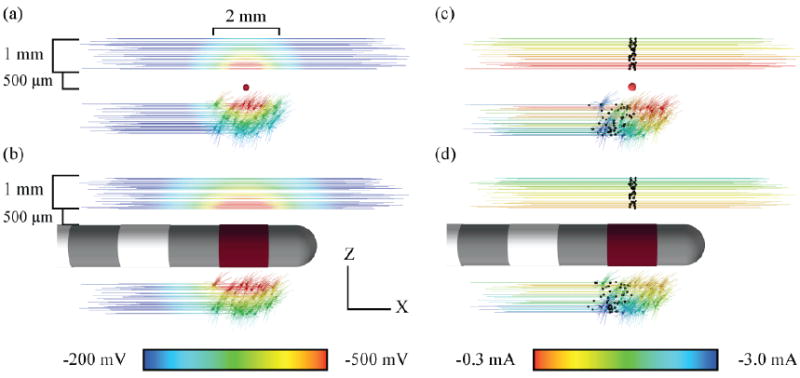
Extracellular membrane voltage during -1 mA stimulation with a (a) point-source electrode and (b) human DBS electrode. Seed points for neuron placement relative to the electrode were randomly distributed 2 mm along the x-axis, and 1 mm along y (perpendicular to the page) and z-axes. Current amplitude thresholds for action potential initiation with a (c) point-source electrode and (d) human DBS electrode. Stimulation with 100 μs duration rectangular waveforms. Neuron color represents the threshold for activation. Black markers indicate node of action potential initiation.
| (1) |
where r was the distance from each compartment to the point source, I was the amplitude during stimulation, and σ (0.2 S/m) was the bulk tissue conductivity.
DBS was simulated with an electrostatic, axisymmetric finite element model (FEM) (Butson and McIntyre, 2005) (COMSOL, Burlington, MA) (Figure 2b). The DBS electrode was based on the Medtronic model 3387 (Minneapolis, MN). Current-controlled stimulation was delivered through the contact closest to the tip of the electrode (contact 0) and transmitted through a homogeneous isotropic tissue medium (σ = 0.2 S/m). The model boundaries were 5 cm from the active contact and set to ground. FEM had a variable resolution mesh with 16,726 mesh triangles that increased in size with increasing distance from the active electrode contact.
Neuron Models
We simulated the response of both fibers of passage and local projection neurons to stimulation. In both cases, the axons were modeled with a myelinated, concentric, double-cable structure, with a 2 μm outer diameter (McIntyre et al., 2002). The projection neuron included a soma-dendritic architecture derived from a 3D reconstruction of a primate subthalamic nucleus (STN) neuron (Sato et al., 2000; Miocinovic et al., 2006). The 3D models were implemented in NEURON v7.2 (Carnevale and Hines, 2006) using backward-Euler implicit integration, with a multi-order variable-time step (absolute tolerance of 0.1%). The axons of the projection neurons consisted of 21 nodes of Ranvier, and were 4 mm in total length. Fibers of passage had 41 nodes, and were 8 mm in length (Figure 2). The geometrical parameters of the axon model are listed in Table 1.
Table 1.
Axon model geometric parameters.
| Fiber diameter | 2 μm |
| Number of myelin lamella | 30 |
| Node length | 1 μm |
| Node diameter | 1.4 μm |
| MYSA length | 3 μm |
| MYSA diameter | 1.4 μm |
| MYSA periaxonal space width | 0.002 μm |
| FLUT length | 10 μm |
| FLUT diameter | 1.6 μm |
| FLUT periaxonal space width | 0.004 μm |
| STIN length | 57.7 μm |
| STIN diameter | 1.6 μm |
| STIN periaxonal space width | 0.004 μm |
Each neuron model had a resting potential of -75 mV and simulations were conducted at 37° C. The myelinated axons of the neuron models consisted of active nonlinear deterministic membrane dynamics (McIntyre et al., 2002). The nodes of Ranvier had sodium, potassium, and leakage currents in parallel with the membrane capacitance (Table 2). The soma-dendritic compartments of the projection neurons were passive (i.e. linear leakage conductance in parallel with a membrane capacitance), as were the terminating node(s) of Ranvier in all models. The simplifying assumption of using passive membrane properties for the soma-dendritic compartments of the STN projection neurons was employed for two reasons. First, action potential initiation during extracellular stimulation of projection neurons occurs in the axon (Nowak and Bullier, 1998a, b; McIntyre and Grill, 1999; Miocinovic et al., 2006). Second, STN neurons “at rest” are tonically active, causing the extracellular activation threshold to be time dependent (i.e. relative to the ongoing intrinsic activity). Therefore, our simplifying assumption permits the quantification of the specific effects of stimulus waveform shape on action potential initiation, without the interference of spontaneous STN activity originating from its cell body.
Table 2.
Axon model electrical parameters.
| Internode parameters | |
| Myelin conductance (gmy) | 0.001 S/cm2 |
| Myelin capacitance (Cmy) | 0.1 μF/cm2 |
| MYSA leakage conductance (gLeak) | 0.0001 S/cm2 |
| FLUT leakage conductance (gLeak) | 0.0001 S/cm2 |
| FLUT fast K+ conductance (gKf) | 0.01 S/cm2 |
| STIN leakage conductance (gLeak) | 0.0001 S/cm2 |
| Membrane capacitance (Ci) | 2 μF/cm |
| Node parameters | |
| Max. fast Na+ conductance (gNaf) | 3.0 S/cm2 |
| Max. persistent Na+ conductance (gNap) | 0.01 S/cm2 |
| Max. slow K+ conductance (gKs) | 0.08 S/cm2 |
| Leakage conductance (gLeak) | 0.007 S/cm2 |
| Membrane capacitance (Ci) | 2 μF/cm2 |
Neuron Distributions
Fifty populations of fifty cells were created for each cell type. The central node was used as a seed point for fibers of passage, while the soma was used for projection neurons. Seed points were randomly distributed relative to the extracellular electrode in a volume which was 2 mm long in the z-axis (longitudinal), and 1 mm wide along the x and y-axes. The center of random distribution was set to be 1 mm from the point-source electrode, and 1 mm from the surface of the DBS electrode; +1 mm in the z-direction for fibers, and -1 mm for projection neurons (Figure 2). The seed points were 1.2 ± 0.28 mm distant to the point-source electrode, and 1.0 ± 0.29 mm distant to the surface of the active DBS contact (mean ± SD).
Determination of Threshold
Neurons were stimulated individually, with each waveform shape and pulse width. Each trial was run for 40 ms, and the threshold amplitude was determined using a binary search algorithm to an accuracy of 1 %. Supra-threshold stimulus amplitudes were defined by the induction of an action potential that propagated to the penultimate node(s). Action potentials were defined by the transmembrane potential crossing 0 mV (Figure 2cd). The current, charge and energy required to activate 50 % of the cells in each population was computed, and then used to calculate the mean and standard error across all populations.
Energy and Charge Calculation
Energy and charge requirements were determined for each waveform and pulse width using the threshold amplitude. The energy (E) of each cathodic stimulus was determined by integration of the instantaneous power:
| (2) |
where Tc is the duration of the cathodic phase, I(t) is the instantaneous current, and Z(t) is the impedance (assumed constant: 1 kΩ). We assumed a passive anodic recharge phase; therefore, stimulus energy was only calculated for the cathodic phase. We determined the charge injected during stimulus (Q) by integrating the current over the cathodic phase:
| (3) |
Goal Function
Waveform optimization must take into account both the energy savings and the charge injected. The lifetime of implantable pulse generators (IPGs) has demonstrated linear correlation with energy consumption (Anheim et al., 2007). Though batteries are rated in mA·h, this rating is for a nearly constant voltage, and is therefore an estimate of energy (E=I·V·t). This implies that the battery lifetime (t) may be extended by lowering the power cost (I·V). On the other hand, increased charge injection has been shown to correlate with tissue injury (McCreery et al., 1990; Shannon, 1992). Since both battery lifetime and stimulus safety are important factors in stimulator design, we created a goal function that seeks to minimize energy with “safe” levels of charge injection. The limit for charge injection was determined by Shannon's equation:
| (4) |
where k = 1.5, A = 5.98 mm2 (Medtronic 3387 electrode contact surface area), and Q is the limit for safe charge injection (1.38 μC). The relationship between optimal pulse width, charge and energy was characterized by stimulating a single fiber of passage with a DBS electrode at distances ranging from 0.1 mm to 3.0 mm (0.1 mm increments). The center of the active electrode contact was aligned with the fiber's central node. Optimal pulse width was determined iteratively with the goal of minimizing energy injection. Further, a charge injection limitation of 1.38 μC was added to demonstrate its effect on the optimal pulse width, and ultimately on the energy requirement for stimulation.
Tissue Capacitance
In a subset of DBS simulations, the effects of bulk tissue capacitance were incorporated to determine their impact on waveform shape and energy threshold. Tissue capacitance was modeled as a low-pass RC-circuit, with time constants of 0.3, 3 and 30 μs (Butson and McIntyre, 2005). Waveforms were passed through this filter, and the results were scaled by the extracellular voltage solution at each neural compartment.
Results
Intracellular stimulation demonstrated marked changes in charge and energy requirements when using non-rectangular waveforms. Increases in charge consumption were seen with non-rectangular waveforms at all pulse widths (Figure 3); however, sinusoidal waveforms had the smallest increases over conventional stimulation. All waveforms demonstrated monotonically increasing charge requirements with longer pulse widths. Energy requirements initially dropped as pulse-widths were increased, until they reached a minimum value, at which point they began to increase. The pulse-width corresponding to this minimum energy threshold varied for each waveform, ranging from 250 μs (exponentially increasing), to 500 μs (rectangular). At short pulse-widths (< 200 μs), all non-rectangular waveforms were more energy efficient than equal pulse-width rectangular waveforms. When considering all pulse-widths tested, the 500 μs centered triangular waveform minimized energy (Figure 3, dashed black). The standard 100 μs, rectangular waveform required 12.4×10⁻¹² nJ and 0.017 pC, and was minimized at a pulse width of 500 μs (8.8×10⁻¹² nJ and 0.033 pC). The energy-efficient, 500 μs centered triangular waveform required 7.8×10⁻¹² nJ and 0.038 pC, demonstrating a maximal energy savings of 37 % from the standard 100 μs rectangular stimulus pulse. Likewise, it had an energy savings of 10.8 % from the most energy efficient rectangular stimulation (increases in charge consumption 117 % and 16 %, respectively).
Figure 3.
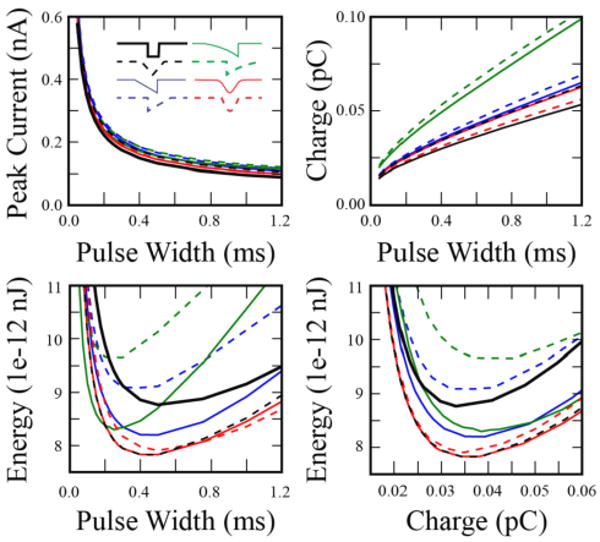
Comparison of charge and energy required to intracellularly activate a single myelinated axon. Current was injected into the central node of Ranvier via a simulated current clamp using 8 different waveforms (inset). Upper left: Strength-duration curve. Upper Right: Charge required for activation. Lower left: Energy required for activation. Lower right: Energy versus charge thresholds. Gaussian and centered triangular waveforms demonstrate minimal energy thresholds, and have significant overlap.
When considering extracellular stimulation with a point-source electrode we observed trends similar to those seen in intracellular stimulation. For both fibers of passage and projection neurons, rectangular pulses minimized charge injection, while non-rectangular pulses minimized energy consumption (Figure 4). The average energy requirement to activate 50 % of the fibers of passage with a 100 μs rectangular pulse was 49 ± 1.9 nJ, with a corresponding charge injection of 70 ± 1.4 nC (mean ± SE). However, the minimum energy cost (23 ± 0.8 nJ) was achieved with the Gaussian waveform at a pulse width of 750 μs. This waveform resulted in a 54 % energy savings over conventional stimulation (128% charge increase), and 11 % savings over the optimal rectangular waveform (1 ms pulse width; 0.2 % charge savings). The centered-triangular waveform had nearly identical energy savings performance to the Gaussian waveform. The presence of soma-dendritic compartments had the effect of substantially increasing threshold amplitude and decreasing the pulse width for energy optimum. The Gaussian and centered-triangular waveforms (225 μs pulse width) demonstrated the largest energy savings over conventional stimulation (29 %) and over the energy-optimal rectangular waveform (275 μs pulse width, 12.5 % energy savings) (Figure 4).
Figure 4.
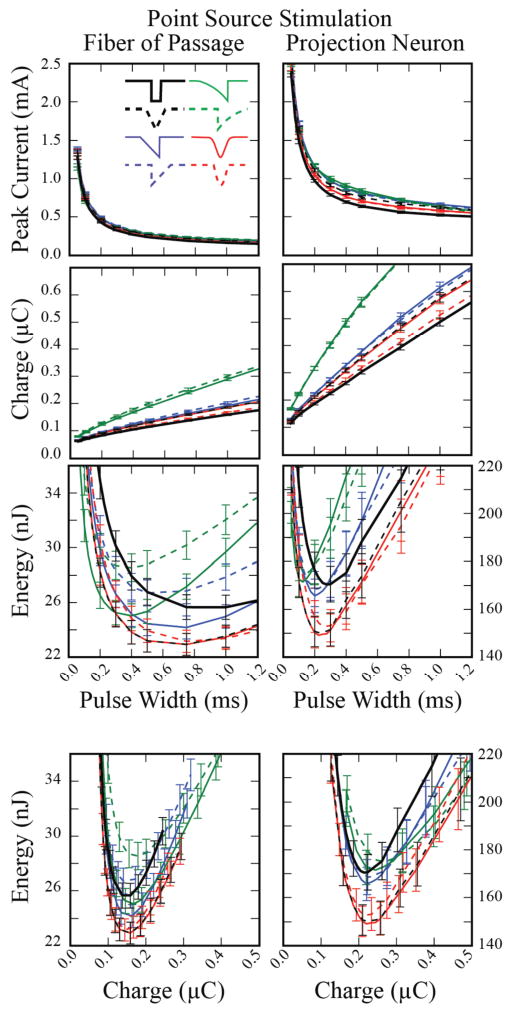
Peak current, charge and energy required to activate 25 of 50 neurons, averaged across 50 populations, using an extracellular point-source electrode. Error bars represent the standard error.
When DBS electrodes were used to deliver the stimulus, rectangular pulses continued to minimize charge injection, while non-rectangular pulses achieved lower energy consumption (Figure 5). The energy requirement to activate 50 % of the populations of fibers of passage with a 100 μs rectangular pulse was 133 ± 3.3 nJ, at a charge injection of 115 ± 10 nC. However, the minimum energy cost (48 ± 1.1 nJ) was achieved with the centered-triangular waveform at a pulse width of 1 ms, representing a 64 % energy savings over conventional waveforms, and a 10 % savings over the energy-optimal rectangular waveform (1.25 ms pulse width; charge increase of 132 % and 3.8 %, respectively). Similar trends were observed for activation of projection neurons, but with substantially higher amplitude, charge injection, and energy requirements. For activation of projection neurons, a Gaussian waveform (400 μs pulse width) demonstrated the largest energy savings over conventional stimulation (39 %) and over the energy-optimal rectangular waveform (500 μs pulse width, 12.5 % energy savings) (Figure 5).
Figure 5.
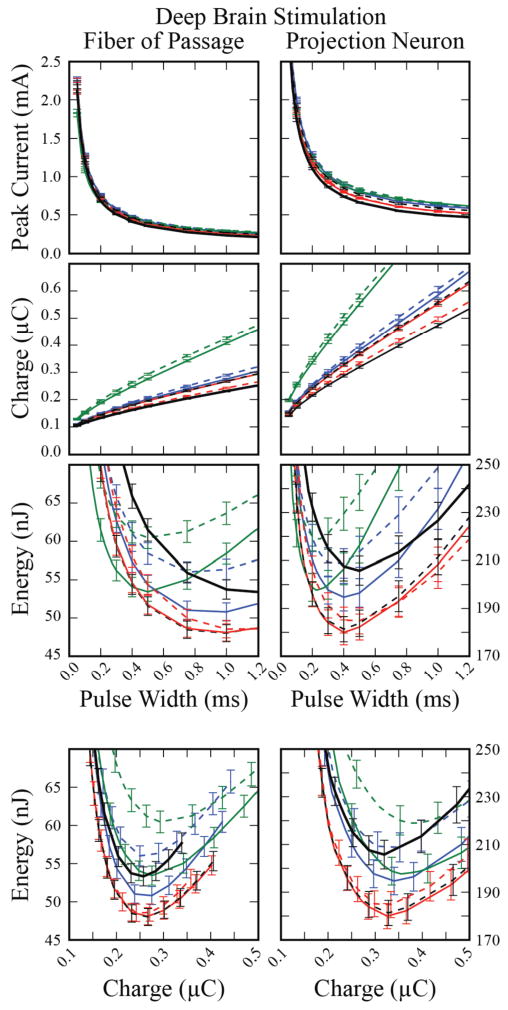
Peak current, charge and energy required to activate 25 of 50 neurons, averaged across 50 populations, using a DBS electrode. Error bars represent the standard error.
We created energy recruitment curves to compare activation of fibers with the waveforms that were the most energy efficient to activate 50 % of the neural population using a DBS electrode. These were the 1-ms duration Gaussian and centered-triangular waveforms. We compared them with the most energy-efficient rectangular waveform, which had a pulse duration of 1.25 ms. The energy-optimal Gaussian and centered-triangular recruited 26 %, 50 % and 76 % of the fibers with energy savings of 63 %, 64 % and 65 %, respectively, compared to conventional stimulation. When compared to optimal rectangular waveform stimulation, savings were consistently ∼10 %. We also determined that the general trend of energy savings with these waveforms was present at a range of fiber diameters (2 μm – 10 μm, data only shown for 2 and 5.7 μm) (Figure 6).
Figure 6.
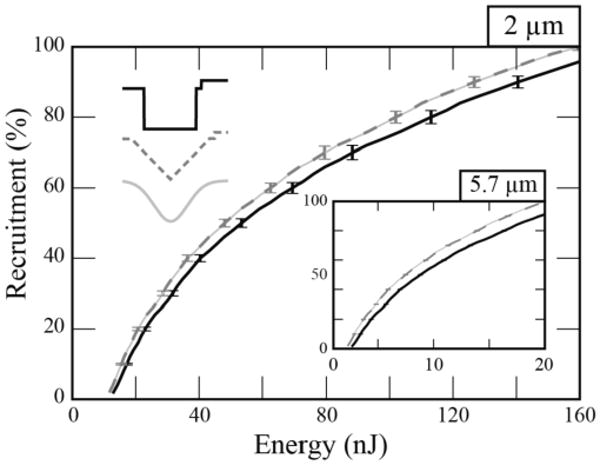
Energy recruitment curves. Stimulus energy required to activate 2 μm diameter fibers of passage with 1.25-ms rectangular, 1-ms centered-triangular and 1-ms Gaussian waveforms. In the inset, activation of 5.7 μm diameter fibers of passage demonstrated a global decrease in the energy required for recruitment relative to the 2.0 μm diameter fibers while still exhibiting a lower relative energy threshold with triangular and Gaussian waveforms. Error bars represent the standard error.
A number of non-rectangular waveforms demonstrate pronounced energy savings over conventional rectangular waveforms. However, energy savings come at the cost of larger levels of charge injection, which could damage both the tissue and the electrode. Therefore, we investigated the impact on waveform shape when constraining the stimulus to “safe” levels of charge injection (≤ 1.38 μC for the DBS electrode). At 2.5 mm distant from the surface of the DBS electrode, charge limitations began to affect the optimal pulse width for rectangular, Gaussian and centered-triangular waveforms (Figure 7). Due to the decreased charge requirements of short pulse width waveforms (see figures 3-5), the charge limitation favored shorter pulse widths, with resultant increases in energy requirements. Therefore, the rate of energy consumption increased rapidly when constraining charge injection. The furthest safe stimulation with rectangular, Gaussian and centered-triangular waveforms was at 3.1, 3.1 and 3.0 mm. Charge limits were reached at 2.5, 2.4 and 2.4 mm with pulse widths of 1.5, 1.2 and 1.2 μs, respectively. Energy savings for both Gaussian and centered-triangular waveforms, compared to optimal rectangular waveforms, were consistently ∼10 % at distances ranging from 0.5 – 3.0 mm (Figure 7).
Figure 7.
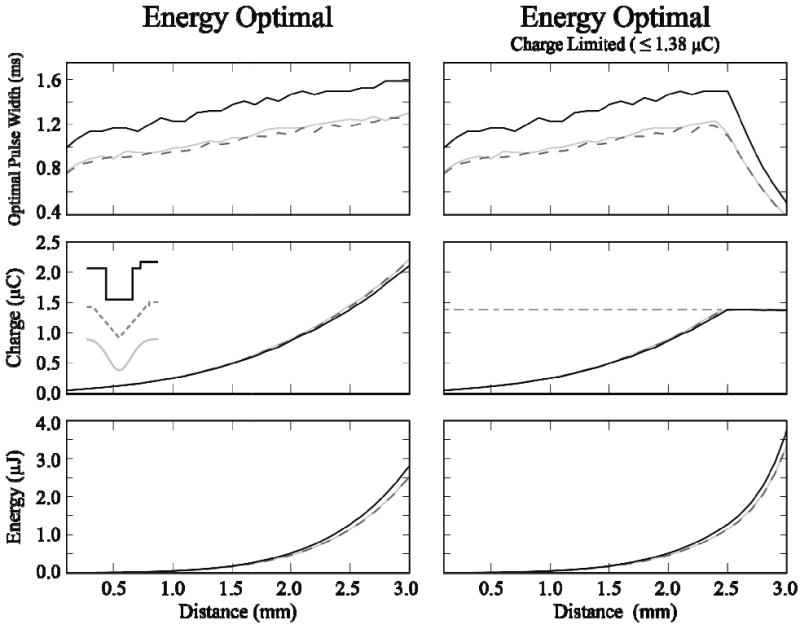
“Safe” activation with energy-optimal waveforms. DBS electrode used to stimulate a single fiber of passage. Waveform pulse width and amplitudes were adjusted to minimize energy injection. Left: Energy optimal stimulation with no limitation on charge injection. Right: Energy optimal stimulation with a charge injection limit of 1.38 μC. Rectangular (solid black), centered-triangular (dark gray, dashed) and Gaussian (light gray) waveforms had similar values, and have significant overlap.
Tissue capacitance changed the appearance of the waveforms, but had limited impact on the stimulation energy threshold (Figure 8). A time constant (ttc) of 0.3 μs had no observable effect on waveform shape or energy threshold. As the stimulation pulse width became significantly longer than the time constant, the impact on energy threshold decreased. The stimulation energy for a 100 μs rectangular threshold was 133 nJ, 135 nJ and 150 nJ with no tissue capacitance, a time constant of 3 μs, and a time constant of 30 μs, respectively. However, the energy-optimal rectangular waveform (1.25 ms duration) saw a more modest energy increase with tissue capacitance, from a baseline of 53.3 nJ to 53.8 nJ (ttc =30 μs). Likewise, small energy increases were seen with the energy-optimal Gaussian waveform (1 ms PW) from 48.1 nJ to 48.6 nJ and with the centered-triangular waveform (1 ms PW) from 48.0 nJ to 48.5 nJ.
Figure 8.
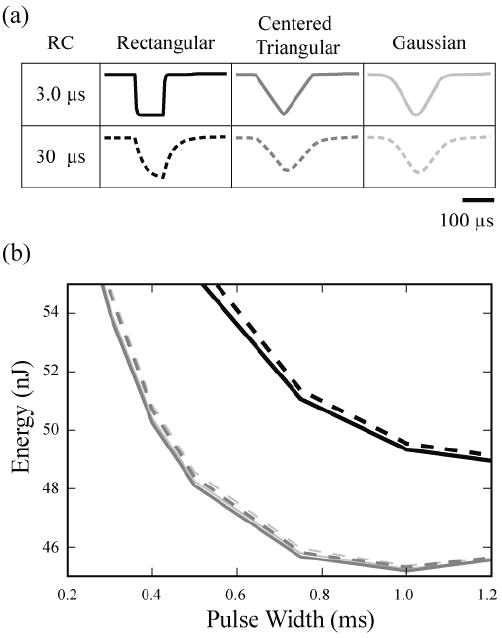
Effects of tissue capacitance on waveform shape and energy threshold. (a) Waveforms (100 μs pulse width) were passed through a low-pass RC circuit (time constant of 3 or 30 μs). (b) Energy required to activate 50% of a population of fibers with a DBS electrode in a capacitive tissue medium.
Discussion
Optimization of battery life for deep brain stimulation (DBS) devices represents a challenging engineering goal that can have practical value to patients. The typical life span of non-rechargeable implanted stimulator (Bin-Mahfoodh et al., 2003; Anheim et al., 2007; Ondo et al., 2007) is far shorter than the life expectancy of most patients (D'Amelio et al., 2006; Hely et al., 2008; Diem-Zangerl et al., 2009). Therefore, patients are faced with the prospect of multiple surgeries to replace the stimulator over the course of their treatment, and improving battery life could reduce the frequency of device replacement. Developing techniques to enhance energy efficiency is also applicable to devices with rechargeable batteries, as the energy savings could enable longer intervals between recharging. Alternatively, improvements in energy efficiency could allow for the use of smaller batteries (primary cell or rechargeable), and therefore smaller implantable stimulators. In either case, the biophysics of neural activation should be exploited as an engineering design parameter in development of the best possible devices. While this study focused on potential energy savings from the use of non-rectangular stimulus waveforms, it should also be noted that stimulation amplitude, pulse width, and frequency all interact with circuit design to define battery life.
This study used a detailed and clinically relevant representation of DBS to theoretically evaluate the potential benefits of non-rectangular stimulus waveforms. The quantitative details of the response to the three stimulation modalities (intracellular, point-source, and DBS electrodes) differed among the waveforms tested, in both threshold amplitude and relative thresholds. Most importantly we found that realistic representation of the actual electrode design substantially impacted the pulse width at which optimal energy saving would be achieved. However, general relationships between the waveform shapes remained intact across all modalities. We found the centered-triangular and Gaussian waveforms to be more energy efficient than rectangular pulses at their optimal pulse widths. The most significant change from using point-source electrodes to using DBS was a shift to longer pulse widths. This signifies that the optimal pulse-width is dependent on the electrode geometry. Regardless, at the cost of increased charge injection, energy savings were achieved through the use of non-rectangular waveforms, and longer than conventional pulse widths. It should also be noted that experimental results support the conclusion that longer pulse widths can be more energy efficient (Mortimer et al., 1970; Wongsarnpigoon and Grill, 2010).
We compared the response of fibers of passage and projection neurons to extracellular stimulation. To determine the threshold of activation for projection neurons, we modeled subthalamic neurons with passive soma-dendritic compartments. We supported this assumption by comparing the passive neuron results with a small population of cells that had active soma-dendritic compartments (Miocinovic et al., 2006). Since these cells were spontaneously firing, we interleaved stimulation between spikes. Optimal Gaussian and centered-triangular waveforms demonstrated energy savings that were similar to the passive model; 37.6 % and 37.2 % energy savings compared to the 100 μs rectangular waveform, and 11.2 % and 10.7 % energy savings compared to optimal rectangular pulses.
The optimal waveforms were centered-triangular, Gaussian and sinusoidal, suggesting that high-frequency components of a stimulus waveform are less efficient at exciting neurons than low-frequency components. However, one caveat is that our model does not account for the frequency-dependent behavior of the electrode-electrolyte interface, which has been shown to attenuate low-frequency components (Gimsa et al., 2005). This attenuation at lower frequencies could reduce the in vivo energy savings of these optimal waveforms.
In current-controlled DBS stimulation, the capacitive properties of the tissue medium affect the stimulation waveform shape (Butson and McIntyre, 2005). We modeled the effects of a tissue capacitance with time constants of 0.3, 3 and 30 μs, and found that for sufficiently short pulse-widths, there was a substantial change in waveform shape, and a corresponding increase in energy threshold (Figure 8). However, at longer pulse widths, the effect was much smaller. Energy of activation with optimal waveforms increased on average by only 0.82 % with a ttc of 3 μs, and by 1.18 % with a ttc of 30 μs. Overall, the impact of tissue capacitance on energy threshold was limited.
The charge and energy requirements of creating non-rectangular waveforms will influence the possible decision to adopt them in neurostimulation devices. While the waveforms examined in this study only represent a small subset of all possible waveforms, most of these waveforms can be generated with simple analog circuits. There are multiple methods for achieving these shapes, each with different energy requirements. For example, an analog integrator circuit (e.g. using an operational amplifier with capacitance in the feedback) can be used to efficiently generate the centered-triangular waveform. However, the Gaussian waveform, as well as more complex shapes, may require digital-to-analog conversion (DAC). DAC has been implemented in visual prostheses (DeMarco et al., 2003), but is not ideal in all cases due to the additional energy overhead. Real world devices also utilize capacitors in series with the electrodes which store charge during stimulation, then release it during the recharge phase to passively balance the charge injection. Large capacitance values are typically used to minimize the energy dissipation of these capacitors relative to that of the tissue load. Therefore, their effect on overall energy consumption is not included in our energy calculation. To achieve a net reduction in IPG energy consumption, the real world energy savings of non-rectangular waveforms must take all of these factors into account.
We investigated the safety of energy-optimal waveforms, and found that charge injection became an important factor for direct stimulation of small diameter fibers with DBS electrodes at distances greater than 2.5 mm. Past this point, energy optimal waveforms injected unsafe levels of charge (> 1.38 μC). We found that shorter pulse widths were required to activate these fibers safely, with a resultant increase in energy requirements compared to stimulating with no charge limit. In spite of limitations on charge injection, “safe” Gaussian and “safe” centered-triangular waveforms demonstrated energy savings over the optimal “safe” rectangular waveform, with an average energy savings of 10.2 ± 0.4 % for Gaussian, and 10.3 ± 0.2 % for centered-triangular waveforms (mean ± SD). However, the factors underlying stimulation induced tissue damage remain under debate, and no conclusive predictions can be made on their safety based on charge injection alone (Merrill et al., 2005).
To maximize the energy savings of non-rectangular waveforms, IPGs will need to be prospectively designed with that goal in mind. While our simulations found a difference between our optimal waveform and the standard-rectangular waveform, this does not guarantee a clinically relevant difference. Decreasing waveform energy by 50 % may not necessarily double battery lifetime. In fact, according to a report on Itrel II IPG devices (Medtronic, Minneapolis, MN) (Anheim et al., 2007), decreasing total electrical energy delivered from the overall mean of 111 to 55.5 (50 %, arbitrary units) predicts an increase in battery life from roughly 83.4 months to only 93.2 months (12 %). This may be in part due to the parasitic currents required to run the non-stimulation circuitry (e.g. processing, logic, telemetry, etc). In turn, the simple circuitry needed to generate a centered-triangular waveform may ultimately make it more energy efficient than the more complex circuitry required for a Gaussian waveform. Regardless, this modest 12 % extension in stimulator lifetime could be worthwhile in future IPG design, as it could add approximately a half of a year to the lifetime of a typical DBS device. It should also be noted that numerous engineering design features remain to be exploited to improve neurostimulation technology. Therefore, to achieve more efficient, safer stimulation, the implementation of novel stimulus waveforms must leverage advances in both circuit and electrode design.
Conclusions
This study predicts an energy saving of up to 64 % from the standard 100 μs rectangular pulse using longer duration, non-rectangular stimulus waveforms. Combining energy savings, charge injection and realistic stimulus waveform construction, we conclude that a theoretically optimal waveform for deep brain stimulation is a centered-triangular waveform with a pulse width of 1 ms. At a given energy level, we expect a higher recruitment of both fibers of passage and projection neurons using this waveform, compared to conventional stimulation. However, the energy savings are hampered by increased charge requirements, which may limit potential savings in battery life and impact stimulation induced tissue damage limits.
Acknowledgments
The authors would like to thank Matthew D. Johnson, Christopher R. Butson, and Ashutosh Chaturvedi for their help with model development and design. We would also like to thank Scott F. Lempka and D. Michael Ackermann for their insight on tissue-electrode interfaces and electronics. This research was supported by the National Institutes of Health (T32 GM07250, R01 NS047388).
References
- Anheim M, Fraix V, Chabardès S, Krack P, Benabid A-L, Pollak P. Lifetime of Itrel II pulse generators for subthalamic nucleus stimulation in Parkinson's disease. Mov Disord. 2007;22:2436–9. doi: 10.1002/mds.21726. [DOI] [PubMed] [Google Scholar]
- Bin-Mahfoodh M, Hamani C, Sime E, Lozano AM. Longevity of batteries in internal pulse generators used for deep brain stimulation. Stereotact Funct Neurosurg. 2003:56–60. doi: 10.1159/000075161. [DOI] [PubMed] [Google Scholar]
- Butson CR, McIntyre CC. Tissue and electrode capacitance reduce neural activation volumes during deep brain stimulation. Clin Neurophysiol. 2005;116:2490–500. doi: 10.1016/j.clinph.2005.06.023. [DOI] [PMC free article] [PubMed] [Google Scholar]
- Butson CR, McIntyre CC. Differences among implanted pulse generator waveforms cause variations in the neural response to deep brain stimulation. Clin Neurophysiol. 2007;118:1889–94. doi: 10.1016/j.clinph.2007.05.061. [DOI] [PMC free article] [PubMed] [Google Scholar]
- Carnevale NT, Hines ML. The NEURON Book. Cambridge, UK: Cambridge University Press; 2006. [Google Scholar]
- Cogan SF, Troyk PR, Ehrlich J, Plante TD, Detlefsen DE. Potential-biased, asymmetric waveforms for charge-injection with activated iridium oxide (AIROF) neural stimulation electrodes. IEEE Trans Biomed Eng. 2006;53:327–32. doi: 10.1109/TBME.2005.862572. [DOI] [PubMed] [Google Scholar]
- D'Amelio M, Ragonese P, Morgante L, Reggio A, Callari G, Salemi G, Savettieri G. Long-term survival of Parkinson's disease: a population-based study. J Neurol. 2006;253:33–7. doi: 10.1007/s00415-005-0916-7. [DOI] [PubMed] [Google Scholar]
- DeMarco S, Liu W, Singh P, Lazzi G, Humayun M, Weiland J. An arbitrary waveform stimulus circuit for visual prostheses using a low-area multibias DAC. IEEE J Solid-St Circ. 2003;38:1679–90. [Google Scholar]
- Diem-Zangerl A, Seppi K, Wenning GK, Trinka E, Ransmayr G, Oberaigner W, Poewe W. Mortality in Parkinson's disease: a 20-year follow-up study. Mov Disord. 2009;24:819–25. doi: 10.1002/mds.22414. [DOI] [PubMed] [Google Scholar]
- Foutz TJ, McIntyre CC. Evaluation of Novel Stimulus Waveforms for Activation of Local Projection Neurons and Fibers of Passage. Soc Neurosci Abstr. 2009:326.6/F10. [Google Scholar]
- Foutz TJ, Miocinovic S, McIntyre CC. Evaluation of Novel Stimulus Waveforms for Subthalamic Deep Brain Stimulation. Neur Int Conf. 2008;143 [Google Scholar]
- Gimsa J, Habel B, Schreiber U, Rienen Uv, Strauss U, Gimsa U. Choosing electrodes for deep brain stimulation experiments-electrochemical considerations. J Neurosci Methods. 2005;142:251–65. doi: 10.1016/j.jneumeth.2004.09.001. [DOI] [PubMed] [Google Scholar]
- Groves D, Brown V. Vagal nerve stimulation: a review of its applications and potential mechanisms that mediate its clinical effects. Neurosci Biobehav R. 2005;29:493–500. doi: 10.1016/j.neubiorev.2005.01.004. [DOI] [PubMed] [Google Scholar]
- Hardesty DE, Sackeim HA. Deep brain stimulation in movement and psychiatric disorders. Biol Psychiatry. 2007;61:831–5. doi: 10.1016/j.biopsych.2006.08.028. [DOI] [PubMed] [Google Scholar]
- Hely MA, Reid WG, Adena MA, Halliday GM, Morris JG. The Sydney multicenter study of Parkinson's disease: the inevitability of dementia at 20 years. Mov Disord. 2008;23:837–44. doi: 10.1002/mds.21956. [DOI] [PubMed] [Google Scholar]
- Jezernik S, Morari M. Energy-optimal electrical excitation of nerve fibers. IEEE Trans Biomed Eng. 2005;52:740–3. doi: 10.1109/TBME.2005.844050. [DOI] [PubMed] [Google Scholar]
- Jezernik S, Sinkjaer T, Morari M. Charge and energy minimization in electrical/magnetic stimulation of nervous tissue. J Neural Eng. 2010;7:046004. doi: 10.1088/1741-2560/7/4/046004. [DOI] [PubMed] [Google Scholar]
- Klafter RD, Hrebien L. An in vivo study of cardiac pacemaker optimization by pulse shape modification. IEEE Trans Biomed Eng. 1976;23:233–9. doi: 10.1109/tbme.1976.324636. [DOI] [PubMed] [Google Scholar]
- Lilly JC, Hughes JR, Alvord EC, Galkin TW. Brief, noninjurious electric waveform for stimulation of the brain. Science. 1955;121:468–9. doi: 10.1126/science.121.3144.468. [DOI] [PubMed] [Google Scholar]
- McCreery DB, Agnew WF, Yuen TG, Bullara L. IEEE Trans Biomed Eng. 1990. Charge density and charge per phase as cofactors in neural injury induced by electrical stimulation; pp. 996–1001. [DOI] [PubMed] [Google Scholar]
- McIntyre CC, Grill WM. Excitation of central nervous system neurons by nonuniform electric fields. Biophys J. 1999;76:878–88. doi: 10.1016/S0006-3495(99)77251-6. [DOI] [PMC free article] [PubMed] [Google Scholar]
- McIntyre CC, Grill WM, Sherman DL, Thakor NV. Cellular effects of deep brain stimulation: model-based analysis of activation and inhibition. J Neurophysiol. 2004;91:1457–69. doi: 10.1152/jn.00989.2003. [DOI] [PubMed] [Google Scholar]
- McIntyre CC, Richardson AG, Grill WM. Modeling the excitability of mammalian nerve fibers: influence of afterpotentials on the recovery cycle. J Neurophysiol. 2002;87:995–1006. doi: 10.1152/jn.00353.2001. [DOI] [PubMed] [Google Scholar]
- Merrill DR, Bikson M, Jefferys JGR. Electrical stimulation of excitable tissue: design of efficacious and safe protocols. J Neurosci Methods. 2005;141:171–98. doi: 10.1016/j.jneumeth.2004.10.020. [DOI] [PubMed] [Google Scholar]
- Miocinovic S, Parent M, Butson CR, Hahn PJ, Russo GS, Vitek JL, McIntyre CC. Computational analysis of subthalamic nucleus and lenticular fasciculus activation during therapeutic deep brain stimulation. J Neurophysiol. 2006;96:1569–80. doi: 10.1152/jn.00305.2006. [DOI] [PubMed] [Google Scholar]
- Mortimer JT, Shealy CN, Wheeler C. Experimental nondestructive electrical stimulation of the brain and spinal cord. J Neurosurg. 1970:553–9. doi: 10.3171/jns.1970.32.5.0553. [DOI] [PubMed] [Google Scholar]
- Nowak LG, Bullier J. Axons, but not cell bodies, are activated by electrical stimulation in cortical gray matter. I. Evidence from chronaxie measurements. Exp Brain Res. 1998a;118:477–88. doi: 10.1007/s002210050304. [DOI] [PubMed] [Google Scholar]
- Nowak LG, Bullier J. Axons, but not cell bodies, are activated by electrical stimulation in cortical gray matter. II. Evidence from selective inactivation of cell bodies and axon initial segments. Exp Brain Res. 1998b;118:489–500. doi: 10.1007/s002210050305. [DOI] [PubMed] [Google Scholar]
- Ondo WG, Meilak C, Vuong KD. Predictors of battery life for the Activa Soletra 7426 Neurostimulator. Parkinsonism Relat Disord. 2007:240–2. doi: 10.1016/j.parkreldis.2006.11.002. [DOI] [PubMed] [Google Scholar]
- Peckham P, Knutson J. Functional electrical stimulation for neuromuscular applications. Annu Rev Biomed Eng. 2005;7:327–60. doi: 10.1146/annurev.bioeng.6.040803.140103. [DOI] [PubMed] [Google Scholar]
- Ranck JB. Which elements are excited in electrical stimulation of mammalian central nervous system: a review. Brain Res. 1975;98:417–40. doi: 10.1016/0006-8993(75)90364-9. [DOI] [PubMed] [Google Scholar]
- Rizzone M, Lanotte M, Bergamasco B, Tavella A, Torre E, Faccani G, Melcarne A, Lopiano L. Deep brain stimulation of the subthalamic nucleus in Parkinson's disease: effects of variation in stimulation parameters. J Neurol Neurosurg Psychiatr. 2001;71:215–9. doi: 10.1136/jnnp.71.2.215. [DOI] [PMC free article] [PubMed] [Google Scholar]
- Sahin M, Tie Y. Non-rectangular waveforms for neural stimulation with practical electrodes. J Neural Eng. 2007;4:227–33. doi: 10.1088/1741-2560/4/3/008. [DOI] [PMC free article] [PubMed] [Google Scholar]
- Sato F, Parent M, Levesque M, Parent A. Axonal branching pattern of neurons of the subthalamic nucleus in primates. J Comp Neurol. 2000;424:142–52. doi: 10.1002/1096-9861(20000814)424:1<142::aid-cne10>3.0.co;2-8. [DOI] [PubMed] [Google Scholar]
- Shannon RV. A model of safe levels for electrical stimulation. IEEE Trans Biomed Eng. 1992;39:424–6. doi: 10.1109/10.126616. [DOI] [PubMed] [Google Scholar]
- Shepherd RK, McCreery DB. Basis of electrical stimulation of the cochlea and the cochlear nucleus. Adv Otorhinolaryngol. 2006;64:186–205. doi: 10.1159/000094652. [DOI] [PubMed] [Google Scholar]
- Tehovnik EJ. Electrical stimulation of neural tissue to evoke behavioral responses. J Neurosci Methods. 1996;65:1–17. doi: 10.1016/0165-0270(95)00131-x. [DOI] [PubMed] [Google Scholar]
- Turner J, Loeser J, Deyo R, Sanders S. Spinal cord stimulation for patients with failed back surgery syndrome or complex regional pain syndrome: a systematic review of effectiveness and complications. Pain. 2004;108:137–47. doi: 10.1016/j.pain.2003.12.016. [DOI] [PubMed] [Google Scholar]
- Voges J, Volkmann J, Allert N, Lehrke R, Koulousakis A, Freund HJ, Sturm V. Bilateral high-frequency stimulation in the subthalamic nucleus for the treatment of Parkinson disease: correlation of therapeutic effect with anatomical electrode position. J Neurosurg. 2002;96:269–79. doi: 10.3171/jns.2002.96.2.0269. [DOI] [PubMed] [Google Scholar]
- Wongsarnpigoon A, Grill WM. Energy-efficient waveform shapes for neural stimulation revealed with a genetic algorithm. J Neural Eng. 2010;7:046009. doi: 10.1088/1741-2560/7/4/046009. [DOI] [PMC free article] [PubMed] [Google Scholar]
- Wongsarnpigoon A, Woock J, Grill W. Efficiency Analysis of Waveform Shape for Electrical Excitation of Nerve Fibers. IEEE Trans Neural Syst Rehabil Eng. 2010 doi: 10.1109/TNSRE.2010.2047610. [DOI] [PMC free article] [PubMed] [Google Scholar]


