

Abstract
Physical aggression declines for the majority of children from preschool to elementary school. Although this desistance generally continues during adolescence and early adulthood, a small group of children maintain a high level of physical aggression over time and develop other serious overt and covert antisocial behaviors. Typically, researchers have examined relations of developmental changes in physical aggression to later violence with teachers' or mothers' reports on surveys. Little is known about the degree to which children's self-reported physical aggression predicts later antisocial behavior. The longitudinal study in this article had a staggered, multiple cohort design. Measures of physical aggression were collected through self- and mother reports from age 11–14 years, which were used to construct trajectory groups (attrition was 6 and 14% from age 11–14, respectively, for self- and mother reports). Overt and covert antisocial behaviors were self-reported at age 18–19 years (attrition was 36% from age 11 to 18–19). Four trajectory groups (low stable, 11%; moderate-low declining, 34%; moderate declining, 39%; high stable, 16%) were identified from self-reports, whereas three trajectories (low declining, 33%; moderate declining, 49%; high stable, 18%) were identified from mothers' ratings. We examined the prediction of overt and covert antisocial behaviors in early adulthood from the high stable and the moderate declining trajectories. According to both informants, higher probability of belonging to the high stable group was associated with higher overt and covert antisocial behavior, whereas higher probability of belonging to the moderate declining group was associated with higher covert antisocial behavior. Our results support the value of children's as well as mothers' reports of children's aggression for predicting different types of serious antisocial behavior in adulthood.
Keywords: Aggression, Multiple informants, Longitudinal analysis, Overt antisocial behavior, Covert antisocial behavior
Introduction
A number of researchers have argued that it is important to differentiate physical aggression from other types of aggression [37]. In recent decades, children's physical aggression (PA) has received more empirical attention than other modes of aggressive behavior, likely because it is the most predictive of risk for the development of maladjustment during childhood, adolescence and early adulthood [3, 5, 6, 36]. Similar trajectories of PA typically have been identified in samples of elementary school-aged children and pre-adolescents; these are a group with low stable aggression over time, a group (to which the majority of children belong) exhibiting a moderate level of aggression that declines over time, and a group with high stable aggression over time [3, 5, 12, 29].
It has been found that aggressive children are prone to develop an overt antisocial pathway characterized by an escalation from minor aggressive (e.g., bullying, annoying others) to serious violent behaviors (e.g., gang fighting, physical assault) [14]. However, the frequency of reported overt forms of antisocial behavior generally decreases during the emergence of adulthood [14]. In addition, aggressive children can also develop a covert antisocial pathway (that is stable during childhood and increases from early adolescence to adulthood) characterized by minor covert antisocial behaviors (e.g., shoplifting, lying), followed by property damage (e.g., fire setting, vandalism), and finally by serious types of thefts [14]. In particular, an increased risk for violent and nonviolent offending in adolescence has been noted for those individuals, mainly boys, who belong to the high stable PA trajectory throughout childhood and pre-adolescence [3, 5, 29].
Accordingly, effective prevention strategies of antisocial behavior have been implemented in early phase of development [15, 38], targeting multiple risk factors both at the individual and contextual level (school, peer, family and community) [11, 15, 16, 18, 34]. However, further research efforts on aggressive behaviors within a developmental trajectory framework can be useful to identify subgroups of children who are the best candidates to behave antisocially over time and, thus, are most likely in need of intervention.
Initial information of relevance to planning interventions is available from the impressive findings in existing longitudinal research on children's PA. However, there are some significant limitations in this body of work. To our knowledge, researchers previously have not examined if specific developmental pathways of PA are linked with specific antisocial pathways (i.e., overt and covert antisocial pathways) in young adulthood. In addition, investigations of developmental trajectories for nonaggregated types of aggressive behaviors (e.g., PA separated from other types of aggression) usually have not involved multiple raters. The majority of these studies have relied on teachers' or mothers' reports [5, 29], whereas relatively little is known about PA trajectories based on self-reports. To our knowledge, the only exception is the study of Martino et al. [25], who identified PA trajectories from adolescents' reports.
Beyond the three typical physical aggression trajectories (low stable, desisting, high stable), Martino et al. [25] identified a trajectory that started low, but increased throughout adolescence and then declined in late adolescence. This result is in agreement with what has been suggested in other studies that not all individuals who become delinquent or violent have a history of early aggression [3, 24, 33]. Moreover, Martino et al. [25] found that several self-reported indicators measured at Grade 7 (e.g., parental supervision, deviant peer association, academic orientation, impulsivity and emotional distress) were all strongly associated with trajectory class membership, with higher maladjustment indicators being positively associated with the more problematic developmental pathways. However, Martino et al. [25] did not examine the predictive validity of PA trajectories with respect to adult outcomes. Moreover, these authors underlined the importance of determining whether their findings, based on self-reports, would replicate using data that incorporate different informants.
There is some disagreement among researchers about the validity of self-report of PA. Some investigators have argued that self-reports are advantageous because children can report episodes that mothers do not know about [23] and that teachers may underestimate [25]. Others have argued that self-reports are problematic because children may not recognize their own behavior as aggressive, or are less willing than parents to report their aggressive behaviors [13].
However, the use of multiple-informant strategies frequently has been recommended to improve the study of aggression [2, 31]. Some investigators have followed this advice in studies of either aggregated forms of children's aggression [9, 23, 24, 30, 40] or nonaggregated forms of adolescents' aggression [32]. Others have used repeated measurements, relying on different informants over many years, to obtain information on either inter-individual [7]or intra-individual change in aggression [6, 36]. Overall, moderate inter-informant agreement has been found for externalizing behaviors because they are directly observable by different informants [2, 40]; however, relatively low adult-youth agreement on reports of child psychopathology is typical [2, 13].
Because of the need to better understand the validity of preadolescents' self-reported PA and the predictive relation of PA to serious externalizing problems in adulthood, the goals of the present study were: (1) to determine the similarity of the developmental trajectories of PA during pre-adolescence using self-reports and mothers' reports; (2) to examine the predictive validity of the identified trajectories based on both informants in respect to overt and covert antisocial behaviors in early adulthood. This study goes beyond the study of Martino et al. [25] by replicating similar PA pathways with data that incorporated multiple reporters' perspectives and validating the usefulness of self-reports in identifying children with chronic physical aggression and in predicting antisocial tendencies in early adulthood. Such results would be helpful to practitioners working in prevention programs with limited resources.
Methods
Participants and procedure
Participants were 439 children (55% boys) from a longitudinal study on social adjustment. Children were drawn from two regular public schools in Genzano, a residential community located 30 km away from Rome, Italy. The community of Genzano represents a socioeconomic microcosm of the larger society, composed of families of skilled workers, farmers, professionals, local merchants and their service staff. In particular, the occupational socioeconomic distribution of the children's families matched the Italian national profile [21]. Families with different socioeconomic status were integrated within this community in terms of both residence in which they live and schools that their children attend. The socioeconomic diversity of the sample and high residential integration adds to the generalizability of the findings. Consistent with national statistics, most subjects were from intact families (94%) and two-children families (64%).
The longitudinal project followed a staggered, multiple cohort design, with four cohorts assessed initially at ages 11 years in 1992, 1993, 1994 and 1995. They were reassessed yearly at ages 12, 13 and 14 years. All of the children enrolled in these grades participated in the study unless they happened to be absent from school when the measures were administered (on average 11% at age 11 years). Finally, due to funding limitations, the last follow-up took place in two different years (2000 and 2002) and included most of the original samples at the age of 18 years (cohorts that started in 1993 and 1995) and 19 years (cohorts that started in 1992 and 1994). Data collections' schema differentiated by cohort is reported in Table 1; the sample size over time is reported in Table 2.
Table 1.
Data collections schema differentiated by cohort
| Cohort 1 (years) | Cohort 2 (years) | Cohort 3 (years) | Cohort 4 (years) | |
|---|---|---|---|---|
| 1992 | 11 | |||
| 1993 | 12 | 11 | ||
| 1994 | 13 | 12 | 11 | |
| 1995 | 14 | 13 | 12 | 11 |
| 1996 | 14 | 13 | 12 | |
| 1997 | 14 | 13 | ||
| 1998 | 14 | |||
| 1999 | ||||
| 2000 | 19 | 18 | ||
| 2001 | ||||
| 2002 | 19 | 18 |
Table 2.
Descriptive statistics of the measures
| Age | Self-report N (% boys) | Mother report N (% boys) |
|---|---|---|
| Physical aggression | ||
| 11 | 439 (55) | 219 (53) |
| 12 | 397 (55) | 248 (52) |
| 13 | 426 (55) | 291 (58) |
| 14 | 399 (55) | 188 (62) |
| Children sample of physical aggression N (% boys) | Mother sample of physical aggression N (% boys) | |
|---|---|---|
| Overt behavior | ||
| 14 | 398 (55) | 277 (58) |
| 18–19 | 282 (54) | 208 (57) |
| Covert behavior | ||
| 14 | 400 (55) | 279 (58) |
| 18–19 | 283 (54) | 209 (57) |
Participants attended sixth grade at age 11 years and junior high school between ages 12 and 14 years. At age 18 years, 81% of the participants attended high school, 11% were college students and 8% were workers; at age 19 years, 66% of the participants attended high school, 16% were college students and 18% were workers (mostly unskilled).
Preliminary analyses indicated that children who participated in all four time lags were rated as no different in aggression and in demographic variables than children who missed either one or two data collections. Children who missed more than two data collections were not included in the present paper. Of the 439 children who participated in the present study, 294 of their mothers agreed to participate. Mothers provided yearly ratings when children were between the ages of 11 and 14 years. Those mothers who did not participate in the research (30%) were traced by the researchers, and they said that they would participate in the research but never did so.
Those mothers who did not participate in the research did not differ in marital status, occupation or years of education from those mothers who participated (respectively, χ2(3) = 1.027, p = 0.79; χ2(8) = 13.274, p = 0.10; χ2(3) = 1.027, p = 0.79; χ2(4) = 5.089, p = 0.28). In addition, children whose mothers participated did not differ in self-reported aggression from children whose mothers did not participate (PA at age 11 years: F(1,437) = 0.096, p = 0.76; at age 12 years: F(1,400) = 3.173, p = 0.076; at age 13 years: F(1,429) = 3.267, p = 0.071; and at age 14 years F(1,401) = 2.259, p = 0.134). Children whose mothers participated in all four assessments were rated as more aggressive at 11 years than children whose mothers missed one of the four assessments, whereas there were no significant differences at 12, 13 and 14 years (PA at age 11 years: F(1,216) = 4.25, p = 0.040; PA at age 12 years: F(1,245) = 0.238, p = 0.626; PA at age 13 years: F(1,252) = 0.016, p = 0.899; PA at age 14 years: F(1,149) = 0.804, p = 0.371). Attrition of children and mothers from age 11 to 14 years was 6 and 14%, respectively, and was mainly due to relocation from the area or absence from school at the time of the assessments.
Participants were administered the measures by three female researchers during specially scheduled sessions in a school. Mothers completed the questionnaire at their child's school in a group setting. After junior high school, youths were invited to participate in the study by phone and they received paper versions of the questionnaires via mail to complete at home. They were asked to return the completed questionnaires to the researchers during specially scheduled sessions at a school. They received a small payment for their participation in the research (about 25 €).
During the entire research project, consents/assents were obtained, experimenters offered explanations as needed, and confidentiality was guaranteed for all participants. The entire study was approved by the Sapienza University of Rome's Human Subjects Institutional Review Board.
Measures
Physical aggression (PA)
Items pertaining to PA (six for children, five for mothers) from the Physical and Verbal Aggression Scale1 (PVA) [9] were rated by children and mothers (1 = never; 3 = often; e.g., I kick and hit or punch; items were in the third person for mothers; mean alphas for self- and mother reports of PA from age 11 to 14 years = 0.80 and 0.81, respectively).
Overt antisocial behavior
Overt antisocial behavior (OAB) was assessed with self-ratings (1 = never, 5 = often) on four items of the Violence Scale [8] (i.e., Have you participated in violent gang actions? Have you participated in violent actions of supporter groups? Have you been involved in fights between people or rival groups? Have you ever used violence during a quarrel? mean alpha across ages 14, 18 and 19 = 0.78).
Covert antisocial behavior
Covert antisocial behavior (CAB) was assessed with self-ratings (0 = not true, 2 = very true or often true) on five items from the Youth Self-Report (YSR) [1] (I lie or cheat; I set fires; I steal things at home; I steal things from places other than home; I use alcohol or drugs other than for medical conditions; mean alpha at ages 14, 18 and 19 years = 0.70).
Analytic approach
To explore if the frame of reference of PA for each reporter was stable over time [39], the longitudinal factorial invariance of the PA factor structure was analyzed separately for self- and mother reports. The PA items were considered ordered categorical variables because of their three-point response format. With categorical data, two models were recommended [26]: the unconstrained model (i.e., thresholds and factor loadings are freed across groups) and the constrained model (i.e., thresholds and factor loadings are constrained to be equal across groups). Evidence for longitudinal invariance was examined by comparing the overall fit of the models and testing for the significance of difference in the χ2 value, based on WLSMV χ2 (i.e., weighted least square mean- and variance-adjusted χ2), using Mplus 4.21 [26]. Partial longitudinal invariance occurs when significant difference in the χ2 value between unconstrained and constrained models occurs [26]. Evaluation of the goodness of fit was based on indices that are less sensitive to sample size. Comparative Fit Index (CFI) values of at least 0.95 [20] and root-mean-square error of approximation (RMSEA) values lower than 0.05 are considered good [20], whereas RMSEA values between 0.05 and 0.08, reflect an acceptable error of approximation [4].
To identify distinct developmental patterns of PA, we used the group-based semi-parametric approach recommended by Nagin [27, 28] with SAS Proc-Traj [22]. For each participant, Proc Traj produces an explicit metric (i.e., the posterior probability of group membership in each trajectory group) for evaluating the accuracy of group assignments [27]. The term trajectory probability is used when referring to the probability of an individual's membership in each of the trajectory groups (continuously distributed probabilities). In addition, Proc Traj assigns a categorical score based on each individual's highest trajectory probability. When referring to the categorical group score that is assigned to each participant, the term trajectory membership is used.
We conducted analyses to identify the best fitting trajectory models (censored normal models using continuous variables) for self- or mother reports, including sex as a time-independent covariate [22]. We report the results of the multivariate logistic regressions used to examine if sex affected the trajectory membership. Then we investigated inter-informant agreement of the trajectory groups by performing cross-tabulations between the trajectory membership related to the trajectories modeled from self- and mothers' reports of PA using a χ2 test and estimates of the standardized residuals. In addition, correlations across reporters were computed for yearly PA scores. Children who missed more than two data collections were not included in the aforementioned longitudinal analyses.
Finally, to explore the association of mother- and self-reported PA trajectories with OAB and CAB in young adulthood, a path analysis was used to test PA predicting age 18–19 years OAB and CAB. Specifically, due to the longitudinal design of our study, part of our sample was followed up at age 18 years (for those who were 11 years old in 1993 and 1995), part was followed up at age 19 years (for those who were 11 years old in 1992 and 1994). We computed two new variables called OAB at age 18–19 years and CAB at age 18–19 years by collapsing into a single variable the data from the corresponding variables at age 18 or 19 years. Then, we created a control variable, called age 18–19 years, to take into account the age at which OAB and CAB were assessed.
We computed a multigroup path analysis (the self-reported and mother-reported information were the two levels of the group variable) in which the trajectory probabilities were the potential predictors of long-term OAB and CAB, while controlling for sex, the initial level of both antisocial behaviors (age 14 years),2 and the age 18–19 years covariate.
To examine differences in the estimated parameters based on self- and mother reports, we constrained all parameters to be equal across groups and used the χ2 difference test to compare nested models [26]. The model fit was assessed with the same indices discussed previously in relation to longitudinal invariance.
Maximum likelihood estimation under missing at random assumption was specified to optimally take into account the available data [26].
Results
Longitudinal invariance
For self-reports, the χ2 difference test did not support the viability of the full longitudinal invariance hypothesis. Inspection of the modification indices suggested that one item, and its corresponding threshold, was not invariant across time points. In the partially constrained model, beyond the significant χ2, all the fit indices satisfied the recommended criteria, and the difference in χ2 test supported partial longitudinal invariance, χ2 (n = 439;df = 76) = 102.222, p = 0.024; CFI = 0.991; RMSEA = 0.031, Δχ2 (Δdf = 22) = 31.166, p = 0.093. According to Steenkamp and Baumgartner [35], the comparison of factor means (computed with all the PA items) across time points may be considered meaningful because at least one item besides the marker item had invariant intercepts in the PA dimension. In our case, longitudinal invariance of the PA dimension for self-report supported the invariance of five out of six items across the four examined time lags; thus, we kept the one item that was not invariant in the composite score of PA.
For mother reports, χ2 difference test supported full longitudinal invariance, χ2 (n = 294; df = 30) = 26.619, p = 0.485; CFI = 1.00; RMSEA = 0.00, Δχ2 (Δdf = 15) = 12.123, p = 0.670.
Trajectory models
For self-reports, the four-group model comprising two stable trajectory groups and two linear trajectory groups was the ideal solution. The average group assignment probabilities were between 0.80 and 0.87. For mothers' reports, the four-group model was the ideal solution, but the smallest group had only seven individuals (2.5% of sample); thus, the three-group model with two linear and one stable trajectory was selected based on parsimony [28]. The average group assignment probabilities were between 0.84 and 0.89 (see Fig. 1 for models).
Fig. 1.

Physical aggression trajectories based on self- and mothers' reports from age 11 to 14 years
Table 3 presents the results of the multivariate logistic regression examining the capacity of sex to distinguish membership in the trajectories membership. For self-reports, relative to the low/moderate declining group, children either in the moderate declining group or in the high stable group were more likely to be boys. For mothers' reports, relative to the moderate declining group, children in the low stable group were less likely to be boys, whereas children in the high stable group were more likely to be boys.
Table 3.
The relation of sex to group membership probabilities, separately for self- and mother reports
| Self-report |
Mother report |
||||||
|---|---|---|---|---|---|---|---|
| Low stable | Low/moderate declining | Moderate declining | High stable | LOW declining | Moderate declining | High stable | |
| Constant | −0.83* | – | −1.18** | −2.79** | 0.501 | – | −2 32** |
| Sex | −3.09 | – | 2.43** | 3.24** | −2.12** | – | 1.67* |
Males were coded as 1, females as 0
p < 0.05
p < .01
Inter-informant agreement
Table 4 presents the cross-tabulation between trajectory membership based on self- and mother reports, χ2 (6) = 128.583, p < 0.001. Children assigned on the basis of self-ratings to the low stable group were significantly more likely than expected by chance to be assigned to the low declining group based on mothers' reports and less likely to be assigned to the mother-reported moderate declining and high stable groups. Children assigned on the basis of self-ratings to the low/moderate declining group were more likely than expected by chance to be assigned to the mother-reported low declining group and also less likely to be assigned to the mother-reported high stable group. Children assigned to the self-reported moderate declining group were more likely to be assigned to the mother-reported moderate declining group and less likely to be assigned to the mother-reported low declining group. Finally, children assigned to the self-reported high stable group were less likely to be assigned to the mother-reported low declining group and more likely to be assigned to the high stable group.
Table 4.
Cross-tabulations of trajectories based on self- and mother reports
| Mother reports |
||||
|---|---|---|---|---|
| Low declining | Moderate declining | High stable | Total | |
| Self-reports | ||||
| Low stable | ||||
| Count | 29 | 7 | 1 | 37 |
| Standard residual | 4.99 | −2.57 | −2.33 | |
| Low/moderate declining | ||||
| Count | 50 | 44 | 2 | 96 |
| Standard residual | 3.48 | −0.35 | −3.89 | |
| Moderate declining | ||||
| Count | 14 | 74 | 31 | 119 |
| Standard residual | −3.90 | 2.18 | 1.55 | |
| High stable | ||||
| Count | 1 | 17 | 24 | 42 |
| Standard residual | −3.39 | −0.73 | 5.46 | |
| Total | ||||
| Count | 94 | 142 | 58 | 294 |
For both self- and mother reports, longitudinal correlations from age 11 to 14 years (i.e., within and across time) attested to moderate stability, with lower correlations at greater distance of time. The zero-order correlations were all significant and ranged from 0.23 (across 4 years) to 0.49 (all but 2 of 16 across reporter within and across time correlations were above 0.33, and the mean across-reporter correlation was 0.37).
Path analyses
We computed a multi-group path analysis in which we included as potential predictors of long-term OAB and CAB the trajectory probabilities of belonging to the moderate declining group and to the high stable group. We created a “stacked” data file in which each case had two records, one for each informant. Due to the non-normality of the OAB and CAB measures (the skewness varied from 2.25 to 3.12, the kurtosis varied from 5.11 to 9.90), the path model was estimated in MPlus using the multiple linear regression (MLR) estimator setting (maximum likelihood parameter estimates with standard errors that are robust to non-normality and nonindependence of observations) [26].
The equivalence between the multiple groups was evaluated by constraining the estimates for the model's parameters to be the same for self- and mother reports. Both the unconstrained and the constrained models represented a good model-data fit (χ2(4) = 1.116, p = 0.89, CFI = 1.00, RMSEA < 0.001 for the unconstrained model; χ2(15) = 5.917, p = 0.98, CFI = 1.00, RMSEA < 0.001, for the constrained model). Also, the χ2 difference test, Δχ2(11) = 0.912, p = 0.99, supported the viability of an invariant association between the trajectory probabilities of belonging to both moderate declining and high stable developmental pathways with long-term OAB and CAB when assessed with self-versus mother reports.
Figure 2 presents a diagrammatic representation of the constrained model and the path coefficients only for significant paths. In addition to the contribution either of sex to OAB at age 18–19 years (being male was associated with higher OAB) or of earlier OAB to OAB at age 18–19 years, the trajectory probability for belonging to the high stable group, based on both self- and mother reports, significantly predicted OAB and CAB in early adulthood. The probability of being in the moderate declining group, based on both self- and mother reports, was positively related to only CAB at age 18–19 years. Finally, the significant path of the age covariate on both outcomes reflected higher values of both OAB and CAB at age 19 years than at 18 years.
Fig. 2.
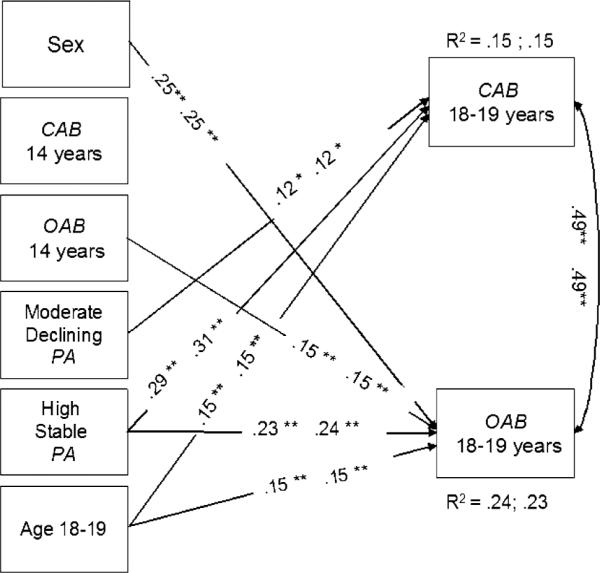
Multiple-group path analysis of physical aggression trajectory probabilities predicting OAB and CAB. OAB Overt antisocial behavior, CAB Covert antisocial behavior, PA Physical aggression. Significant standardized estimates of the constrained model (i.e., all the paths are constrained to be equal across groups) are reported. The estimates refer to, first, the group in which the trajectory probabilities were based on self-report and, second, to the group in which the trajectory probabilities were based on mothers' reports. Males were coded as 1 and females as 0
Discussion
Several investigators have argued that to better understand aggression, researchers need to investigate nonaggregated forms of aggressive behavior [37] and use multiple-informant strategies [2, 13]. Historically, investigators focusing on PA have not relied on multiple informants, whereas those who have used different informants typically have examined aggregates of aggression [9, 13, 30].
Taking into account the distinct role of PA as a risk factor for later violence [5], we investigated the specific construct of PA from late childhood to adolescence according to two privileged points of view: the self and mothers. As a prerequisite to modeling change over time with latent growth curve analysis, we established partial longitudinal invariance of self-reported PA from age 11–14 years and full longitudinal invariance for mothers' reports (i.e., we established that the frame of reference of PA for each reporter was stable over time).
In addition, consistent with previous studies [5, 29], four trajectory groups were identified for self-reports of PA (high stable, moderate declining, low/moderate declining and low stable), whereas three trajectories were identified for mothers' reports (high stable, moderate declining, low declining). This is the first study of PA trajectories in Italy and the similarities in the development of PA with other samples are notable.
The fact that more developmental trends were identified by self-reports than by mothers' reports can be attributed to a greater ability of children, compared to mothers, either to be aware of their own behavior or to better discriminate the severity of their own behavior. Furthermore, this difference may be connected to the fact that in community samples, children tend to report more problematic behaviors than do parents [41].
Similar to Card et al. [10], according to both informants, girls were more likely to be assigned to the trajectory groups characterized by the lowest levels of PA over time, whereas boys were more likely to be assigned to groups displaying higher levels of PA. Moreover, in accordance with others' findings [13], we found a moderate level of agreement between raters on PA. Importantly, these findings support the validity of children's self-reported PA in childhood and early adolescence.
Consistent with other previous studies in which aggression was disaggregated [3, 5, 29], those who belonged to the high stable trajectory based on either self-or mothers' reports were more likely to be at risk for both OAB and CAB later in development. Moreover, as discussed by different authors [14], our results are consistent with the findings that OAB and CAB may have a diametrically opposite development cycle. In fact, those who belonged to the moderate declining physically aggressive group, as assessed by both self- and mother reports, tended not to be significantly related to OAB, but were significantly related to CAB.
Finally, consistent with others who have not found the so-called “late onset” group [5, 29], we did not find evidence of a group of preadolescents who increased their level of aggression over time in our identified trajectories based on both informants. This is in contrast with Martino et al. [25], who examined self-reported PA trajectories and found an increasing trend. This may be due to the fact that their trajectories did not end at 14 years old, as did ours and those in other studies [5, 29]. It may be due to the fact that the construct of PA they referred to focused not only on physically aggressive behavior as in this study, but also on threats of PA. However, we did find some support for the existence of young adults who behave antisocially even though they did not belong to an increasing pathway of PA during adolescence. In fact, we found a significant association between the moderate decreasing PA pathway (based on both informants) and CAB at age 18–19 years. This result is in agreement with Brame et al. [3], who did not examine the trajectories of PA with self-reports and did not find an increasing trajectory for PA, but did find a significant association between belonging to a desisting PA pathway from 6 to 13 years and belonging to an increasing delinquency pathway from 13 to 17 years.
Moreover, our results may indirectly support the declining developmental pathway of OAB and the increasing developmental pathway of CAB from adolescence until adulthood [14].
The use of self-reports in our study can be viewed as a limitation if we consider the fact that self-reports can be biased due to imperfect memory and to socially desirable responding [25]. However, mother/teacher-reported aggression can be similarly susceptible to such distortions, and the continuity and the predictive validity of self-reported violent and delinquent offenses have been supported [19]. Thus, overall, the resemblance between the trajectories we identified based on self-reports and mothers' reports and their similar predictive validity with respect to antisocial behavior in early adulthood gives us confidence in the veracity of our participants' reports and, more generally, provide additional support for the validity for self-reports.
A limitation of this study is that, although we did look at sex differences in the identified models (accounting for sex as a covariate), we did not identify PA trajectories using separate samples for boys and girls as in some previous studies [17, 27]. This was due to our smaller sample size in comparison to other studies relying upon growth mixture modeling approaches. Moreover, caution should be used in generalizing results from the present study to other populations, because participants in this study were Italians, predominantly middle class, educated and from two-parent families.
Conclusion
Most of what is known about children's PA is what children's teachers or mothers report on questionnaires. In our study, we clearly found that what children report, as well as mothers report, is useful when studying the relation between disaggregated forms of aggressive behaviors and the risk for later OAB and CAB. This suggests that additional information is needed before drawing the conclusion that self-reported PA is not very reliable prior to adolescence [13]. The findings suggest that preadolescents' self-reported PA may be useful in identifying children at risk for OAB and CAB, who are candidates for intervention programs. Finally, in line with our findings, practitioners should focus their attention not only on those children who are chronically aggressive, but also on those who exhibit an initial moderate level of PA that decreases over time. The latter can be candidates for endorsing more CAB (rather than OAB).
Acknowledgments
This study was partially supported by grants from the Spencer Foundation and W. T. Grant Foundation to Albert Bandura, from the Ministero dell'Istruzione dell'Università e della Ricerca (MIUR) to Gian Vittorio Caprara (COFIN 1998, 2000) and to Eugenia Scabini (COFIN 2000–2002), and from the National Institute of Mental Health to Nancy Eisenberg.
Footnotes
Previous psychometric studies on the PVA scale have not explored its multidimensionality but sustained its monolithic dimensionality based on exploratory factor analyses [9, 30]. In order to update these results, confirmatory factor analyses were conducted to examine the factor structure of the PVA scale for self- and mother reports, accounting for the order categorical nature of its items. A two-factor model provided a better fit to the PVA scale for both self- and mother reports: one factor for physical aggression and another one for verbal aggression. Details on these analyses are available from the first author upon request. Only PA was used in this study.
In each model, the initial level of the outcome referred to the unique contribution of the outcome at age 14 years that was not shared with PA at age 14 years. Thus, we obtained residual variables by regressing PA at age 14 years based on self-report onto OAB and CAB at age 14 years (explained variances were, respectively, 38 and 15%).
References
- 1.Achenbach TM. Manual for the Youth-Self Report and 1991 Profile. University of Vermont, Department of Psychiatry; Burlington, VT: 1991. [Google Scholar]
- 2.Achenbach TM, McConaughy SH, Howell CT. Child/ adolescent behavioral and emotional problems: implications of cross-informant correlations for situational specificity. Psychological Bullettin. 1987;101:213–232. [PubMed] [Google Scholar]
- 3.Brame R, Nagin DS, Tremblay RE. Developmental trajectories of aggression. J Child Psychol Psychiatry. 2001;52:503–512. [PubMed] [Google Scholar]
- 4.Browne MW, Cudeck R. Alternative ways of assessing model fit. In: Bollen KA, Long SJ, editors. Testing structural equation models. Sage, Newbury Park: 1993. pp. 136–162. [Google Scholar]
- 5.Broidy LM, Nagin DS, Tremblay RE, Bates JE, Brame R, Dodge KA, Fergusson DM, Horwood JL, Loeber R, Laird R, Lynam D, Moffitt TE, Pettit GS, Vitaro F. Developmental trajectories of childhood disruptive behaviors and adolescent delinquency: a six site, cross national study. Dev Psychol. 2003;39:222–245. doi: 10.1037//0012-1649.39.2.222. [DOI] [PMC free article] [PubMed] [Google Scholar]
- 6.Cairns RB, Cairns BD, Neckerman H, Ferguson L, Gariepy J. Growth and aggression: 1. Childhood to early adolescence. Dev Psychol. 1989;25:320–330. [Google Scholar]
- 7.Caprara GV, Barbaranelli C, Pastorelli C, Bandura A, Zimbardo PG. Prosocial foundations of children's academic achievement. Psychol Sci. 2000;11(4):302–306. doi: 10.1111/1467-9280.00260. [DOI] [PubMed] [Google Scholar]
- 8.Caprara GV, Mazzotti E, Prezza M. Una scala per la misura dell'atteggiamento verso la violenza [A scale for the measurement of attitude toward violence] Giornale Italiano di Psicologia. 1990;17:107–120. [Google Scholar]
- 9.Caprara GV, Pastorelli C. Early emotional instability, prosocial behavior and aggression: some methodological aspects. Eur J Pers. 1993;7:19–36. [Google Scholar]
- 10.Card NA, Stucky BD, Sawalani GM, Little TD. Direct and indirect aggression during chidlhood and adolescence: a metaanalytic review of gender differences, intercorrelations, and relations to maladjustment. Child Dev. 2008;79(5):1185–1229. doi: 10.1111/j.1467-8624.2008.01184.x. [DOI] [PubMed] [Google Scholar]
- 11.Chamberlain P. Treating chronic juvenile offenders: advances made through the Oregon multidimensional treatment foster care model. American Psychological Association; Washington: 2003. [Google Scholar]
- 12.Côté S, Vaillancourt T, LeBlanc J, Nagin DS, Tremblay RE. The development of physical aggression from toddlerhood to pre-adolescence: A nationwide longitudinal study. J Abnorm Child Psychol. 2006;34(1):71–85. doi: 10.1007/s10802-005-9001-z. [DOI] [PubMed] [Google Scholar]
- 13.De Los Reyes A, Kazdin AE. Informant Discrepancies in the Assessment of Childhood Psychopathology: A Critical Review, Theoretical Framework, and Recommendations for Further Study. Psychol Bull. 2005;131(4):483–509. doi: 10.1037/0033-2909.131.4.483. [DOI] [PubMed] [Google Scholar]
- 14.Dishion T, Patterson G. Developmental psychopathology, Risk, disorder, and adaptation. 2nd edn. Vol 3. Hoboken; John Wiley & Sons Inc: 2006. The development and ecology of antisocial behavior in children and adolescents; pp. 503–541. [Google Scholar]
- 15.Dodge KA. Community intervention and public policy in the prevention of antisocial behavior. J Child Psychol Psychiatry. 2009;50(1–2):194–200. doi: 10.1111/j.1469-7610.2008.01985.x. [DOI] [PMC free article] [PubMed] [Google Scholar]
- 16.Elliott DS, Mihalic S. Issues in disseminating and replicating effective prevention programs. Prev Sci. 2004;5(1):47–53. doi: 10.1023/b:prev.0000013981.28071.52. [DOI] [PubMed] [Google Scholar]
- 17.Harachi TW, Fleming CB, White HR, Ensminger ME, Abbott RD, Catalano RF, Haggerty KP. Aggressive behavior among girls and boys during middle childhood: predictors and sequelae of trajectory group membership. Aggress Behav. 2006;32:279–293. [Google Scholar]
- 18.Henggeler WW, Schoenwald SK, Bourduin CM, Rowland MD, Cunningham PB. Multisystemic treatment of antisocial behavior in children and adolescents. Guilford, New York: 1998. [Google Scholar]
- 19.Hoeve M, Blokland A, Semon Dubas J, Loeber R, Gerris JRM, van der Laan PH. Trajectories of delinquency and parenting styles. J Abnorm Child Psychol. 2008;36(2):223–235. doi: 10.1007/s10802-007-9172-x. [DOI] [PMC free article] [PubMed] [Google Scholar]
- 20.Hu L, Bentler PM. Cut-off criteria for fit indexes in covariance structure analysis: Conventional criteria versus new alternatives. Struct Equ Modeling. 1999;6:1–55. [Google Scholar]
- 21.Istituto Italiano di Statistica . Annuario statistico italiano 2002 [Italian yearbook of statistics 2002] ISTAT; Rome: 2002. [Google Scholar]
- 22.Jones B, Nagin DS, Roeder K. A SAS procedure based on mixture models for estimating developmental trajectories. Sociol Methods Res. 2001;29:374–393. [Google Scholar]
- 23.Ladd GW, Kochenderfer-Ladd B. Analysis of cross-informant data for concordance, estimation of relational adjustment, prevalence of victimization, and characteristics of identified victims. Psychol Assess. 2002;14(1):74–96. doi: 10.1037//1040-3590.14.1.74. [DOI] [PubMed] [Google Scholar]
- 24.Loeber R, Stouthamer-Loeber M. Development of juvenile aggression and violence. Some common misconceptions and controversies. Am Psychol. 1998;53:242–259. doi: 10.1037//0003-066x.53.2.242. [DOI] [PubMed] [Google Scholar]
- 25.Martino SC, Ellickson PL, Klein DJ, McCaffrey D, Edelen MO. Multiple trajectories of physical aggression among adolescent boys and girls. Aggress Behav. 2008;33:1–15. doi: 10.1002/ab.20215. [DOI] [PubMed] [Google Scholar]
- 26.Muthèn LK, Muthèn BO. Mplus users guide. Muthèn and Muthèn; Los Angeles: 2006. [Google Scholar]
- 27.Nagin DS. Analyzing developmental trajectories: a semi-parametric, group-based approach. Psychol Methods. 1999;4:139–157. doi: 10.1037/1082-989x.6.1.18. [DOI] [PubMed] [Google Scholar]
- 28.Nagin DS. Group-based modeling of development. Harvard University Press; Cambridge: 2005. [Google Scholar]
- 29.Nagin DS, Tremblay RE. Trajectories of boys' physical aggression, opposition, and hyperactivity on the path to physically violent and nonviolent juvenile delinquency. Child Dev. 1999;70:1181–1196. doi: 10.1111/1467-8624.00086. [DOI] [PubMed] [Google Scholar]
- 30.Pastorelli C, Barbaranelli C, Cermak I, Rodsza S, Caprara GV. Measuring emotional instability, prosocial behavior and aggression in pre/adolescents: a cross/national study. Pers Indiv Differ. 1997;23(4):691–703. [Google Scholar]
- 31.Plewis I, Vitaro F, Tremblay RE. Modelling repeated ordinal reports from multiple informants. Stat Modelling. 2006;6:251–263. [Google Scholar]
- 32.Raine A, Dodge K, Loeber R, Gatzke-Kopp L, Lynam D, Reynolds C, Stouthamer-Loeber M, Liu J. The reactive- proactive aggression questionnaire: differential correlates of reactive and proactive aggression in adolescent boys. Aggress Behav. 2006;32:159–171. doi: 10.1002/ab.20115. [DOI] [PMC free article] [PubMed] [Google Scholar]
- 33.Schaeffer CM, Petras H, Ialongo N, Poduska J, Kellam S. Modeling growth in boys' aggressive behavior across elementary school: links to later criminal involvement, conduct disorder, and antisocial personality disorder. Dev Psychol. 2003;39(6):1020–1035. doi: 10.1037/0012-1649.39.6.1020. [DOI] [PubMed] [Google Scholar]
- 34.Scott S, Sylva K, Doolan M, Price J, Jacobs B, Crook C, Landau S. Randomised controlled trial of parent groups for child antisocial behaviour targeting multiple risk factors: the SPOKES project. J Child Psychol Psychiatry. 2010;51(1):48–57. doi: 10.1111/j.1469-7610.2009.02127.x. [DOI] [PubMed] [Google Scholar]
- 35.Steenkamp JEM, Baumgartner H. Assessing measurement invariance in cross-national consumer research. J Consum Res. 1998;25:78–90. [Google Scholar]
- 36.Timmermans M, van Lier PAC, Koot HM. Which forms of child/adolescent externalizing behaviors account for late adolescent risky sexual behavior and substance use? J Child Psychol Psychiatry. 2008;49(4):386–394. doi: 10.1111/j.1469-7610.2007.01842.x. [DOI] [PubMed] [Google Scholar]
- 37.Tremblay RE. The development of aggressive behavior during childhood: what we learned in the past century? Int J Behav Dev. 2000;24(2):129–141. [Google Scholar]
- 38.Tremblay RE. Understanding development and prevention of chronic physical aggression: towards experimental epigenetic studies. Phil Trans R Soc B. 2008;363:2613–2622. doi: 10.1098/rstb.2008.0030. [DOI] [PMC free article] [PubMed] [Google Scholar]
- 39.Vandenberg RJ, Lance CE. A review and synthesis of the measurement invariance literature: suggestions, practices, and recommendations for organizational research. Organ Res Methods. 2000;2:4–69. [Google Scholar]
- 40.Verhulst FC, van der Ende J. Agreement between parents' reports and adolescents' self-reports of problem behavior. J Child Psychol Psychiatry. 1992;33:1011–1023. doi: 10.1111/j.1469-7610.1992.tb00922.x. [DOI] [PubMed] [Google Scholar]
- 41.Waaktar T, Borge AIH, Christie HJ, Torgersen S. Youth- parent consistencies on ratings of difficulties and prosocial behavior: exploration of an at-risk sample. Scand J Psychol. 2005;46:179–188. doi: 10.1111/j.1467-9450.2005.00447.x. [DOI] [PubMed] [Google Scholar]