

Abstract
Sleep curtailment has become a common behavior in modern society. This review summarizes the current laboratory evidence indicating that sleep loss may contribute to the pathophysiology of diabetes mellitus and obesity. Experimentally-induced sleep loss in healthy volunteers decreases insulin sensitivity without adequate compensation in beta-cell function, resulting in impaired glucose tolerance and increased diabetes risk. Lack of sleep also down-regulates the satiety hormone leptin, up-regulates the appetite-stimulating hormone ghrelin, and increases hunger and food intake. Taken together with the epidemiologic evidence for an association between short sleep and the prevalence or incidence of diabetes mellitus and/or obesity, these results support a role for reduced sleep duration in the current epidemic of these metabolic disorders. Screening for habitual sleep patterns in patients with “diabesity” is therefore of great importance. Studies are warranted to investigate the putative therapeutic impact of extending sleep in habitual short sleepers with metabolic disorders.
Keywords: Sleep deprivation, glucose metabolism, appetite regulation, diabetes, obesity
Introduction
Evidence for a modulatory impact of sleep on many physiological functions, including metabolic regulation and endocrine release, has been reported more than four decades ago. Nighttime hormonal release and glucose control are dependent on the occurrence of specific sleep stages [1-3]. Human sleep is composed of rapid-eye-movement (REM) sleep and stages 1, 2 and 3 of non-REM (NREM) sleep. During the deeper stage of non-REM sleep, i.e. slow wave sleep (SWS) or stage NREM 3, brain glucose utilization and sympathetic nervous activity are decreased and parasympathetic nervous activity is increased, relative to both wake and REM sleep. SWS is also associated with robust elevations of growth hormone (GH) levels, while pituitary-adrenal activity is inhibited [3]. Hence SWS is likely to play a major role in total body glucose regulation. More recently, orexin neurons in the lateral hypothalamus have been identified as playing a central role in the maintenance of arousal as well as feeding behavior [4, 5], suggesting an impact of sleep duration on appetite regulation (reviewed in chapter 12 “Sleep and metabolism: role of hypothalamic neuronal circuitry”).
The first laboratory studies examining the adverse impact of sleep deprivation on metabolic and endocrine functions concluded that the alterations occurring during one or two nights of acute total sleep deprivation were reversed during recovery sleep. Because these results suggested that persistent adverse effects of sleep loss are unlikely, but also because the degree of sleep deprivation in these studies was not commonly occurring on a recurring basis in the general population, little attention was paid to these findings. Since then, recurrent partial sleep deprivation, i.e. the result of a voluntary behavior reflecting the demands and opportunities of modern society, has become increasingly common. The impact of such sleep deprivation, which affects all age groups, was first investigated 10-15 years ago. Figure 1 summarizes the sleep duration on week-nights for US and French adults and adolescents as assessed in years 2005-2008 [6-9]. Data from the 2008 “Sleep in America” poll of the National Sleep Foundation indicate that although working adults report a sleep need of an average of 7h18min to function at best, the average sleep duration is 6h40min, with 44% of them sleeping less than 7h on a typical week-night (as opposed to only 15.6% in 1960 [10]), and 16% less than 6h (Figure 1 A right panel; [6]). Sleep times in European countries follow a similar trend; a survey conducted in France among adults aged 18 to 55 years reported that, on work-nights, the average sleep duration was 6h58min and that 33% of the respondents slept less than 7h per night (Figure 1 A left panel; [8]). Among the pediatric population, adolescents carry the strongest sleep debt. While laboratory studies have shown that physiological sleep need is about 9h across all ages of adolescence [11], sleep duration on school nights is 7h12min for 9th to 12th grade American teens [7] and 7h45min for 15-19 years old French adolescents [9]. In both countries the amount of sleep that adolescents believe they need to feel their best during the day is higher than the amount of sleep that they actually achieve (9h02min in France, 8h00min in the US), with the optimal sleep duration reported by French adolescents matching findings on sleep need obtained in laboratory studies [11]. In France, 78% of adolescents get an insufficient (<8h) or borderline sufficient (8h<9h) amount of sleep on school nights and this proportion reaches a striking 87% for US adolescents (Figure 1B; [7, 9]). Not surprisingly, in both countries, adults and adolescents who report insufficient sleep are much more likely to also report sleepiness, tiredness, irritability, depressed mood, and higher intake of caffeinated beverages.
Figure 1.
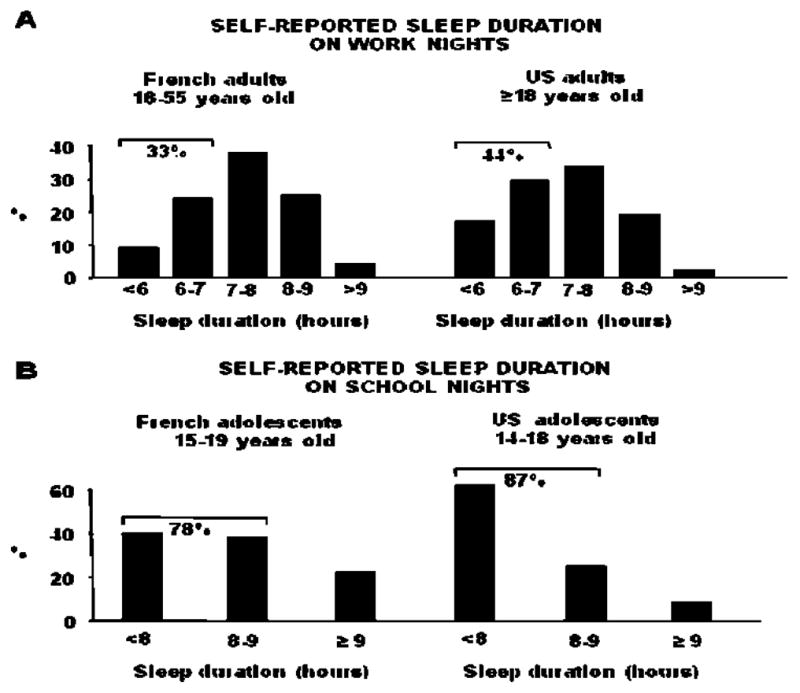
Self-reported sleep duration (hours) for US and French adults (panels A) and adolescents (panels B). For adolescents, a sleep duration of <8 hours is considered insufficient, from 8 to 9 hours borderline, and ≥9 hours optimal. Adapted from [6-9].
To date, an ever-increasing number of cross-sectional as well as prospective epidemiologic studies (reviewed in chapter 5 “Sleep duration and cardiometabolic risk: a review of the epidemiologic evidence”) have provided evidence for an association between short sleep and the prevalence or incidence of obesity or diabetes, after controlling for age, body mass index (BMI) and various other confounders. The present review will summarize the current laboratory evidence indicating that recurrent sleep curtailment is associated with a constellation of metabolic and endocrine alterations, strongly suggesting that short sleep is an important, though still widely underestimated, non-traditional lifestyle factor involved in the current epidemic of diabetes and obesity.
Sleep Duration and Glucose Metabolism
Total sleep deprivation studies
The first studies evaluating the impact of sleep deprivation on human health involved various durations of total sleep deprivation (TSD) (Table 1). In the late 1960s, Kuhn et al. compared glucose tolerance in 28 young healthy volunteers after 4-5 control nights with normal bedtimes and after 72-126 hours of TSD: the glucose response to an oral glucose tolerance test (OGTT) was higher in the latter condition, indicating reduced glucose tolerance [12]. In another early study [13], the effect of 120-h TSD on the activity of selected enzymes of energy metabolism in skeletal muscle was studied in 7 healthy volunteers: the activity of all the enzymes assayed was decreased, with those involved in the Krebs cycle and in anaerobic glycolysis reaching statistical significance. These results are suggestive of a “prediabetic” type of muscle metabolism during sleep deprivation. Furthermore, fasting blood glucose levels were increased at the end of the sleep deprivation period [13]. In another study [14], compared to results obtained after a 7h night, 60h of TSD in young healthy male volunteers was shown to increase fasting insulin levels, as well as the insulin response to OGTT, while no change was observed for glucose levels, suggesting that TSD induced insulin resistance [14]. In yet another study, one night of TSD was found to increase steady state glucose levels during an insulin suppression test modified with octreotide, while steady state insulin levels were unchanged, suggesting again decreased insulin sensitivity (SI) [15]. In contrast, Schmid et al. reported no alteration of SI after a similar duration of sleep deprivation; however, surprisingly, baseline glucagon levels were decreased and the relative glucagon relative response to a stepwise hypoglycemic clamp enhanced, compared to a 7h night; the clinical significance of these results remains to be investigated [16].
Table 1. Impact of total (upper panel) and partial sleep deprivation (lower panel) on glucose metabolism.
OGTT: Oral Glucose Tolerance Test. ivGTT: Intravenous Glucose tolerance test.
| SUBJECTS | STUDY CONDITIONS | CHANGES WITH SLEEP DEPRIVATION | ||
|---|---|---|---|---|
| Time in bed | Method | |||
| Total sleep deprivation studies | ||||
| Kuhn et al. 1969 [12] | 28 men 20-30 yo BMI n.a. |
72-126h total sleep deprivation vs. 4-5 “control” nights | OGTT | ⇓ glucose tolerance |
| Vondra et al. 1981 [13] | 7 men 21-23 yo BMI n.a. |
120h total sleep deprivation vs. 3 “normal” nights |
Muscle biopsy and energy metabolism-related senzymatic activity | Prediabetic type of muscle metabolism ⇑ fasting glucose |
| VanHelder et al. 1993 [14] | 10 men 22 ± 3 yo 12. 6 ± 5. 9% body fat |
60h total sleep deprivation vs. 1 × 7h in bed |
OGTT | ⇑ insulin response ⇔ glucose tolerance |
| Gonzalez-Ortiz et al. 2000 [15] | 28 men & women 19-23 yo BMI < 26 kg/m2 |
24h total sleep deprivation vs. 1 night of “normal sleep” |
Insulin suppression test modified with octreotide | ⇑ steady state glucose ⇔ steady state insulin |
| Schmid et al. 2007 [16] | 10 men 25 ± 1 yo BMI 23.8 ± 0.5 kg/m2 |
1 night total sleep deprivation vs. 1 × 7h in bed |
Stepwise hypoglycemic clamp | ⇓ baseline glucagon ⇑ relative glucagon response to hypoglycemia |
| Partial sleep deprivation studies | ||||
| Spiegel et al. 1999 [17] | 11 men 18-27 yo BMI 23.4 ± 0.5 kg/m2 |
6 × 4h in bed vs. 6 × 12h in bed |
ivGTT | ⇓ glucose tolerance ⇓ glucose effectiveness ⇓ AIRg |
| Spiegel et al. 2005 [25] | 12 young men 22 ± 2 yo 23.6 ± 2 kg/m2 |
2 × 4h in bed vs. 2 × 10h in bed |
Daytime blood sampling (q20 min) | ⇑ glucose ⇓ insulin |
| Leproult et al. 2006 [26] | 10 men & 2 women 24 ± 1 yo BMI 23.4 ± 0.6 kg/m2 |
7 × 5h in bed vs. 2 × 10h in bed |
ivGTT | ⇓ insulin sensitivity |
| Buxton et al. 2008 [27] | 20 men 20 - 35 yo BMI 21 - 30 kg/m2 |
7 × 5h in bed vs. 3 × 10h in bed |
Euglycemic hyperinsulinemic clamp | ⇓ insulin sensitivity |
| Bosy-Westphal et al. 2008 [28] | 14 women 28 - 38 yo BMI 20 - 36.6 kg/m2 |
1 × 7h, 2 × 6h, 1 × 4h in bed vs. 2 × >8h in bed |
OGTT | ⇔ Insulin sensitivity (HOMA index) ⇔) Insulin sensitivity (Matsuda index) |
| Zielinski et al. 2008 [29] | Restriction: 6 men & 16 women 60 ± 5 yo BMI 24.7±3 kg/m2 Controls: 6 men & 12 women 61 ± 5 yo BMI 26.6±3.4 kg/m2 |
Restriction: 8 weeks of 6.6 ± 0.6h vs. 2 weeks of 7.6 ± 0.7h Controls: 8 weeks of 6.8 ± 1.1 h vs. 2 weeks of 7.2 ± 1.1 h |
OGTT | ⇔ glucose tolerance ⇔ Insulin sensitivity (QUICKI index) |
| Schmid et al. 2009 [31] | 10 men 20-40 yo BMI 23.8 ± 0.5 kg/m2 |
1 × 4.5h in bed vs. 1 × 7h in bed |
Stepwise hypoglycemic clamp | ⇓ baseline glucagon ⇓ glucagon during hypoglycemia |
| Nedeltcheva et al. 2009 [32] | 6 men & 5 women 39 ± 5 yo BMI 26.5 ± 1.5 kg/m2 |
14 × 5.5h in bed vs. 14 × 8.5h in bed |
OGTT ivGTT | ⇓ oral glucose tolerance ⇓ insulin sensitivity ⇑ glucose effectiveness |
| Donga et al. 2010 JCEM [33] | 5 men & 4 women 23-62 yo BMI < 26 kg/m2 |
1 × 4h in bed vs. 1 × 8.5h in bed |
Euglycemic hyperinsulinemic clamp [6,6-2H2]-glucose infusion | ⇓ peripheral and hepatic insulin sensitivity |
| Van Leeuwen et al. 2010 [34] | 23 men (15 sleep restriction, 8 controls) 19 - 29 yo BMI 23.2 ± 2.7 kg/m2 |
Restriction: 5 × 4h in bed vs. 2 × 8h in bed Controls: 8h in bed |
Single fasting blood sample (7.30 am) | ⇔) glucose ⇑ fasting insulin |
Partial sleep deprivation studies
The second part of Table 1 summarizes the results of studies that investigated the impact of partial sleep deprivation (PSD) on glucose metabolism in healthy lean, overweight or obese adults. The first study that investigated the effect of sleep debt on metabolic and endocrine functions assessed carbohydrate metabolism, 24-h profiles of the counterregulatory hormones cortisol and GH, and cardiac sympathovagal balance in 11 young men after time in bed had been restricted to 4h for 5 to 6 nights [17-19]. The sleep-debt condition was compared with measurements taken at the end of a sleep-recovery period when participants were allowed 12h in bed for 5 - 6 nights. Glucose tolerance, assessed during an intravenous glucose tolerance test (ivGTT) and a high-carbohydrate breakfast, was lower in the sleep-debt condition than in the fully rested condition. Importantly, glucose tolerance quantified from the decline of glucose levels during the ivGTT was in the range typical for older adults with impaired glucose tolerance in the state of sleep debt [20]. The ivGTT is a validated tool that also provides assessments of SI, pancreatic beta-cell responsiveness (referred to as “acute insulin response to glucose”, AIRg), and glucose effectiveness (SG), a measure of non-insulin dependent glucose disposal [21]. SG was 30% lower in the state of sleep debt. AIRg was reduced by more than 30% after sleep restriction despite a trend for decreased SI. The disposition index (DI), i.e. the product of SI and AIRg, is a validated marker of diabetes risk [22, 23]. In the state of sleep debt, the DI was decreased by an average of about 40% as compared to the fully rested state, and 3 of the 11 subjects had DI values <1.000, indicating a high risk of diabetes [24]. Sleep loss was also associated with increased evening cortisol concentrations, increased duration of elevated GH concentrations during the waking period, and increased cardiac sympathovagal balance (Figure 2; panels B, C, and E) [17-19]. Thus, semichronic PSD appears to have a clinically significant deleterious impact on glucose metabolism and cardiometabolic risk. In a subsequent study from the same group of investigators, a randomized crossover design with 2 nights of 10h vs. 2 nights of 4h in bed was used to examine the impact of short-term PSD on glucose metabolism [25]. After the second night of each condition, caloric intake was replaced by an intravenous glucose infusion at a constant rate and blood samples were collected every 20 min. Even though sleep duration was manipulated for only 2 nights, glucose tolerance was decreased, partly as a result of inadequate insulin secretion.
Figure 2.

Relationship between sleep duration and the 24h profiles of HOMA, cortisol, growth hormone, leptin and cardiac sympathovagal balance. Adapted from [18, 19]. The bars represent the sleep periods. The shaded area represent the response to breakfast for HOMA and the evening levels for cortisol profiles.
In another study involving a baseline period of 3 days with 10h bedtimes followed by 8 nights of 5h bedtimes, an ivGTT was performed in 13 young healthy individuals after the second baseline night and after 7 short nights. Preliminary findings indicate that, following sleep restriction, the subjects experienced a 40% decrease in SI, without adequate compensation by insulin release. The DI was thus markedly decreased after sleep loss [26]. In a separate study in non-obese healthy men, sleep restriction to 5h per night for one week resulted in a significant reduction in SI as assessed by hyperinsulinemic euglycemic clamp, considered the gold standard method for SI determination [27].
In the only study focusing on women only, no impact of progressive sleep curtailment over 4 nights was reported on measures of glucose tolerance and SI [28]. Zielinski et al. assessed the impact of semi-chronic (8 weeks) sleep curtailment on glucose tolerance in self-reported older long sleepers (≥8.5 h/night), compared to a control group; the authors observed no effect of sleep restriction on glucose tolerance, as assessed by OGTT [29]. However, contrasting with the self-reported long sleep, objective sleep duration assessed by actigraphy was approximately 7.5h at baseline. Bedtime curtailment resulted in a decrease in total sleep time by only 1h on average. Furthermore, sleep duration was also decreased in the control group, and the final difference in total sleep time between the two groups was only approximately 16 min [30]. The negative findings regarding glucose tolerance are thus not unexpected.
Schmid et al. reported the effect of one single night of sleep restriction (4.5h in bed vs. normal bedtime of 7h) on insulin-induced hypoglycemia in healthy young subjects. Similar to previous findings [17], fasting glucose, insulin levels or HOMA levels (the normalized product of glucose and insulin levels, a validated index of insulin sensitivity), were not altered by sleep deprivation. Also, the glucose infusion rate, as well as the hypoglycemia-induced decrease in C-peptide levels, were similar to those observed in the normal sleep condition. However, a decrease in glucagon levels both at baseline and during hypoglycemia was observed after the night of sleep restriction. The authors speculate that this be mediated by the autonomic nervous system. These results suggest that sleep deprivation could also affect alpha-cell function, but await further confirmation [31].
Another study reported that semi-chronic sleep restriction (2 weeks of 5.5h versus 8.5h in bed) in middle-aged overweight adults was associated with decreased SI during ivGTT without appropriate compensatory beta-cell release, as AIRg was not affected by the sleep condition, resulting in reduced oral glucose tolerance [32]. However, the increase in diabetes risk, as assessed by the DI, did not reach statistical significance. In addition, SG was increased. Donga et al. evaluated SI in middle-aged men and women after one single night of partial sleep restriction (4h in bed, from 1 to 5 am) with the euglycemic hyperinsulinemic clamp [33]. The authors observed a reduction in glucose infusion and disposal rates, indicating a deterioration of glucose tolerance and peripheral SI. They also assessed endogenous hepatic glucose production rate, by continuous infusion of [6,6 -2H2]-glucose, which was increased by approximately 22% after sleep restriction. Free fatty acid levels were also increased, a sign of higher insulin resistance at the adipose tissue level. Cortisol and glucagon levels (both at baseline and during the clamp), in contrast, were unchanged. Finally, Van Leeuwen et al. simulated a cumulative sleep restriction as it can occur during five working days (4h in bed), in healthy young men. Compared to 2 nights of 8h in bed, morning fasting glucose levels were unchanged after sleep loss, while morning fasting insulin concentrations were increased, indicating reduced SI. After 2 nights of recovery sleep (8h in bed), fasting glucose was lower than at baseline, while insulin returned to baseline levels, suggesting that the effects of weekday sleep restriction may be reversed by recovery sleep on weekends [34]. Lastly, in a study that did not intent to manipulate sleep duration but focused instead on the metabolic consequences of circadian misalignment, by submitting healthy young volunteers to 28-h sleep/wake cycles for 7 consecutive nights, sleep efficiency was reduced to 67% at the peak of circadian misalignment (versus 84% at baseline), and the glucose and insulin responses to breakfast were increased [35].
Sleep Duration and Appetite Regulation
A large number of epidemiologic studies have demonstrated associations between short sleep and higher BMI. One pathway linking short sleep to obesity is increased caloric intake in short sleepers. The following section will present results from laboratory studies that have used TSD paradigms to delineate the respective role of sleep and circadian rhythmicity in the 24-h pattern of hormones involved in the neuroendocrine regulation of appetite, ie leptin and ghrelin. We then summarize the results from a growing number of laboratory studies that have explored the effects of PSD on leptin, ghrelin, caloric intake and weight gain. Table 2 summarizes the results of these studies.
Table 2. Impact of total (upper panel) and partial sleep deprivation (lower panel) on appetite regulation.
OGTT: Oral Glucose Tolerance Test.
| SUBJECTS | STUDY CONDITIONS | CHANGES WITH SLEEP DEPRIVATION | ||||||
|---|---|---|---|---|---|---|---|---|
| Time in bed | Caloric intake | Weight | Leptin | Ghrelin | Hunger | Caloric intake | ||
| Total sleep deprivation | ||||||||
| Simon et al. 1998 [40] | 7 men 21-25 yo BMI 22.2 ± 0.6 kg/m2 |
8h in bed (23:00-07:00) vs. Total sleep deprivation followed by daytime 8h in bed |
24h continuous enteral nutrition | n/a | ⇓ during night | n/a | n/a | n/a |
| Mullington et al. 2003 [41] | 10 men 22-37 yo BMI 20-34.5 kg/m2 |
3 × 8h in bed + recovery vs. 88h total sleep deprivation |
3 meals + optional evening snack /24h vs 4 meals + optional evening snack /24h | ⇔ | ⇓ during night | n/a | n/a | n/a |
| Dzaja et al. 2004 [43] | 10 men 28 ± 3 yo BMI 20.5 - 29.5 kg/m2 |
10h in bed vs. Total sleep deprivation |
Matched standardized meals (1800 kcal/24h) | n/a | n/a | ⇓ during night | n/a | n/a |
| Schmid et al. 2007 [16] | 10 men 20-40 yo BMI 20.7-25 kg/m2 |
1 × 7h sleep vs. 1 × 0h sleep |
No food from 21:00 to hypoglycemic clamp | n/a | n/a | n/a | ⇑ | n/a |
| Partial sleep deprivation | ||||||||
| Guilleminault et al. 2003 [54] | 8 men 18-25 yo BMI 22.9 ± 0.7 kg/m2 |
1 × ad lib + 2 × 8.5h in bed vs. 7 × 4h in bed |
Standardized diet | n/a | ⇓ | n/a | n/a | n/a |
| Spiegel et al. 2004 [19] | 11 men 22 ± 1 yo BMI 23.4 ± 0.5 kg/m2 |
6 × 12h in bed vs. 6 × 4h in bed |
Matched meals on the day preceding and on the day of blood sampling | ⇔ | ⇓ | n/a | n/a | n/a |
| Spiegel et al. 2004 [44] | 12 men 22 ± 2 yo lBMI 23.6 ± 2 kg/m2 |
2 × 10h in bed vs. 2 × 4h in bed |
Matched diner on the second night / Matched glucose infusion during blood sampling | ⇔ | ⇓ | ⇑ | ⇑ | n/a |
| Schmid et al. 2008 [55] | 9 men 20-40 yo BMI 20.7-25.0 kg/m2 |
1 × 7h sleep vs. 1 × 4.5h sleep vs. 1 × 0h sleep | No food from 21:00 to single morning blood draw | n/a | ⇔ | ⇑ | ⇑ | n/a |
| Bosy-Westphal et al. 2008 [28] | 14 women 23-38 yo BMI 20-36.6 kg/m2 |
2 × >8h (9h sleep) vs. 7h, 6h, 6h, 4h (5.5h sleep) |
ad lib diet prior to OGTT | ⇑ +0.4 kg | ⇑ | ⇔ | ⇔ | ⇑ + 20% by dietary records |
| Schmid et al. 2009 [31] | 10 men 20-40 yo BMI 20.7-25.0 kg/m2 |
1 × 7h sleep vs. 1 × 4.5h sleep | No food from 21:00 to hypoglycemic clamp | n/a | n/a | n/a | ⇔ | n/a |
| Schmid et al. 2009 [50] | 15 men 20-40 yo BMI 22.9 ± 0.3 kg/m2 |
2 × 8h15 in bed vs. 2 × 4h15 in bed |
Uncontrolled food intake until the morning of the 2nd night when blood sampling was initiated and ad lib food offered | n/a | ⇔ | ⇔ | ⇔ | ⇑ 60% more than usual in both sleep conditions |
| Tasali et al. 2009 [74] | 10 men and women 18-28 yo BMI 20-25 kg/m2 |
4 × 8.5h in bed vs. 4 × 4.5h in bed |
Matched meals /ad lib buffet at the end | ⇔ | n/a | n/a | n/a | ⇑ during ad lib buffet |
| Nedeltcheva et al. 2009 [48] | 5 women, 6 men 34-49 yo BMI 24-29 kg/m2 |
14 × 8.5h in bed vs. 14 × 5.5h in bed |
ad lib diet /identical meals on the blood sampling day | Similar ⇑ in both sleep conditions | ⇔ | ⇔ | n/a | ⇑ snacks |
| Brondel et al. 2010 [46] | 12 men 18-29 yo BMI 19-24.6 kg/m2 |
1 × 4h in bed vs. 1 × 8h in bed |
Similar food intake the day before sleep restriction. Ad libitum food intake after sleep restriction. | n/a | n/a | n/a | ⇑ | ⇑ |
| Omisade et al. 2010 [52] | 15 women 18-25 yo BMI 18.3-51.9 kg/m2 |
2 × 10h in bed vs. 1 × 3h in bed |
Matched meals | n/a | ⇑ | n/a | ⇔ | n/a |
| van Leeuwen et al. 2010 [34] | 15 men 19 - 29 yo BMI 23.3 ± 2.7 kg/m2 |
2 × 8h in bed vs. 5 × 4h in bed |
Matched meals and snacks /+ one more snack (fruit; 50kcal) at 0:30 during sleep restriction | n/a | ⇑ | n/a | ⇔ | n/a |
| Simpson et al. 2010 [51] | 136 men and women 22 – 45 yo BMI 17.7 – 32.6 kg/m2 |
2 × 10h in bed vs. 5 × 4h in bed |
Ad libitum food access | n/a | ⇑ | n/a | n/a | n/a |
Total sleep deprivation studies
Leptin, a hormone released by the adipocytes, provides information about energy status to regulatory centers in the hypothalamus [36]. Circulating leptin levels in humans show a rapid decline or increase in response to acute caloric shortage or surplus, respectively [37, 38]. These changes in leptin concentrations have been associated with reciprocal changes in hunger [38]. The 24-h leptin profile, which is strongly dependent on meal intake, shows increasing levels during the daytime that culminate in a nocturnal maximum [39]. Nevertheless, a study using an abrupt 8-h shift of bedtimes and continuous enteral nutrition to eliminate the impact of meal intake demonstrated that leptin levels are modulated by both sleep and circadian rhythmicity [40]. Under these experimental conditions, a sleep-related leptin elevation was apparent when sleep was allowed during the daytime after the night of TSD, and a circadian-related leptin elevation was observed during the night of TSD. The stimulating impact of sleep on leptin levels was also evidenced in a subsequent study that showed decreased amplitude of the leptin diurnal variation during prolonged TSD [41].
Ghrelin, a peptide produced predominantly by the stomach, is also involved in energy balance regulation, but, in contrast to leptin, ghrelin stimulates appetite [42]. The 24-h profile of ghrelin levels shows a marked nocturnal rise which reflects at least partly the rebound of ghrelin following suppression by the evening meal. The impact of TSD on the nocturnal ghrelin profile has been examined in only one study and it was reported that the nocturnal ghrelin elevation is dampened when subjects are sleep deprived [43].
Recently, Schmid at al. reported that a night of TSD resulted in increased subjective hunger the following morning [16]. Leptin and ghrelin levels were not assessed in this study.
Partial sleep deprivation studies
In a randomized cross-over design study involving 2 nights of 4h in bed vs. 2 nights of 10h in bed, the daytime profiles of leptin and ghrelin were assessed while the subjects completed validated scales for hunger and appetite for various food categories [44]. Overall leptin levels were decreased by 18%, while ghrelin increased by 28%, and the ghrelin:leptin ratio increased by more than 70% when sleep was restricted. Hunger showed a 23% increase and appetite for nutrients with high carbohydrate content was increased by more than 30%. Importantly, these differences in appetite regulation between the 2 bedtime conditions occurred despite identical amounts of caloric intake, similar sedentary conditions, and stable weight. By comparison, in a study where caloric intake, rather than sleep duration, was manipulated, 3 days of underfeeding by approximately 900 cal/day in healthy lean volunteers result in a 22% decrease of leptin levels [38]. Thus the decrease in leptin resulting from sleep restriction appears to have functional significance. Indeed, if this increase in hunger during sleep restriction were to translate into a commensurate increase in food intake, weight gain would be expected to occur over time. In accordance with this hypothesis, anecdotal evidence for an increase in food intake in subjects confined to the laboratory and permitted ad libitum access to food during 3 days of TSD had already been reported in 1997 [45]. Since then, careful evaluations of food intake have been performed in subjects submitted to PSD. In healthy young men, one night of 4h in bed, in comparison with one night of 8h in bed, resulted in a 22% increase in caloric intake during the subsequent day [46]. Similarly, preliminary data by Tasali et al. reported a 14% increase in caloric intake, particularly for carbohydrate-rich nutrients, during an ad libitum buffet after 4 nights of 4.5h in bed, compared to after 4 nights of 8.5h in bed, in young healthy men and women [47]. To note, in the above studies, caloric intake was identical under both sleep conditions prior to access to ad libitum food. In yet another study [28], when young women were exposed to an ad libitum diet during 2 bedtime conditions, ie 4 nights of ∼ 5.5h of sleep vs. 2 nights of ∼ 9h of sleep, a 20% increase in self-reported food consumption was observed in the sleep restriction condition and weight gain (+0.4kg) occurred [28]. In overweight middle-aged adults who had ad libitum access to palatable food during 2 weeks of sleep extension (+1.5h /night) versus 2 weeks of sleep restriction (-1.5h /night), an increase in snack consumption, particularly in the evening, was observed in the short sleep condition [48]. In this study, weight gain was observed under both sleep conditions, a result somehow expected, as food intake is critically dependent on the amount and palatability of food provided to the subject [49].
Results obtained for the neuroendocrine regulation of appetite in studies providing ad libitum access to food can seem contradictory at first sight. For instance, in the two studies that observed increased food consumption and weight gain, ghrelin levels were unchanged [48] and leptin levels were either unchanged [48] or increased [28] by sleep restriction. However, as leptin levels are enhanced by food intake and correlate with the degree of obesity [38], these endocrine results are the expected consequence of the positive energy balance achieved by increased food intake and weight gain. Along the same lines, daytime leptin, ghrelin, hunger and caloric intake were unchanged after 2 nights of 4h vs. 3 nights of 8h sleep in a study that proposed ad libitum highly palatable food 1h after awakening under both conditions. In this study, food intake was increased by 60% regardless of the bedtime condition [50]. Similarly, a study that measured morning leptin levels in 136 healthy subjects (49% women, 56% African Americans) after 2 nights of baseline sleep and after 5 subsequent nights of 4h in bed, while allowing free access to food, found increased leptin levels after sleep restriction, particularly in women and in participants with elevated BMI [51].
However, two studies observed increased, rather than decreased, morning leptin levels after sleep restriction even food intake was similar in both sleep conditions; sleep restriction did not result in changes in hunger, appetite or satiety [34, 52]. Methodological differences may contribute to this discrepancy. For example, in the study by Leeuwen et al., a single assessment of satiety and leptin levels was performed at 7:30 after 5 nights of 4h in bed (bedtimes from 3:00 to 7:00) and after 5 nights of habitual sleep (bedtimes from 23:00 to 7:00) [34]. As the nocturnal elevation in leptin levels is influenced both by sleep and circadian rhythmicity [40], a shift towards the morning of the nocturnal elevation of leptin levels may have occurred due to the shifted short bedtimes, resulting in higher morning leptin levels. In the study by Omisade et al., bedtimes were restricted to 3h for only one day and leptin levels were measured only at 2 time points during daytime [52]. Finally, a recent report described the impact of 2 nights of 5h in bed on PYY, ghrelin, glucagon-like peptide-1, adiponectin and leptin in young healthy males [53]. Compared to a fully rested night (8-10 h in bed), satiety was reduced and levels of PYY, an anorexigenic peptide produced by the gastrointestinal tract in response to food intake, were lower in the sleep loss condition. The other hormones were not affected by the study conditions. Although sleep was not monitored and hormonal levels were assessed at a single time point upon awakening, it is the first report of decreased PYY levels after sleep restriction in humans, which could represent another mechanism underlying the reduced feeling of satiety consistently reported by sleep-deprived individuals.
Lastly, young healthy men and women studied on in a forced desynchrony protocol involving a 28-h sleep-wake and dark-light cycle with 4 isocaloric meals exhibited lower leptin levels when they ate and slept 12h out of phase from their usual schedule [35]. Although the relative contributions of circadian misalignment and sleep loss in such a protocol can not be unequivocally dissected, sleep efficiency was 67% with circadian disruption, compared to 84% when circadian alignment occurred, suggesting that sleep loss per se may contribute to lower leptin levels.
Evidence for a dose-response relationship between sleep duration and the neuroendocrine regulation of appetite has also been obtained. In a study that assessed the 24-h leptin profiles after 6 days of 4-h, 8-h, and 12-h bedtimes in healthy lean young men under conditions of stable caloric intake and activity levels, all characteristics of the 24-h leptin profile (overall mean, nocturnal maximum, amplitude) gradually increased from the 4-h to the 12-h bedtime condition [19] (Figure 2; panels D). These findings confirmed and extended the observations of an earlier study that assessed leptin levels at 6 time points of the 24-h cycle in volunteers studied after 7 days of 4h bedtimes and reported a decrease in peak leptin levels [54]. A dose-response relationship between amounts of sleep, hunger ratings and ghrelin levels was also reported in a study involving TSD, 4.5-h and 7-h bedtimes [55]. In this study, which involved only one night of manipulation of sleep duration, leptin levels were not affected.
Sleep Duration and Energy Expenditure
Beside the changes in neurohormones involved in the regulation of food intake, reduced energy expenditure (EE) during sleep loss could represent another mechanism contributing to the link between short sleep and increased weight consistently reported in epidemiologic studies.
Relatively few studies have evaluated the impact of sleep restriction on energy expenditure. Bosy-Westphal et al. studied 14 healthy lean and obese women after 4 nights of ∼ 5.5h in bed, by indirect calorimetry; compared to the rested condition (∼9h sleep for 2 nights), there was no change in resting EE, even when adjusted for fat-free mass or total EE [28]. In a protocol involving a more prolonged sleep restriction (14 nights of 5.5h vs. 14 nights of 8.5h in bed) in healthy overweight subjects, total EE assessed by the gold standard doubly labeled water method, resting metabolic rate assessed by indirect calorimetry, and the thermic effect of food were not affected by the bedtime condition [48]. To note, this study was conducted under sedentary conditions and the results may have been different if the subject had been allowed physical activity.
Subjects with sleep problems and/or excessive daytime sleepiness report a significant reduction in their levels of physical activity [56, 57], which could reduce activity-related EE. The only three studies that examined the impact of behavioral sleep restriction on physical activity have yielded contradictory results; the possible involvement of reduced activity-related EE in the link between short sleep and increased obesity risk remains to be determined. In comparison with a rested night (7 to >8h in bed), Schmid at al. reported decreased physical activity after 2 nights of 4h sleep [50], Brondel et al. observed increased physical activity after one night of partial sleep deprivation [46] and no change in physical activity was documented by Bosy-Westphal et al. after 2 nights of 6h in bed and 1 night of 4h in bed [28].
Thus, from evidence obtained so far, it appears that short sleep affects energy balance because of an up-regulation of orexigenic hormones and a downregulation of anorexigenic hormones associated with increased hunger and caloric intake, rather than because of a reduced EE.
Pathways Linking Sleep Loss and Increased Risk of Diabetes and Obesity
Multiple pathways are likely to mediate the adverse effect of sleep loss on the risk of obesity and diabetes. Several of these pathways interact with one another. An upregulation of the activity of orexin neurons may be a primary mechanism linking sleep deprivation and adverse metabolic effects [4, 5]. Another important mechanism, considering that brain is a major user of glucose, is brain glucose utilization, which appears to be reduced after sleep deprivation, as shown by PET studies [58].
Figure 2 illustrates the fact that sleep duration affect multiple facets of normal human physiology. The 24-h profiles of HOMA, cortisol, GH, leptin and cardiac sympathovagal balance observed in normal young men are shown after 6 days of 4h, 8h and 12h in bed. For all these variables, clear changes are observed in a dose-response relationship with sleep duration. HOMA levels post-breakfast increased from the 12-h to the 4-h in bed condition indicating a decrease in glucose tolerance and/or a decrease in SI proportional to the severity of sleep loss (Figure 2; panels A). Changes in the activity of the autonomic nervous system and of counterregulatory hormones may play a role in these alterations (Figure 2; panels B, C, and D). Panels B of Figure 2 show progressive higher values of the coefficient of autocorrelation of successive beat-to-beat intervals (rRR) with increasing amounts of sleep loss, reflecting lower levels of heart rate variability due to an elevation of cardiac sympathetic activity and/or a decrease in parasympathetic activity [59-61]. Sympathetic activation inhibits, and para-sympathetic activation stimulates, insulin release; the lack of compensatory hyperinsulinemia in response to the reduced SI associated with sleep loss may therefore be related to an alteration of the autonomic regulation of the beta-cells. In addition, sleep loss-related changes in counterregulatory hormones (increased evening cortisol levels [19, 62], extended duration of daytime elevated GH concentrations [18], and elevated ghrelin levels) also favor glucose intolerance and hyperinsulinemia [63, 64] (Figure 2; panels B and C).
Sleep loss also impacts hormones involved in appetite regulation, in the direction of promotion of food intake. For instance, Panels D of Figure 2 show that all characteristics of the 24-h leptin profile (overall mean, nocturnal maximum, amplitude) gradually increased from the 4h to the 12h bedtime, signaling the brain an unnecessary need for extra caloric intake in a state of sleep debt. Since leptin secretion is inhibited by sympathetic activity [65] and ghrelin secretion is inhibited by parasympathetic activity [66], the changes in the activity of autonomic nervous system observed with sleep loss may be involved in the simultaneous reduction of leptin and increase of ghrelin. Furthermore, insulin and leptin appear to negatively modulate the food rewarding system [67], whereas ghrelin exerts opposite effects [68]; the changes in these hormonal concentrations following sleep restriction could therefore contribute to the increased hedonic, rather than homeostatic, eating, that may be typical of short sleepers. In addition, the increased opportunity to eat, due to longer waking time, probably also plays a role in the generation of a positive energy balance in short sleepers. Reduced EE is to date a poorly explored pathway that could also link short sleep and the risk of overweight and obesity. Sleep loss is associated with sleepiness and fatigue that may result in reduced EE through decreased physical exercise but also through decreases in non-exercise activity thermogenesis.
Furthermore, sleep loss is associated with increased levels of proinflammatory cytokines and low-grade inflammation (reviewed in chapter 9 “Sleep loss and inflammation”), a condition that may predispose to insulin [69-71] and leptin resistance [72].
Finally, obesity is in itself a major risk factor for diabetes mellitus and has been shown to be crucial in the pathogenesis of sleep-disordered breathing (SDB), a reported independent risk factor for insulin resistance [73]. The detrimental effects of sleep loss are likely to be exacerbated in overweight and obese individuals.
Practice Points
Due to the deleterious impact of short sleep on glucose metabolism and appetite regulation, habitual sleep patterns and sleep disorders should be routinely assessed in clinical practice
If sleep-disordered breathing (SDB) is present in obese or diabetic patients, treat with continuous positive airway pressure (CPAP)
Obtain measures of sleep duration and quality on the night preceding diabetes screening
Monitor and ensure adequate sleep duration in weight loss programs
Research agenda
The impact of sleep loss in children, in older adults and in patients with metabolic and endocrine disorders needs to be documented
Studies are warranted to evaluate the putative therapeutic impact of bedtime extension in habitual short sleepers with metabolic conditions
Acknowledgments
Some of the research described in this article was supported by US National Institute of Health grants P01 AG-11412, R01 HL-075079, P60 DK-20595, R01 DK-0716960, R01 HL-075025 and M01 RR000055, by US Department of Defense award W81XWH-07-2-0071, by Belgian “CARE Foundation” grants, by INSERM U628, and by Claude Bernard University of Lyon, France.
Footnotes
Conflict of interest statement: The authors have no conflict of interest
Publisher's Disclaimer: This is a PDF file of an unedited manuscript that has been accepted for publication. As a service to our customers we are providing this early version of the manuscript. The manuscript will undergo copyediting, typesetting, and review of the resulting proof before it is published in its final citable form. Please note that during the production process errors may be discovered which could affect the content, and all legal disclaimers that apply to the journal pertain.
Contributor Information
Lisa Morselli, Email: lmorsell@medicine.bsd.uchicago.edu, 5841 South Maryland Ave., MC1027, Chicago, IL 60637, USA, Phone: (773) 834 8621, Fax: (773) 702 7686.
Rachel Leproult, Email: rleproul@uchicago.edu, 5841 South Maryland Ave., MC1027, Chicago, IL 60637, USA, Phone: (773) 834 7184, Fax: (773) 702 7686.
Marcella Balbo, Email: mbalbo@ospedale.al.it, Azienda Ospedaliera SS Antonio e, Biagio e Cesare Arrigo, Via Venezia 16, Alessandria, Phone: (+39)0131206339, Fax: (+39)0131206326.
Karine Spiegel, Email: Karine.spiegel@univ-lyon1.fr, INSERM /UCBL - U628, Physiologie intégrée du système, d'éveil Université Claude Bernard Lyon 1, 8 avenue Rockefeller, 69373 Lyon Cedex 08, FRANCE, Phone: +33 478 77 70 40, Fax: +33 478 77 71 50.
References
- 1.Gronfier C, Brandenberger G. Ultradian rhythms in pituitary and adrenal hormones: their relations to sleep. Sleep Med Rev. 1998;2:17–29. doi: 10.1016/s1087-0792(98)90051-x. [DOI] [PubMed] [Google Scholar]
- 2.Steiger A. Sleep and endocrinology. J Intern Med. 2003;254:13–22. doi: 10.1046/j.1365-2796.2003.01175.x. [DOI] [PubMed] [Google Scholar]
- 3.Van Cauter E. Endocrine Physiology. In: Kryger M, Roth T, Dement WC, editors. Principles and Practice of Sleep Medicine. 4rd edition. Elsevier-Saunders; Philadelphia: 2005. pp. 266–82. [Google Scholar]
- 4.Sakurai T. The neural circuit of orexin (hypocretin): maintaining sleep and wakefulness. Nat Rev Neurosci. 2007;8:171–81. doi: 10.1038/nrn2092. [DOI] [PubMed] [Google Scholar]
- 5.de Lecea L, Sutcliffe JG. The hypocretins and sleep. Febs J. 2005;272:5675–88. doi: 10.1111/j.1742-4658.2005.04981.x. [DOI] [PubMed] [Google Scholar]
- 6.National Sleep Foundation. “Sleep in America” Poll. 2008 http://www.sleepfoundation.org./sites/default/files/2008%20POLL%20SOF.PDF.
- 7.Teens and sleep; “Sleep in America” Poll. National Sleep Foundation. 2006 http://www.sleepfoundation.org/sites/default/files/2006_summary_of_findings.pdf.
- 8.Enquête. sommeil et rythme de vie. 2009:1–22. http://www.institut-sommeil-vigilance.org/documents/Presse-JNS-2009.pdf.
- 9.Enquête Sofrès/ISV. somnolence et adolescents. 2005 http://www.institut-sommeil-vigilance.org/documents/Presse-JNS-2005.pdf.
- 10.Kripke DF, Simons RN, Garfinkel L, Hammond EC. Short and long sleep and sleeping pills. Is increased mortality associated? Arch Gen Psychiatry. 1979;36:103–16. doi: 10.1001/archpsyc.1979.01780010109014. [DOI] [PubMed] [Google Scholar]
- 11.Carskadon MA, Acebo C. Regulation of sleepiness in adolescents: update, insights, and speculation. Sleep. 2002;25:606–14. doi: 10.1093/sleep/25.6.606. [DOI] [PubMed] [Google Scholar]
- 12.Kuhn E, Brodan V, Brodanova M, Rysanek K. Metabolic reflection of sleep deprivation. Act Nerv Super (Praha) 1969;11:165–74. [PubMed] [Google Scholar]
- 13.Vondra K, Brodan V, Bass A, et al. Effects of sleep deprivation on the activity of selected metabolic enzymes in skeletal muscle. Eur J Appl Physiol Occup Physiol. 1981;47:41–6. doi: 10.1007/BF00422481. [DOI] [PubMed] [Google Scholar]
- 14.VanHelder T, Symons JD, Radomski MW. Effects of sleep deprivation and exercise on glucose tolerance. Aviat Space Environ Med. 1993;64:487–92. [PubMed] [Google Scholar]
- 15.Gonzalez-Ortiz M, Martinez-Abundis E, Balcazar-Munoz BR, Pascoe-Gonzalez S. Effect of sleep deprivation on insulin sensitivity and cortisol concentration in healthy subjects. Diabetes Nutr Metab. 2000;13:80–3. [PubMed] [Google Scholar]
- 16.Schmid SM, Hallschmid M, Jauch-Chara K, et al. Sleep loss alters basal metabolic hormone secretion and modulates the dynamic counterregulatory response to hypoglycemia. J Clin Endocrinol Metab. 2007;92:3044–51. doi: 10.1210/jc.2006-2788. [DOI] [PubMed] [Google Scholar]
- 17.Spiegel K, Leproult R, Van Cauter E. Impact of sleep debt on metabolic and endocrine function. Lancet. 1999;354:1435–9. doi: 10.1016/S0140-6736(99)01376-8. [DOI] [PubMed] [Google Scholar]
- 18.Spiegel K, Leproult R, Colecchia EF, et al. Adaptation of the 24-h growth hormone profile to a state of sleep debt. Am J Physiol Regul Integr Comp Physiol. 2000;279:R874–83. doi: 10.1152/ajpregu.2000.279.3.R874. [DOI] [PubMed] [Google Scholar]
- 19.Spiegel K, Leproult R, L'Hermite-Baleriaux M, et al. Leptin levels are dependent on sleep duration: relationships with sympathovagal balance, carbohydrate regulation, cortisol, and thyrotropin. J Clin Endocrinol Metab. 2004;89:5762–71. doi: 10.1210/jc.2004-1003. [DOI] [PubMed] [Google Scholar]
- 20.Garcia G, Freeman R, Supiano M, et al. Glucose metabolism in older adults: a study including subjects more than 80 years of age. J Am Geriatr Soc. 1997;45:813–7. doi: 10.1111/j.1532-5415.1997.tb01507.x. [DOI] [PubMed] [Google Scholar]
- 21.Bergman RN. Minimal model: perspective from 2005. Horm Res. 2005;64 3:8–15. doi: 10.1159/000089312. [DOI] [PubMed] [Google Scholar]
- 22.Palmer ND, Langefeld CD, Campbell JK, et al. Genetic mapping of disposition index and acute insulin response loci on chromosome 11q. The Insulin Resistance Atherosclerosis Study (IRAS) Family Study. Diabetes. 2006;55:911–8. doi: 10.2337/diabetes.55.04.06.db05-0813. [DOI] [PubMed] [Google Scholar]
- 23.Lyssenko V, Almgren P, Anevski D, et al. Predictors of and longitudinal changes in insulin sensitivity and secretion preceding onset of type 2 diabetes. Diabetes. 2005;54:166–74. doi: 10.2337/diabetes.54.1.166. [DOI] [PubMed] [Google Scholar]
- 24.Xiang AH, Peters RK, Kjos SL, et al. Effect of pioglitazone on pancreatic beta-cell function and diabetes risk in Hispanic women with prior gestational diabetes. Diabetes. 2006;55:517–22. doi: 10.2337/diabetes.55.02.06.db05-1066. [DOI] [PMC free article] [PubMed] [Google Scholar]
- 25.Spiegel K, Knutson K, Leproult R, et al. Sleep loss: a novel risk factor for insulin resistance and Type 2 diabetes. J Appl Physiol. 2005;99:2008–19. doi: 10.1152/japplphysiol.00660.2005. [DOI] [PubMed] [Google Scholar]
- 26.Leproult R, Van Cauter E, editors. Marked decreased insulin sensitivity and increased evening cortisol levels following one week of partial sleep deprivation. 12th meeting of the European NeuroEndocrine Association (ENEA); Athens, Greece. 2006. [Google Scholar]
- 27.Buxton O, Pavlova M, Reid E, et al. Sleep restriction for one week reduces insulin sensitivity measured using the eugylcemic hyperinsulinemic clamp technique. Sleep. 2008;31(Supplement):A107. [Google Scholar]
- 28.Bosy-Westphal A, Hinrichs S, Jauch-Chara K, et al. Influence of partial sleep deprivation on energy balance and insulin sensitivity in healthy women. Obes Facts. 2008;1:266–73. doi: 10.1159/000158874. [DOI] [PMC free article] [PubMed] [Google Scholar]
- 29.Zielinski MR, Kline CE, Kripke DF, et al. No effect of 8-week time in bed restriction on glucose tolerance in older long sleepers. J Sleep Res. 2008;17:412–9. doi: 10.1111/j.1365-2869.2008.00673.x. [DOI] [PMC free article] [PubMed] [Google Scholar]
- 30.Knutson KL, Leproult R. Apples to oranges: comparing long sleep to short sleep. J Sleep Res. 19:118. doi: 10.1111/j.1365-2869.2009.00770.x. [DOI] [PubMed] [Google Scholar]
- 31.Schmid SM, Jauch-Chara K, Hallschmid M, Schultes B. Mild sleep restriction acutely reduces plasma glucagon levels in healthy men. J Clin Endocrinol Metab. 2009;94:5169–73. doi: 10.1210/jc.2009-0969. [DOI] [PubMed] [Google Scholar]
- 32.Nedeltcheva AV, Kessler L, Imperial J, Penev PD. Exposure to recurrent sleep restriction in the setting of high caloric intake and physical inactivity results in increased insulin resistance and reduced glucose tolerance. J Clin Endocrinol Metab. 2009;94:3242–50. doi: 10.1210/jc.2009-0483. [DOI] [PMC free article] [PubMed] [Google Scholar]
- 33.Donga E, van Dijk M, van Dijk JG, et al. A Single Night of Partial Sleep Deprivation Induces Insulin Resistance in Multiple Metabolic Pathways in Healthy Subjects. J Clin Endocrinol Metab. 2010 doi: 10.1210/jc.2009-2430. [DOI] [PubMed] [Google Scholar]
- 34.van Leeuwen WM, Hublin C, Sallinen M, et al. Prolonged sleep restriction affects glucose metabolism in healthy young men. Int J Endocrinol. 2010:108641. doi: 10.1155/2010/108641. [DOI] [PMC free article] [PubMed] [Google Scholar]
- 35.Scheer FA, Hilton MF, Mantzoros CS, Shea SA. Adverse metabolic and cardiovascular consequences of circadian misalignment. Proc Natl Acad Sci U S A. 2009;106:4453–8. doi: 10.1073/pnas.0808180106. [DOI] [PMC free article] [PubMed] [Google Scholar]
- 36.Ahima RS, Saper CB, Flier JS, Elmquist JK. Leptin regulation of neuroendocrine systems. Front Neuroendocrinol. 2000;21:263–307. doi: 10.1006/frne.2000.0197. [DOI] [PubMed] [Google Scholar]
- 37.Kolaczynski JW, Considine RV, Ohannesian J, et al. Responses of leptin to short-term fasting and refeeding in humans: a link with ketogenesis but not ketones themselves. Diabetes. 1996;45:1511–5. doi: 10.2337/diab.45.11.1511. [DOI] [PubMed] [Google Scholar]
- 38.Chin-Chance C, Polonsky KS, Schoeller DA. Twenty-four-hour leptin levels respond to cumulative short-term energy imbalance and predict subsequent intake. J Clin Endocrinol Metab. 2000;85:2685–91. doi: 10.1210/jcem.85.8.6755. [DOI] [PubMed] [Google Scholar]
- 39.Schoeller DA, Cella LK, Sinha MK, Caro JF. Entrainment of the diurnal rhythm of plasma leptin to meal timing. J Clin Invest. 1997;100:1882–7. doi: 10.1172/JCI119717. [DOI] [PMC free article] [PubMed] [Google Scholar]
- 40.Simon C, Gronfier C, Schlienger JL, Brandenberger G. Circadian and ultradian variations of leptin in normal man under continuous enteral nutrition: relationship to sleep and body temperature. J Clin Endocrinol Metab. 1998;83:1893–9. doi: 10.1210/jcem.83.6.4864. [DOI] [PubMed] [Google Scholar]
- 41.Mullington JM, Chan JL, Van Dongen HP, et al. Sleep loss reduces diurnal rhythm amplitude of leptin in healthy men. J Neuroendocrinol. 2003;15:851–4. doi: 10.1046/j.1365-2826.2003.01069.x. [DOI] [PubMed] [Google Scholar]
- 42.Havel PJ. Peripheral signals conveying metabolic information to the brain: short-term and long-term regulation of food intake and energy homeostasis. Exp Biol Med (Maywood) 2001;226:963–77. doi: 10.1177/153537020122601102. [DOI] [PubMed] [Google Scholar]
- 43.Dzaja A, Dalal MA, Himmerich H, et al. Sleep enhances nocturnal plasma ghrelin levels in healthy subjects. Am J Physiol Endocrinol Metab. 2004;286:E963–7. doi: 10.1152/ajpendo.00527.2003. [DOI] [PubMed] [Google Scholar]
- 44.Spiegel K, Tasali E, Penev P, Van Cauter E. Sleep curtailment in healthy young men is associated with decreased leptin levels, elevated ghrelin levels, and increased hunger and appetite. Ann Intern Med. 2004;141:846–50. doi: 10.7326/0003-4819-141-11-200412070-00008. [DOI] [PubMed] [Google Scholar]
- 45.Dinges DF, Chugh DK. Physiological correlates of sleep deprivation. In: Kinney JM, Tucker HN, editors. Physiology, Stress, and Malnutrition: Functional Correlates, Nutritional Intervention. Philadelphia: Lippincott-Raven Publishers; 1997. [Google Scholar]
- 46.Brondel L, Romer MA, Nougues PM, et al. Acute partial sleep deprivation increases food intake in healthy men. Am J Clin Nutr. 2010;91:1550–9. doi: 10.3945/ajcn.2009.28523. [DOI] [PubMed] [Google Scholar]
- 47.Tasali E, Leproult R, Spiegel K. Reduced sleep duration or quality: relationships with insulin resistance and type 2 diabetes. Prog Cardiovasc Dis. 2009;51:381–91. doi: 10.1016/j.pcad.2008.10.002. [DOI] [PubMed] [Google Scholar]
- 48.Nedeltcheva AV, Kilkus JM, Imperial J, et al. Sleep curtailment is accompanied by increased intake of calories from snacks. Am J Clin Nutr. 2009;89:126–33. doi: 10.3945/ajcn.2008.26574. [DOI] [PMC free article] [PubMed] [Google Scholar]
- 49.Raynor HA, Wing RR. Package unit size and amount of food: do both influence intake? Obesity (Silver Spring) 2007;15:2311–9. doi: 10.1038/oby.2007.274. [DOI] [PubMed] [Google Scholar]
- 50.Schmid SM, Hallschmid M, Jauch-Chara K, et al. Short-term sleep loss decreases physical activity under free-living conditions but does not increase food intake under time-deprived laboratory conditions in healthy men. Am J Clin Nutr. 2009;90:1476–82. doi: 10.3945/ajcn.2009.27984. [DOI] [PubMed] [Google Scholar]
- 51.Simpson NS, Banks S, Dinges DF. Sleep Restriction Is Associated With Increased Morning Plasma Leptin Concentrations, Especially in Women. Biol Res Nurs. 2010 doi: 10.1177/1099800410366301. [DOI] [PMC free article] [PubMed] [Google Scholar]
- 52.Omisade A, Buxton OM, Rusak B. Impact of acute sleep restriction on cortisol and leptin levels in young women. Physiol Behav. 2010;99:651–6. doi: 10.1016/j.physbeh.2010.01.028. [DOI] [PubMed] [Google Scholar]
- 53.Magee CA, Huang XF, Iverson DC, Caputi P. Acute sleep restriction alters neuroendocrine hormones and appetite in healthy male adults. Sleep and Biological Rhythms. 2009;7:125–7. [Google Scholar]
- 54.Guilleminault C, Powell NB, Martinez S, et al. Preliminary observations on the effects of sleep time in a sleep restriction paradigm. Sleep Med. 2003;4:177–84. doi: 10.1016/s1389-9457(03)00061-3. [DOI] [PubMed] [Google Scholar]
- 55.Schmid SM, Hallschmid M, Jauch-Chara K, et al. A single night of sleep deprivation increases ghrelin levels and feelings of hunger in normal-weight healthy men. J Sleep Res. 2008 doi: 10.1111/j.1365-2869.2008.00662.x. [DOI] [PubMed] [Google Scholar]
- 56.Weaver TE, Laizner AM, Evans LK, et al. An instrument to measure functional status outcomes for disorders of excessive sleepiness. Sleep. 1997;20:835–43. [PubMed] [Google Scholar]
- 57.Briones B, Adams N, Strauss M, et al. Relationship between sleepiness and general health status. Sleep. 1996;19:583–8. doi: 10.1093/sleep/19.7.583. [DOI] [PubMed] [Google Scholar]
- 58.Thomas M, Sing H, Belenky G, et al. Neural basis of alertness and cognitive performance impairments during sleepiness. I. Effects of 24 h of sleep deprivation on waking human regional brain activity. J Sleep Res. 2000;9:335–52. doi: 10.1046/j.1365-2869.2000.00225.x. [DOI] [PubMed] [Google Scholar]
- 59.Kamen PW, Krum H, Tonkin AM. Poincaré plots of heart rate variability allows quantitive display of parasympathetic nervous activity in humans. Clin Sci. 1996;91:201–8. doi: 10.1042/cs0910201. [DOI] [PubMed] [Google Scholar]
- 60.Otzenberger H, Gronfier C, Simon C, et al. Dynamic heart rate variability: a tool for exploring sympathovagal balance continuously during sleep in men. Am J Physiol. 1998;275:H946–50. doi: 10.1152/ajpheart.1998.275.3.H946. [DOI] [PubMed] [Google Scholar]
- 61.Burgess HJ, Penev PD, Schneider R, Van Cauter E. Estimating cardiac autonomic activity during sleep: impedance cardiography, spectral analysis, and Poincare plots. Clin Neurophysiol. 2004;115:19–28. doi: 10.1016/s1388-2457(03)00312-2. [DOI] [PubMed] [Google Scholar]
- 62.Leproult R, Copinschi G, Buxton O, Van Cauter E. Sleep loss results in an elevation of cortisol levels the next evening. Sleep. 1997;20:865–70. [PubMed] [Google Scholar]
- 63.Van Cauter E, Polonsky KS, Scheen AJ. Roles of circadian rhythmicity and sleep in human glucose regulation. Endocr Rev. 1997;18:716–38. doi: 10.1210/edrv.18.5.0317. [DOI] [PubMed] [Google Scholar]
- 64.Plat L, Leproult R, L'Hermite-Baleriaux M, et al. Metabolic effects of short-term elevations of plasma cortisol are more pronounced in the evening than in the morning. J Clin Endocrinol Metab. 1999;84:3082–92. doi: 10.1210/jcem.84.9.5978. [DOI] [PubMed] [Google Scholar]
- 65.Rayner DV, Trayhurn P. Regulation of leptin production: sympathetic nervous system interactions. J Mol Med. 2001;79:8–20. doi: 10.1007/s001090100198. [DOI] [PubMed] [Google Scholar]
- 66.van der Lely AJ, Tschop M, Heiman ML, Ghigo E. Biological, physiological, pathophysiological, and pharmacological aspects of ghrelin. Endocr Rev. 2004;25:426–57. doi: 10.1210/er.2002-0029. [DOI] [PubMed] [Google Scholar]
- 67.Davis JF, Choi DL, Benoit SC. Insulin, leptin and reward. Trends Endocrinol Metab. 2010;21:68–74. doi: 10.1016/j.tem.2009.08.004. [DOI] [PMC free article] [PubMed] [Google Scholar]
- 68.Lutter M, Nestler EJ. Homeostatic and hedonic signals interact in the regulation of food intake. J Nutr. 2009;139:629–32. doi: 10.3945/jn.108.097618. [DOI] [PMC free article] [PubMed] [Google Scholar]
- 69.Vgontzas AN, Zoumakis E, Bixler EO, et al. Adverse effects of modest sleep restriction on sleepiness, performance, and inflammatory cytokines. J Clin Endocrinol Metab. 2004;89:2119–26. doi: 10.1210/jc.2003-031562. [DOI] [PubMed] [Google Scholar]
- 70.van Leeuwen WM, Lehto M, Karisola P, et al. Sleep restriction increases the risk of developing cardiovascular diseases by augmenting proinflammatory responses through IL-17 and CRP. PLoS One. 2009;4:e4589. doi: 10.1371/journal.pone.0004589. [DOI] [PMC free article] [PubMed] [Google Scholar]
- 71.Meier-Ewert HK, Ridker PM, Rifai N, et al. Effect of sleep loss on Creactive protein, an inflammatory marker of cardiovascular risk. J Am Coll Cardiol. 2004;43:678–83. doi: 10.1016/j.jacc.2003.07.050. [DOI] [PubMed] [Google Scholar]
- 72.Chen K, Li F, Li J, et al. Induction of leptin resistance through direct interaction of C-reactive protein with leptin. Nat Med. 2006;12:425–32. doi: 10.1038/nm1372. [DOI] [PubMed] [Google Scholar]
- 73.Spiegel K, Tasali E, Leproult R, Van Cauter E. Effects of poor and short sleep on glucose metabolism and obesity risk. Nat Rev Endocrinol. 2009;5:253–61. doi: 10.1038/nrendo.2009.23. [DOI] [PMC free article] [PubMed] [Google Scholar]
- 74.Tasali E, Broussard J, Day A, et al. Sleep curtailment in healthy young adults is associated with increased ad lib food intake. 23rd Annual Meeting of the Associated-Professional-Sleep-Societies; Seattle, WA, USA. 2009. [Google Scholar]