Abstract
The carotenoid astaxanthin forms novel metal ion complexes with Ca2+, Zn2+ and Fe2+. MS and NMR measurements indicate that the two oxygen atoms on the terminal cyclohexene ring of astaxanthin chelate the metal to form 1:1 complexes with Ca2+ and Zn2+ at low salt concentrations < 0.2 mM. The stability constants of these complexes increased by a factor of 85 upon changing the solvent from acetonitrile to ethanol for Ca2+ and by a factor of 7 for Zn2+ as a consequence of acetonitrile being a part of the complex. Optical studies showed that at high concentrations (> 0.2 mM) of salt 2:1 metal:astaxanthin complexes were formed in ethanol. In the presence of Ca2+ and Zn2+ salts the lifetime of the radical cation and dication formed electrochemically decreased relative to that of the carotenoid neutral radical. DFT calculations showed that the deprotonation of the radical cation at the carbon C3 position resulted in the lowest energy neutral radical while proton loss at the C5, C9 or C13 methyl groups was less favorable. Pulsed EPR measurements were carried out on UV-produced radicals of astaxanthin supported on silica-alumina, MCM-41 or Ti-MCM-41. The pulsed EPR measurements detected the radical cation and neutral radicals formed by proton loss at 77 K from the C3, C5, C9, and C13-methyl groups and a radical anion formed by deprotonation of the neutral radical at C3. There was more than an order of magnitude increase in the concentration of radicals on Ti-MCM-41 relative to MCM-41, and the radical cation concentration exceeded that of the neutral radicals.
Introduction
At high light intensities photosynthetic organisms gather more light than they need and quench what is not needed in order to avoid unwanted photochemical reactions. For instance, the antenna of photosystem II (PS II) in plants contains the trimetric light harvesting complex (LHC II) as the major light harvesting complex. Under intense light irradiation, nearly all the absorbed energy is not needed and is dissipated harmlessly without causing photochemical damage.1,2
To further understand this process, the quenching role of the different carotenoids in the trimeric major LHC II complex has been investigated. It was found3 that zeaxanthin and lutein have a direct role in quenching the chlorophyll excited state, while violaxanthin and 9′-cis neoxanthin do not directly contribute to quenching. A proposed quenching mechanism among several involves a charge-transfer state4 between zeaxanthin (Zea) and chlorophyll (Chl). For separations up to approx 5 Å, the charge-transfer state quenches Chl excited singlet states, transiently producing Zea•+ and Chl•−. The excess energy is dissipated through the C-C vibrational modes of Zea•+. This charge-transfer quenching mechanism has also been observed in LHC II minor complexes CP24, CP26 and CP 29.5,6,7 Recently, an additional step has been proposed8: proton loss from Zea•+ to form the #Zea• neutral radical (# indicates proton loss) which is a very efficient quencher of excited states. A similar quenching reaction could occur with lutein because proton loss can readily occur from its terminal rings which lie in the hydrophilic lumen and stroma regions, but not with 9′-cis neoxanthin or violaxanthin whose terminal rings can not readily lose a proton. This proton loss in the lumen/stroma regions at pH 4 to 7 is possible because of the pKa of carotenoid radicals lies between 4 and 7.
We now have extended our study to astaxanthin, a carotenoid similar to zeaxanthin with a keto group in addition to the OH on the terminal cyclohexene rings. The two adjacent oxygen atoms on the cyclohexene ring permit formation of stable complexes with metal ions as seen with hydroxyl substituted quinones and o-quinols.9,10,11 The unusual metal complexing ability may be an important feature of astaxanthin in some organisms. For example, in some unicellular green algae, astaxanthin accumulates in huge amount (up to 30 mg/g) under high light conditions, often in the presence of excess metal ions.12,13,14,15,16 This accumulation is generally thought15 to be a survival strategy of the algae under photooxidative and salt stress. Under stress Haematococcus pluvialis accumulates 1% of cell mass as carotenoids, 1% iron, 1% magnesium, 1% iron and 2% calcium.17 The 1% carotenoid fraction consists of 70% monoesters of astaxanthin, 10% diesters of astaxanthin and 5% astaxanthin, with approximately 5% each of lutein, canthaxanthin and β-carotene.
The astaxanthin cyclohexene ring has a structure similar to many α-hydroxy-ketones and hydroxy quinones which posses high biological activity, including the ability to form chelate complexes with metal ions. The novel ability of astaxanthin to interact with metals might be responsible for the inhibition of calcium-induced lens turbidity by this carotenoid.18 We examine here the formation of complexes between astaxanthin and divalent metal ions (Ca, Zn, Cu, Fe), and their effect on the photoinduced electron transfer reaction.
Experimental Section
Chemicals and samples preparation
Astaxanthin purchased form Sigma (99%) was stored at −14 °C in a desiccator containing drierite. The sample purity was determined by 1H NMR (360 MHz, CDCl3) and TLC analysis. No unaccounted NMR lines were observed and the purity was estimated to be better than 98%.
Methylene chloride (CH2Cl2) (Aldrich, anhydrous), acetonitrile (CH3CN) (Aldrich, anhydrous), ethanol (C2H5OH) (Aldrich, anhydrous), were stored under nitrogen in a dry box and used without further purification. The deuterated solvents, CDCl3 (Cambridge Isotope Laboratories), CD3CN (Aldrich) and C2D5OD (anhydrous, Cambridge Isotope Laboratories), were used as supplied. The hydrated metal salts, Ca(ClO4)2, Zn(ClO4)2 and Fe(ClO4)2 were purchased from Strem Chemicals, Alfa Aesar and Aldrich, respectively. Anhydrous Ca(ClO4)2 was prepared from the hydrate by heating at 600 K for a few hours19. Anhydrous Zn(ClO4)2 was prepared from the hydrate by heating at 400 K for a few hours under vacuum.20 Anhydrous Fe(ClO4)2 was attempted by heating a sample of the hydrated compounds, however decomposition occurred and FeCl2 had to be used when anhydrous conditions were needed. FeCl2 98% was purchased from Aldrich and used as supplied.
The siliceous material MCM-41 was previously prepared in our lab following the procedure of Beck et al.21 Ti-substituted MCM-41 (Ti-MCM-41) was prepared as previously described.22 Silica-alumina (Aldrich, Al2O3 = 13%) was activated by heating at 550 °C for 5 h in air in an open ceramic “boat,” then cooled to 50 °C and stored in a desiccator. Ti-MCM-41 and MCM-41 were activated by heating at 360°C for 12 hours in air in a quartz EPR tube to remove OH− ions and water adsorbed on the surface. It was cooled to room temperature and then the carotenoid solution added to the sample in the presence of an inert gas and the sample tube sealed.
Carotenoid solutions in CH2Cl2 (10−2 to 10−3 M) were degassed in 4 mm quartz EPR tubes by three freeze-pump-thaw cycles. An appropriate amount of fresh activated silica-alumina was then added to the carotenoid solution in the EPR tube. The solvent was evaporated under reduced pressure, then the tube was evacuated and sealed. EPR samples were stored at 77 K.
Apparatus
Optical absorption spectra in the range 300 to 1000 nm were recorded with a double beam Shimadzu UV-visible 1601 spectrophotometer (190–1100 nm). NMR spectra were recorded with a Bruker AV-360 spectrometer. The mass spectra were taken on a Bruker HCT ultra PTM Discovery System using the electrospray ionization (ESI), positive and negative modes. The negative mode showed only salt fragments. Initially concentrated solutions (0.1 mM carotenoid and about 1mM of salt) were prepared and then the solution was diluted by a factor of 10. Mass spectra were taken for the diluted solution and the positive mode showed the complex formation.
EPR and ENDOR Measurements
Pulsed ENDOR experiments were carried out with a Bruker ELEXSYS E-680W/X FT/CW pulse X-band EPR spectrometer with an ENI A-500 RF power amplifer using the Mims (π/2−τ−π/2−T−π/2−τ−echo) pulse sequences with a RF π-pulse applied during the delay time T. 23
Pulsed ENDOR simulations were performed using the SimBud/SpecLab programs24 using hyperfine coupling tensors obtained from DFT calculations. Simulations of the individual couplings were summed and processed using the SpecLab program. CW ENDOR measurements were recorded at 130 K using an ELEXSYS-560 X-band CW ENDOR spectrometer.
Cyclic voltammetry (CV) was carried out using the Bio Analytical Systems BAS-1OOW electrochemical analyzer. The working electrode was platinum with 1.6 mm diameter. The auxiliary electrode was a platinum wire, and the reference electrode was saturated calomel electrode. All solutions were prepared in a dry box under a nitrogen atmosphere. The CV cell containing the solution was assembled in the dry box and sealed. The assembled cell was then removed from the dry box and the electrodes attached for CV measurements. Except as specifically noted, the dichloromethane solutions contain 1 mM of astaxanthin and 0.1 M of tetrabutyl- ammonium hexafluorophosphate (TBAHFP) as the supporting electrolyte.
DFT Calculations
All DFT calculations were done with the Gaussian 03 program package25 on the Cray XD1 computer at the Alabama Supercomputer Center. Geometries were optimized at the B3LYP/6-31G** level,26,27 which we have previously shown28 to be suitable for predicting the geometry of β-carotene-based radicals. Single point calculations at these geometries were used to predict ENDOR hyperfine couplings at the B3LYP level with the TZP basis set from the Ahlrich’s group.29 This basis set has been shown to give good NMR chemical shifts30 and EPR parameters that agree well with the experimental data for carotenes.8,31 The proton hyperfine couplings calculated with this method are within 0.5 MHz of the experimental couplings, whereas other levels of theory give values that differ by as much as a factor of 2.31 The unpaired spin densities were obtained using the AGUI interface (Semichem, Inc.)32 from the wave functions and spin densities produced by Gaussian 03. The unpaired spin density is defined as the difference in the alpha and beta spin densities.
Results
NMR and MS measurements
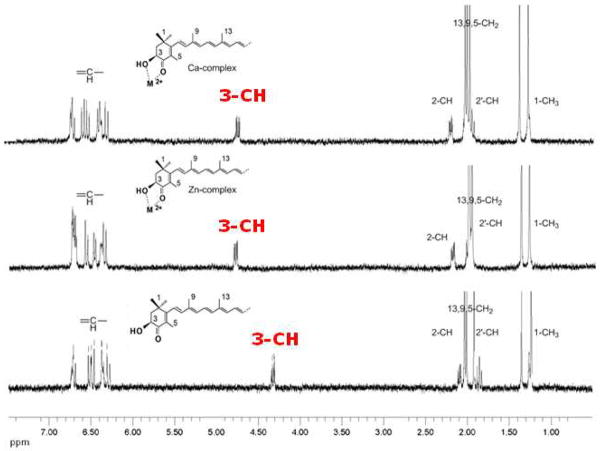
Complex formation between carotenoid astaxanthin and the divalent metal ions Ca2+ and Zn2+ in ethanol and acetonitrile solutions was clearly observed in the 1H NMR spectra (360 MHz) of astaxanthin in the absence and in the presence of 30 mM Ca(ClO4)2 or Zn(ClO4)2 (Figure 1). The maximum change in chemical shift was observed for the 3-CH proton nearest to the OH group. For the calcium and zinc complexes these changes are +0.4 and +0.5 ppm respectively in ethanol solution. Small changes were detected for other protons of the cyclohexene ring: 0.10 – 0.15 ppm for the 2-CH protons and 0.05 – 0.10 ppm for the 5-CH3 protons (see Tables 1 and 2).
Figure 1.
1H NMR (360 MHz) spectra of 1 mM astaxanthin in ethanol in the absence and in the presence of 30 mM Ca(ClO4)2 or Zn(ClO4)2 salts at room temperature.
Table 1.
1H NMR (360 MHz) chemical shifts (in ppm) of astaxanthin (AST) protons in acetonitrile in the absence and in the presence of 30 mM Ca(ClO4)2 or Zn(ClO4)2.
| 3-CH | 1-CH3 | 2-CH2 | 5-CH3 | 9-CH3 | 13-CH3 | =CH- | |
|---|---|---|---|---|---|---|---|
| Pure AST | 4.31 | 1.21, 1.34 | 2.10, 1.76 | 1.90 | 2.02 | 2.03 | 6.36–6.67 |
| AST+Ca2+ | 4.71(+0.3) | 1.26(+0.05) | 2.15 (+0.05) | 1.96 (+0.06) | 2.02 | 2.04 (+0.01) | 6.36–6.77 |
| AST+Zn2+ | 4.70 (+0.29) | 1.30 (+0.09) | 2.18 (+0.08) | 1.97 (+0.07) | 2.02 | 2.05 (+0.02) | 6.39–6.78 |
Table 2.
1H NMR (360 MHz) chemical shifts (in ppm) of astaxanthin (AST) protons in ethanol in the absence and in the presence of 30 mM Ca(ClO4)2 or Zn(ClO4)2.
| 3-CH | 1-CH3 | 2-CH2 | 5-CH3 | 9-CH3 | 13-CH3 | =CH- | |
|---|---|---|---|---|---|---|---|
| Pure AST | 4.32 | 1.24, 1.35 | 2.09, 1.86 | 1.92 | 2.01 | 2.03 | 6.28–6.71 |
| AST+Ca2+ | 4.72 (+0.4) | 1.28 (+0.04) 1.38 (+0.03) |
2.19 (+0.10) 1.95 (+0.09) |
1.97 (+0.05) | 2.00 (−0.01) | 2.03 | 6.27–6.72 |
| AST+Zn2+ | 4.82 (+0.5) | 1.34 (+0.10) 1.43 (+0.08) |
2.24 (+0.15) 2.06 (+0.20) |
2.02 (+0.10) | 2.05 (+0.04) | 2.05 (+0.02) | 6.36–6.75 |
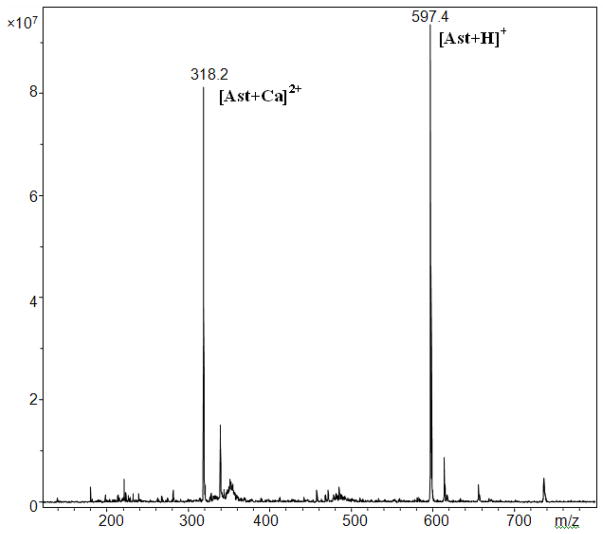
These observations of complex formation were supported by positive mode ESI MS spectra of astaxanthin in the presence of Ca(ClO4)2 or Zn(ClO4)2 or FeCl2 in acetonitrile. Peaks with m/z = 318.2 (318.2 expected) [Ast+Ca]2+ and m/z = 597.4 (597.4 expected) [Ast+H]+ were detected in the presence of Ca(ClO4)2 (Figure 2). The corresponding peaks for the zinc and iron complexes with 1:1 stoichiometry with m/z = 330.1 (330.2 expected) [Ast+Zn]2+ and m/z = 326.0 (236.2 expected) [Ast+Fe]2+ were also detected in the presence of Zn(ClO4)2 and FeCl2, respectively. These measurements show that at low salt concentration a 1:1 astaxanthin to metal ion complex is formed at the 3-CH proton nearest to the OH group.
Figure 2.
ESI MS spectrum of astaxanthin in the presence of Ca(ClO4)2 in acetonitrile. The main peaks correspond to m/z = 318.2 [Ast+Ca]2+ and m/z = 597.4 [Ast+H]+. The complex was first prepared with carotenoid concentration of 0.1 mM with excess of the salt, and then was dissolved by a factor of 10 to obtain a good signal of the spectrum.
Optical study
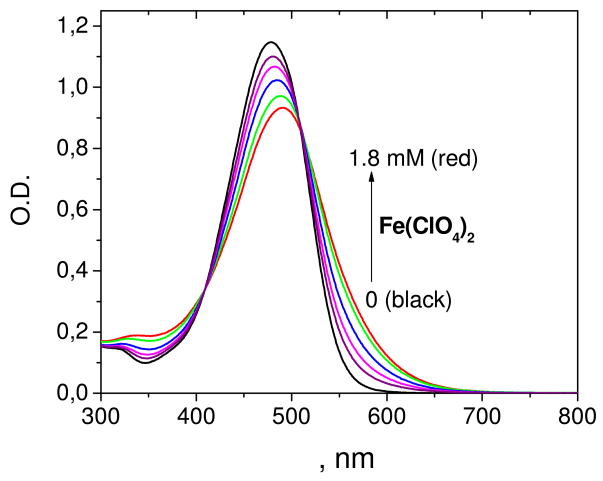
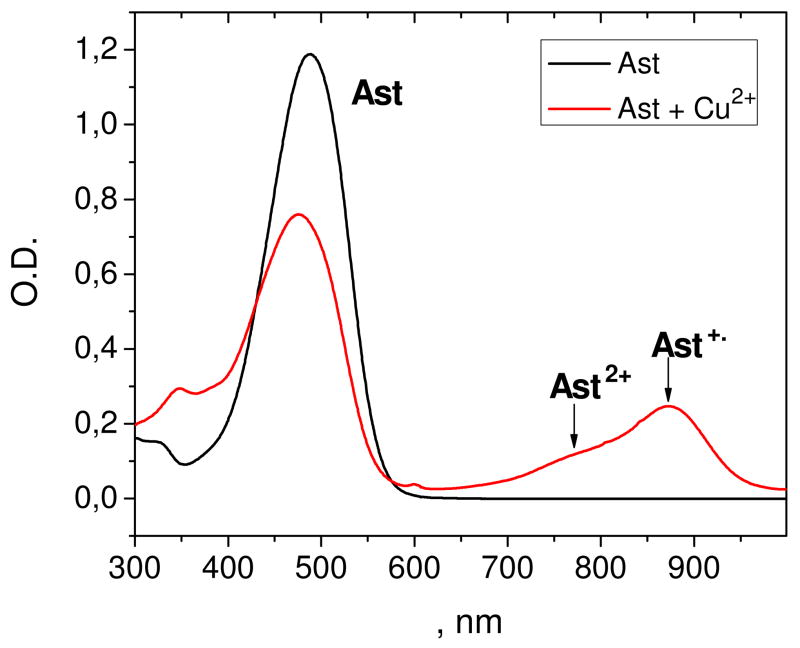
Stability constants of the astaxanthin chelate complexes with different divalent metal ions (Ca2+, Zn2+, Cu2+, Fe2+) were measured optically in polar solvents, ethanol and acetonitrile. These metal ions produced significant changes in the astaxanthin absorption spectra. The stability constant and stoichiometry of the complex were deduced from the dependence of the optical density at fixed wavelength on the salt concentration. The astaxanthin absorption maximum shifts in the presence of Fe(ClO4)2 from 480 nm (pure carotenoid) to 492 nm (complex) simultaneously with the appearance of a shoulder at 520–600 nm (Figure 3). Similar changes were detected for the Ca and Zn complexes. In the case of Cu2+ ions, a different mechanism is responsible for the optical changes. Electron transfer from carotenoid to metal ion occurs with the formation of the astaxanthin radical cation. The radical cation was clearly observed at 878 nm in methylene chloride solution where carotenoid radical cations are known to have high stability (Figure 4). The red shift of the absorption maximum accompanied by a decrease in intensity and the appearance of the characteristic “cis” peak at 350 nm point to the formation of cis-isomers of astaxanthin via an electron transfer mechanism.33
Figure 3.
Optical absorption spectra of 0.01 mM astaxanthin in ethanol in the presence of different concentrations of Fe(ClO4)2.
Figure 4.
Optical absorption spectra of 0.01 mM astaxanthin in CH2Cl2 in the presence of 0.01 mM CuCl2.
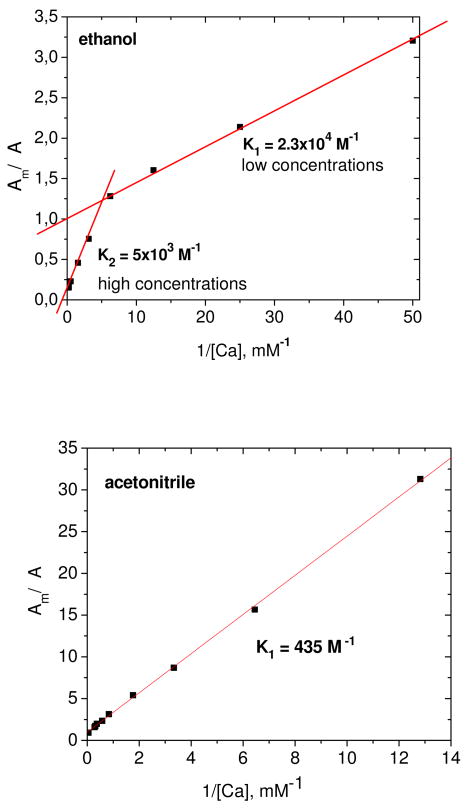
The stability constants and stoichiometry of the astaxanthin metal complexes were determined using a Benesi-Hildebrant plot of the astaxanthin optical density at 550 nm as a function of salt concentration [M] (see Figure 5 for a typical example):
Figure 5.
Benesi-Hildebrant plots of astaxanthin optical density in ethanol and acetonitrile at 550 nm on Ca(ClO4)2 salt concentration.
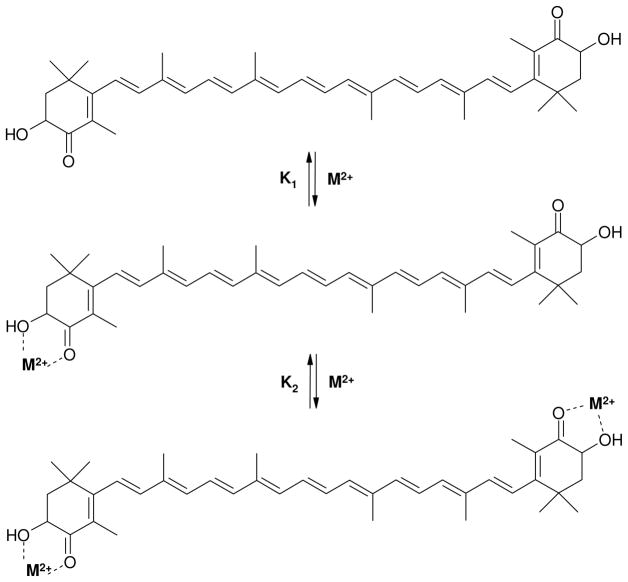
Here ΔA is the change in optical density, A = ΔAmax, and K is the stability constant of the complex. In some cases the concentration dependence was not a linear function of 1/[M]n for 1:1 (n = 1) or 1:2 (n = 2) complexes. We suggest that 1:2 complexes form in two steps with different equilibrium constants K1 and K2 (Scheme 1).
Scheme 1.
Stability constants K1 and K2 for the complexation reactions of astaxanthin with metal ions
The stability constants for all systems are listed in Table 3. In general, the stability constants K1 for the complex with 1:1 stoichiometry are larger than the K2. At concentrations below 0.2 mM of the free metal ion the complex of astaxanthin with metal ions exists mainly with 1:1 stoichiometry in ethanol. The stability constants in ethanol are larger than in acetonitrile solution. We suggest that this difference might be due to solvation effect of acetonitrile and involvement of CH3CN molecules in the complex as was found for o-quinones.34 In a study of the complex formed between o-quinones and zinc chloride or bismuth trichloride in nonaqueous media35 it was found that two molecules of CH3CN were part of the 1:1 o-quinone-metal complex.34 With CH3NO2 as solvent, the complex was inert to CH3NO2 because the metal chloride behaves as a nonelectrolyte and the donor strength of CH3CN is larger than CH3NO2. It is well known that the partial charge on the metal atom is one of the factors controlling the complex formation.34 Based on these studies, the low stability constants for complexes of astaxanthin in the presence of CH3CN and the large stability constants in the presence of ethanol could be rationalized if CH3CN was part of the complex while ethanol was not.
Table 3.
Stability constants of astaxanthin complexes with metal ions in ethanol and acetonitrile. Experimental and fitting error is about 10%.
| Salt | Ca(ClO4)2 | Zn(ClO4)2 | Fe(ClO4)2 |
|---|---|---|---|
| Acetonitrile | K1 = 270 M−1 | K1 = 435 M−1 | No complex |
| Ethanol | K1 = 23000
M−1 K2 = 5000 M−1 |
K1 = 3000
M−1 K2 = 1300 M−1 |
K1 = 3000 M−1 |
CV measurements
The cyclic voltammetry (CV) technique was used to examine the effect of complexation with the metal ions on a) the lifetime of astaxanthin radical cation and dication, and b) the first and second oxidation potentials. CV measurements of carotenoids are always difficult because the slightest trace (μM) of water will cause irreversible CV to occur due to decomposition of the radical cation and dication.36,37
It has been established that the ideal solvent is anhydrous CH2Cl2 where traces of HCl have been neutralized. Samples are prepared and CV cells assembled in an inert dry box to avoid any moisture and air contamination. To determine the absolute values of the oxidation potential extensive and careful CV measurements are normally carried out with CH2Cl2 as the solvent and CV recorded over 5 orders of scan rate.38 A computer fit to the CV spectra as a function of scan rate determines an oxidation potential versus SCE.
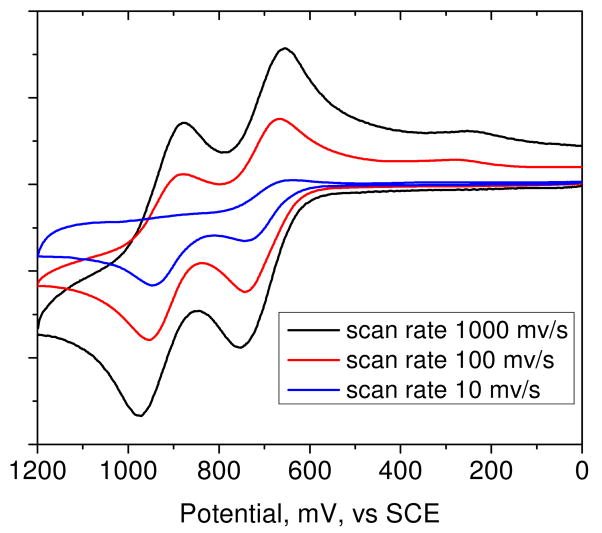
In Figure 6 are given the CVs of astaxanthin in anhydrous CH2Cl2. At a scan rate of 1000 mV/s the CV is near reversible. The first and second oxidation peaks versus SCE occur around 755 mV and 974 mV corresponding to the formation of astaxanthin radical cation and dication, respectively. Upon reversing the scan, the reduction waves for the radical cation and the astaxanthin molecule occur, followed by a peak around 250 mV for the reduction of the astaxanthin cation (formed by loss of a proton from the dication) into the neutral radical of astaxanthin.36
Figure 6.
CV plots of astaxanthin in methylene chloride at different scan rates.
CV plots (Figure 6) as a function of scan rate (from 1000 mV/s to 10 mV/s) with CH2Cl2 as solvent showed that the lifetimes of the radical cation and dication are short compared to the duration of the scan at 10 mV/s where irreversible CV occurs. Unfortunately, the salts studied here do not dissolve in CH2Cl2. Instead, a much less satisfactory solvent, CH3CN, must be used where traces of moisture remain even after the most vigorous attempts to eliminate them. This results in irreversible CV which makes it difficult to determine oxidation potentials. However, relative oxidation potentials can still be deduced using an established reference. The absolute oxidation potential has been reported for canthaxanthin (carotenoid without OH group at 3 position of cyclohexene ring) in CH2Cl2.38 Therefore CV measurements of canthaxanthin were made in CH3CN as a reference and then astaxanthin in CH3CN as the solvent and in the presence of Ca2+ and Zn2+ salts were recorded relative to this reference (Figure S1 in the supporting information). The CV recorded at a scan rate of 1000 mV/s showed that the presence of Ca2+ ions (not hydrated) significantly reduced the lifetime of the radical cation and dication as indicated by near lack of reduction peaks on the reverse wave, and increased the concentration of the carotenoid neutral radicals. A smaller decrease occurs in the presence of Zn2+. The presence of Ca2+ or Zn2+ salts shifted the oxidation potential to lower potentials by approximately 60 mV and 20 mV, respectively.
The irreversible character of the CV using CH3CN as a solvent was most dramatically seen at low scan rate (10 mV/s) where the lifetimes of the radical cations and dications are comparable to the scan time, for example compare Figure S1 (1000 mV/s) with Figure S3 (10 mV/s). The use of hydrated salts as received without drying results in the irreversible CVs which are not interpretable (compare Figure S3 (in CH3CN at 10 mV/s) to Figure S4 (in CH3CN at 10 mV/s)).
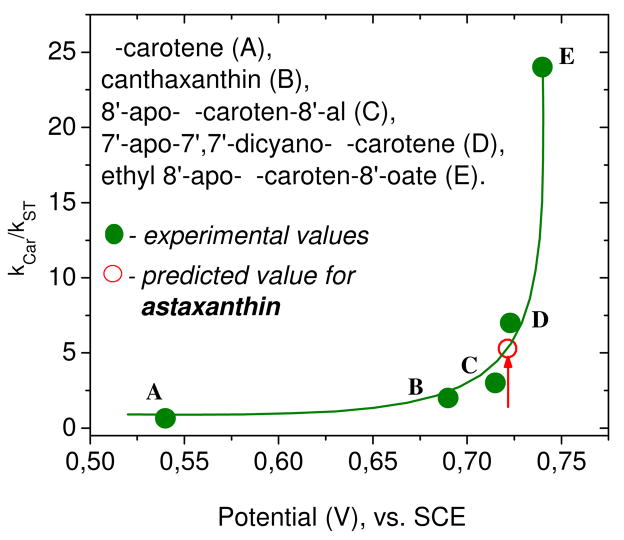
In Figure 7 are given the relative scavenging rates of carotenoids toward peroxyl radicals as reported earlier39 as a function of potential versus SCE, when the carotenoids are dissolved in CH3CN. The apparent first oxidation potential measured for canthaxanthin in CH3CN and as reported previously, equaled 0.680 V and astaxanthin measured in CH3CN was 0.723V. The same differences were observed with other scan rates. As previously demonstrated39 the non-linear behavior toward the scavenging rates is an important feature of Figure 7. For carotenoids with lower oxidation potential such as β-carotene or zeaxanthin, a small change in oxidation potential does not change the scavenging rate. However, for canthaxanthin (B), 8′-apo-β-caroten-8′-al (C) and the ester (E) a small change does result in a significant change in the antioxidant activity of the carotenoids.39 For example, the scavenging rate of canthaxanthin (E1/2=0.68 V) for OOH• radicals increased by a relative factor of 50 and for 7′-apo-7′,7′-dicyano-β-carotene (E1/2=0.725 V) increased by a relative factor of 120 when the oxidation potential was shifted approximately 50 mV by formation of the supramolecular complexes with glycyrrhizic acid.39 This non linear dependence of scavenging rate on oxidation potential is consistent with the reported photoprotect property of astaxanthin. Figure 7 shows the predicted scavenging rate for astaxanthin (red circle), which is in agreement with the relative antioxidant ability of astaxanthin and β-carotene.40 It has been shown also that upon forming the ethyl-8′-apo-β-caroten-8′-oate (0.737 V) ester of 8′-apo-β-caroten-8′-al (0.715 V), the scavenging rate increased by a factor of 8.41
Figure 7.
Relative scavenging rates of carotenoids toward peroxyl radicals.
The appearance of the carotenoid radical cations, dications and neutral radicals in the CV suggested DFT and EPR measurements to establish their structure.
DFT Calculations
Astaxanthin is a symmetric molecule (see Scheme 2) and the primed positions are equivalent by symmetry with the unprimed positions, so calculations of the carotenoid neutral radicals were carried out only for the proton loss at the unprimed positions.
Scheme 2.
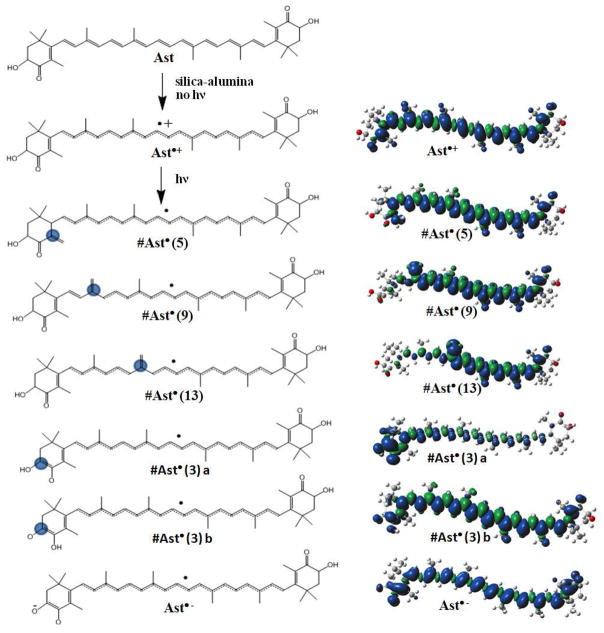
Possible radical intermediates of astaxanthin formed upon the proton loss (indicated by blue circle) during the photolysis in the presence of metal ions. On the right: unpaired spin distribution for astaxanthin radicals Ast•+, #Ast•(5), #Ast•(9), #Ast•(13), #Ast•(3)a (not detected by EPR), #Ast•(3)b (couplings similar to #Ast•(5)) and Ast•− (small couplings, ENDOR 13 to 17 MHz region) from DFT.
Calculations were carried out for the radical cations Ast•+ and for the neutral radicals formed by loss of the C5-, C9-, and C13-methyl protons, namely #Ast•(5), #Ast• (9) and #Ast• (13), respectively. Loss of H+ from the radical cation is indicated by #. On the basis of the results for other carotenoids8,28 these species were expected to occur, according to Scheme 2 upon light irradiation in activated silica-alumina. In addition, calculations were performed for loss of a proton from the C3 position to generate #Ast•(3)a and #Ast•(3)b, and for further loss of the proton from the hydroxyl group of these radicals to generate the radical anion Ast•− (Scheme 2).
The optimized geometries for the radicals are given in the Supporting Information in Tables S1–S7. The unpaired spin density distributions for the radical cation, the neutral radicals formed by proton loss, and the radical anion are shown in Scheme 2, on the right. The radical cations and the neutral radicals exhibit an odd-alternant spin pattern (see also Tables S8–S14 in supporting information), with positive spins (blue) alternating with negative spins (green). The DFT isotropic proton couplings for the astaxanthin radicals are given in bold type, and the anisotropic α-proton couplings are given in standard type (see Tables S8–S14 in supporting information).
When a proton is lost from the radical cation (as in Scheme 2), the unpaired spin density increases at carbons on the other end of the chain. The neutral radical #Ast•(5) formed is the most stable radical formed by proton loss from the methyl groups, having the unpaired spin density distributed throughout the molecule from C5 to C5′ (see Scheme 2). The length of delocalization of the spin density for the neutral radicals formed by proton loss at the methyl groups decreases from #Ast•(5) to #Ast•(9) to #Ast•(13), so the relative energies of the neutral radicals are expected to increase in the same direction (see Table 4). Astaxanthin can also lose a proton at the 3(3′) position giving rise to a neutral radical (#Ast•(3)a) even lower in energy. This radical has very large couplings (18.62 MHz and 75.89 MHz, see table S12 in supporting information) which were not observed in the experimental EPR spectrum. Proton transfer from the hydroxyl group of #Ast•(3)a to the 4 carbonyl oxygen would give rise to a neutral radical #Ast•(3)b at even lower energy, with couplings as large as 14 MHz, and very similar to those of #Ast•(5) (see S9 and S13 in supporting information). Further deprotonation of the hydroxyl group of either neutral radical #Ast•(3)a or #Ast•(3)b would form the same radical anion Ast•−, and would allow complexation with metals. The conjugation length of this radical is the longest of all the radicals and even is longer than the lowest energy neutral radical structure of zeaxanthin.8 DFT energies of the neutral radicals and the radical anion relative to that of the radical cation are given in Table 4.
Table 4.
Energies relative to #Ast•+ for the astaxanthin radicals in kilocalories per mole (Kcal/mol)
| #Ast•(5) | #Ast•(9) | #Ast•(13) | #Ast•(3) a | #Ast•(3) b | Ast•− |
|---|---|---|---|---|---|
| 258.57 | 258.86 | 260.72 | 249.51 | 244.83 | 553.55 |
EPR and ENDOR studies
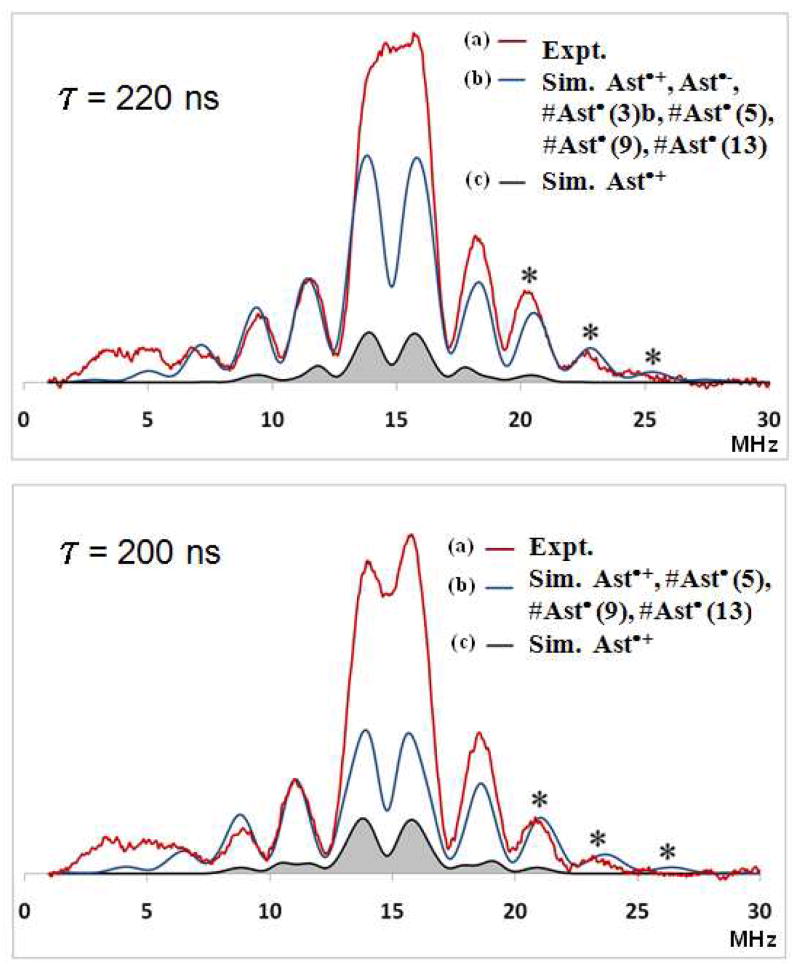
Mims ENDOR spectra were measured as a function of τ and simulated for the radicals on silica-alumina (Figure 8).
Figure 8.
Pulsed Mims ENDOR spectra of astaxanthin radicals as a function of τ (220 nm and 200 nm). (a) The red trace is the experimental spectrum produced in activated silica-alumina after UV irradiation; ENDOR parameters: T = 20 K, B = 3475 G, ν = 9.76 GHz, τ = 220 ns. (b) The black trace is the simulated spectrum using isotropic and anisotropic DFT-calculated couplings of Ast•+ only. (c) The blue trace is the simulated spectrum using isotropic and anisotropic DFT-calculated hyperfine couplings for Ast•+, Ast•−, #Ast•(3)b, #Ast•(5), #Ast•(9) and #Ast•(13) in a 1:1:1:1:1:1 ratio. Note: ENDOR lines occur at νn = ± A/2, where νn is the proton frequency situated at the center of the ENDOR spectrum (proton frequency νn = 14.793571 MHz). Note: the outer peaks indicated by * are due to the neutral radicals. Below 6 MHz the baseline includes an artifact from the non linearity of the ENDOR amplifier and thus interferes with low-frequency ENDOR lines due to neutral radicals. The simulation for τ = 200 ns is missing Ast•− and #Ast•(3)b and which contribute to the center of the spectrum.
Pulsed ENDOR spectra were measured at different delay times τ to avoid the “blind-spot” effect where ENDOR amplitude has periodic oscillations that are proportional to 1 - cos(2πAτ).23 The isotropic coupling constant values (A) listed in Table 5 for methyl protons determined from DFT were used in the ENDOR spectral simulations along with the anisotropic components listed in Tables S8–S14 in supporting information.
Table 5.
Isotropic β-methyl proton couplings (MHz) of astaxanthin radicals obtained by DFT calculations.
| Position | DFT Calculated
Aiso |
||||||
|---|---|---|---|---|---|---|---|
| Ast•+ | #Ast•(5) | # Ast•(9) | # Ast•(13) | #Ast•(3)a NOT DETECTED | # Ast•(3)b | Ast•− | |
| C1-CH3 | −0.05 | 0.46 | −0.01 | −0.02 | −0.43 | 0.29 | 0.19 |
| C1′-CH3 | 0.33 | −0.10 | −0.09 | −0.08 | 0.09 | −0.05 | 0.41 |
| C5-CH3 | 5.05 | 3.71 | −0.65 | −0.56 | −2.61 | −2.14 | 3.42 |
| C5′-CH3 | 4.45 | - | 3.97 | 4.47 | 0.38 | 3.47 | 3.99 |
| C9-CH3 | 9.17 | −4.62 | 10.79 | −1.90 | −1.20 | −5.09 | 3.14 |
| C9′-CH3 | 9.23 | 10.09 | - | 12.20 | 0.92 | 9.73 | 4.30 |
| C13-CH3 | 5.62 | −7.53 | −7.68 | 15.93 | −0.78 | −7.73 | 2.33 |
| C13′-CH3 | 6.06 | 14.05 | 14.59 | - | 1.03 | 13.75 | 3.92 |
In powder cw ENDOR spectra, lines from α-protons are often broaden and not easily detected, while the β-protons usually have very little anisotropy and give rise to narrow and intense lines. cw ENDOR spectra can be simulated using only the isotropic couplings for β-methyl protons.28
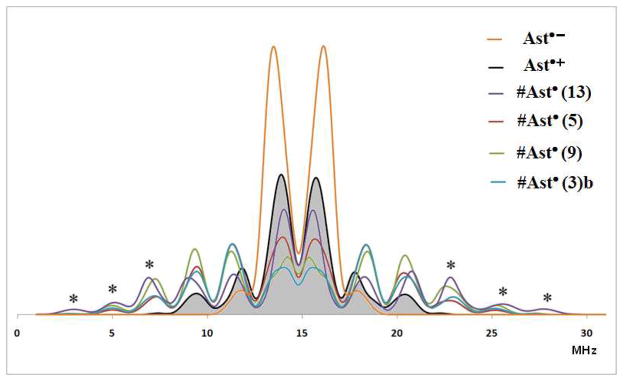
In contrast, powder pulsed H ENDOR spectra exhibit resolved features which can only be simulated if the full tensor (anisotropic and isotropic components) found in Tables S8–S14 used. The fit at the outer edges is definitive because the edges contain contributions from only the neutral radicals. Figure 8A (τ = 220 nm) and 8B (τ = 200 nm) shows the fit in black if only proton couplings of the radical cation are included. The fits are much better when proton couplings of the neutral radicals are included in the simulation. The blue curve includes these neutral radical species and the outer edges are accounted for, in agreement with the experimental spectrum. The spectral lines in the center of Mims ENDOR spectra are due to proton couplings less than 2 MHz and to the matrix protons neither of which were included in the simulation. Figure 9 shows the individual contribution of each radical to the spectrum.
Figure 9.
Simulated Mims ENDOR spectra (τ = 220 ns) of the individual radicals using DFT proton hyperfine couplings listed in Tables S8–S14 in supporting information for Ast•− orange, Ast•+ black, #Ast•(3)b blue, #Ast•(5) red, #Ast•(9) green and #Ast•(13) violet. Note: the outer peaks indicated by * are due to the neutral radicals.
The Mims ENDOR simulation does show in Figure 9 isotropic couplings greater than 15 MHz (the maximum value of the isotropic couplings for the radical cation is 9 MHz) from the methyl groups in each neutral radical. These large couplings from the individual neutral radicals are required for the Mims ENDOR lines above 22.5 MHz and below 7.5 MHz along with a small contribution from large anisotropic couplings. The central portion of the Mims ENDOR spectrum in Figure 8 can be accounted for if a significant amount of the radical anion of astaxanthin Ast•− is present. Simulation of the radical anion in Figure 9 shows intense ENDOR lines in the central region between 13 and 17 MHz. The observed EPR spectra could be due to Ti3+ or SiO radicals. However, the presence of these radicals would not produce proton ENDOR and ESEEM spectra with proton modulation as shown in Figure S5.
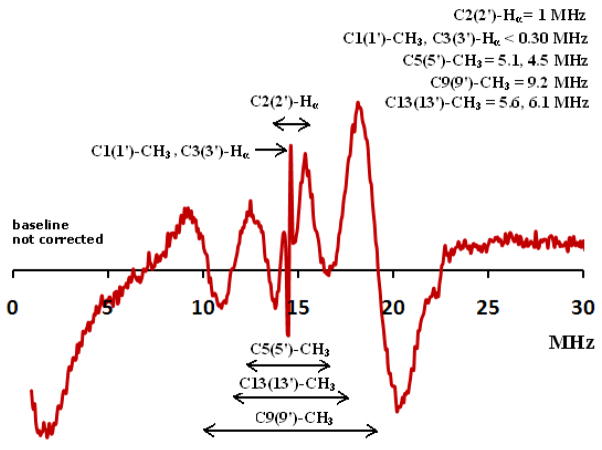
Powder cw ENDOR measurements (Figure 10) at 130 K taken in the absence of UV/IR irradiation for astaxanthin on silica-alumina showed only the formation of the radical cations because no couplings greater than 9 MHz were observed, consistent with the absence of neutral radicals. Previously, the absence of the neutral radicals was observed for β-carotene formed on silica-alumina in the absence of light.28 Upon irradiation neutral radicals were formed8 by loss of the proton from the carotenoid radical cation. The cw ENDOR measurements of astaxanthin with isotropic proton couplings less than 9 MHz in the absence of light are consistent with the observed increase in EPR linewidth upon light irradiation for 2 min indicating production of neutral radicals (see Figure S6 in supporting information) with isotropic couplings greater than 9 MHz.
Figure 10.
Powder X-band cw ENDOR spectrum at 130 K of astaxanthin on silica-alumina in the absence of light irradiation. Assigments of the DFT generated couplings for the radical cation for protons located at C1(1′)-CH3, C2(2′)-Hα, C3(3′)-Hα, C5(5′)-CH3, C9(9′)-CH3 and C13(13′)-CH3 positions account for the observed lines. ENDOR lines above 20 MHz and below 9 MHz for the neutral radicals are missing.
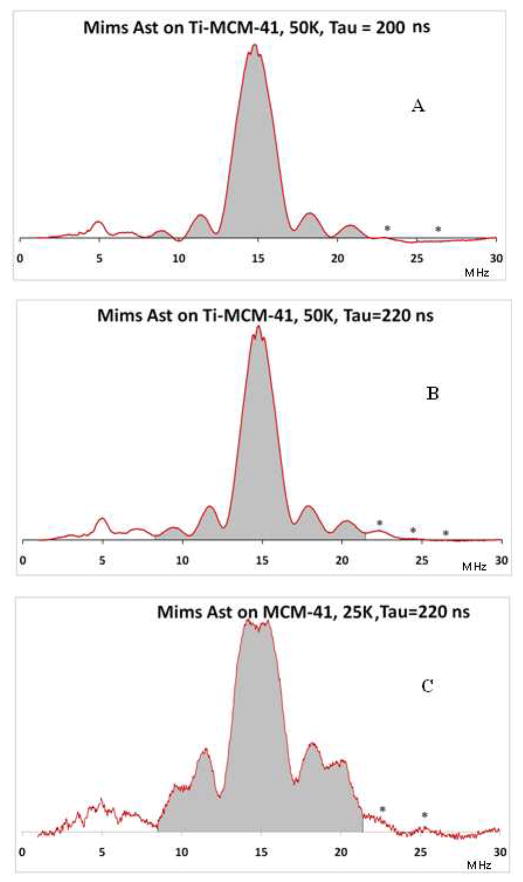
In Figure 11A, B and C are given the Mims ENDOR spectra when astaxanthin is added to a MCM-41 or Ti-MCM-41 matrix and irradiated at 77 K with light. Examining Figure 11A and Figure 11B when τ is varied from 200 ns to 220 ns indicates that the concentration of the radical cations (indicated by grey area) formed in the presence of Ti(IV) exceeds that of the neutral radicals. This observation suggests that the presence of Ti(IV) has a stabilizing effect on the radical cation in the presence of light.
Figure 11.
Mims ENDOR spectra of astaxanthin on Ti-MCM-41 at τ = 200 ns (A) and τ = 220 ns (B). The concentration of the radical cations (grey area) exceeds the concentration of the neutral radicals in the absence of Ti(IV) (C).
Furthermore, comparing the normalized field sweep EPR spectra (corresponding to the ENDOR spectra in Figure 11A and Figure 11C) and correcting for the Boltzmann factors shows a 66-fold increase in the presence of the Ti(IV) electron acceptor. Thus a metal electron acceptor can increase the radical yield by more than an order of magnitude.
Discussion
The ability of astaxanthin to form chelate complexes with metal ions as shown in the present study is an extremely important feature from several points of view. First of all, an excess of metal ions, such as Ca2+, Fe2+ and Zn2+ has negative health effects. For example, Fe2+ produces reactive oxygen species, especially OH radicals via interaction with hydrogen peroxide.42 Ca2+ induces lens turbidity and other diseases.18 Zn2+ inhibits the mitochondrial complex I (NADH: ubiquinone oxidoreductase),43 which is central to energy transduction, and whose dysfunction is implicated in neurodegenerative and muscular diseases and in aging. Astaxanthin is capable in vitro of protecting porcine lens proteins from oxidative insult and degradation by calcium-induced calpain.44 Although the free Ca2+ levels in vivo may be unknown, the authors suggested that astaxanthin must react with Ca2+ to form a complex leading to the decrease of free ion concentration, which then resulted in less activation of calpain to hydrolyze lens proteins. Another example is the reported decrease of the isomerization rate of astaxanthin in the presence of calcium ions in solution at high temperature.45 This decrease might be important for nutrition because cis-astaxanthin is not utilized by living organisms to the same extent as the trans form.46 We find that astaxanthin does not form chelate complexes with Cu2+ ions, but we find instead the electron transfer from carotenoid to metal ion occurs (see Figure 4) which does promote cis-trans isomerization of carotenoids33,47 The corresponding radical cations and especially dications of carotenoids have lower isomerization energy barriers than the neutral carotenoid molecules. Previously it was shown48 that cis-trans isomerization occurs for other carotenoids as well, such as β-carotene in the presence of Cu2+ ions. In addition, metal ions can increase the efficiency of photoinduced electron transfer from the carotenoid to the host matrix containing the metal ion.33,49
Astaxanthin has the highest antioxidant activity among natural carotenoids, it is 10 times more effective an antioxidant than β-carotene, and >100 times more effective than vitamin E.16,40,50 We have also shown earlier that the ability of carotenoids to scavenge peroxyl radicals increases significantly with increase of the redox potential.51 The high antioxidant activity of astaxanthin may be a direct result of having the highest reduction potential among natural carotenoids.
In addition to the health benefit, metal complexes possibly play an important role in the photoprotective action of astaxanthin. Our observations show that astaxanthin metal complexes have significantly broader absorption spectra which can provide additional light absorption in the visible region. Also, upon complexation, the electron-withdrawing effect of the positively charged metal ions should decrease the electron density on the cyclohexene ring. This decreased electron density increases the acidity of the astaxanthin, facilitating proton loss52 and the formation of mono and di-esters.53
EPR measurements of astaxanthin radicals formed on solid matrices by photolysis showed no apparent difference in the type of radicals formed in the absence or presence of metal ions such as Ti(IV). However, the presence of metal ions provided an additional electron transfer route, resulting in a very noticeable increase in the concentration of radicals which were stabilized on metal-substituted MCM-41. In particular, the relative ratio of radical cations to neutral radicals increases upon substituting Ti in MCM-41 (Figure 11).
In solution, the radicals formed by electrochemical oxidation in the presence of metal ions exhibit shorter lifetimes than those formed in their absence, although the CV analysis was complicated by the anhydrous acetonitrile used to dissolve the salts.
Conclusion
In conclusion, the chelating ability provides unique properties for astaxanthin which modify its physicochemical properties. At low salt concentration, a 1:1 complex was formed in ethanol as a solvent with an equilibrium constant K1 for the Ca2+ ion complex that is 8 times larger than with either the Zn2+ or Fe2+ salt. At high concentration of salt > 0.2 mM, a 2:1 salt to astaxanthin was formed. K2 for the addition of the second metal ion decreased but the K2 for Ca2+ was nearly twice as large as K1 for either the Zn2+ or Fe2+ ion complex although the rates of K2/K1 (Ca2+) = 0.2 while that for Zn2+ salt K2/K1=0.4 exhibited a lower decrease. The stability constants for the Ca2+ complexes in the presence of acetonitrile decreased by a factor of 8 over that in the presence of ethanol due to incorporation of solvent in the complex. The oxidation potential of astaxanthin decreases in the presence of salts lowering its ability to scavenge peroxyl radicals and decreasing its relative antioxidant ability. In the presence of salts the stability of astaxanthin radical cations and dications decreases with an increase in the lifetime of the neutral radicals formed by proton loss from the radical cation.
Supplementary Material
Acknowledgments
This work was supported in part by The Chemical Sciences, Geosciences and Biosciences Division, Office of Basic Sciences, U. S. Department of Energy, grant DE-FG02-86ER-13465 (LDK), by the Natural Science Foundation for EPR instrument grants CHE-0342921 and CHE-0079498, by the National Institute of Health, grant GM61904 (MKB) and The National Science Foundation CRIF program for the purchase of the ESI/QIT MS, grant CHE 0639003.
Footnotes
Supporting Information Available: Optimized cartesian coordinates at B3LYP/6-31G (d, p) level for Ast•+, #Ast•(5), #Ast•(9), #Ast•(13), #Ast•(3)a and #Ast•(3)b neutral radicals and Ast•− radical anion of astaxanthin; Isotropic β-methyl proton couplings and anisotropic α-proton tensors (MHz) for Ast•+, #Ast•(5), #Ast•(9), #Ast•(13), #Ast•(3)a and #Ast•(3)b neutral radicals and Ast•− radical anion of astaxanthin obtained by DFT calculations; CV plot of astaxanthin in the presence of Ca and Zn salts as a function of scan rate; stability of the radical cation, dication and the neutral radical is dependent on the presence of the salt, the apparent oxidation shifts to lower oxidation potential and is dependent on the type of metal. CV plot of astaxanthin 1 mM + Ca2+ (20 mM) or Zn2+ (30 mM) in anhydrous CH3CN (scan rate = 1000 mV/s); CV plot of astaxanthin 1 mM + Ca(ClO4)2 20 mM in anhydrous CH3CN (scan rate = 200 mV/s); CV plot of astaxanthin 1 mM + Ca2+ (20 mM) or Zn2+ (30 mM) in anhydrous CH3CN (scan rate = 10 mV/s); The effect of hydrated salts in CH3CN causing severe irreversible CV and decay of the radical species; Astaxanthin 0.1 mM in CH3CN, Scan rate = 10 mV/sec.; The ESEEM spectra of astaxanthin radicals: the spectra show proton modulation consistent with the formation of carotenoid radicals.; The EPR spectra of astaxanthin radicals: the spectra show broadening upon irradiation indicating formation of neutral radicals. Field positions are not corrected for change in frequency before and after irradiation, samples being irradiated external to the cavity. This information is available free of charge via the Internet at http://pubs.acs.org.
References
- 1.Holt NE, Fleming GR, Niyogi KK. Biochemistry. 2004;43:8281–8289. doi: 10.1021/bi0494020. [DOI] [PubMed] [Google Scholar]
- 2.Pascal AA, Liu ZF, Broess K, van Oort B, van Amerongen H, Wang C, Horton P, Robert B, Chang WR, Ruban A. Nature. 2005;436:134–137. doi: 10.1038/nature03795. [DOI] [PubMed] [Google Scholar]
- 3.Mozzo M, Dall’Osto L, Hienerwadel R, Bassi R, Croce R. J Biol Chem. 2008;283:6184–6192. doi: 10.1074/jbc.M708961200. [DOI] [PubMed] [Google Scholar]
- 4.Holt NE, Zigmantas D, Valkunas L, Li XP, Niyogi KK, Fleming GR. Science. 2005;307:433–436. doi: 10.1126/science.1105833. [DOI] [PubMed] [Google Scholar]
- 5.Ahn TK, Avenson TJ, Ballottari M, Cheng YC, Niyogi KK, Bassi R, Fleming GR. Science. 2008;320:794–797. doi: 10.1126/science.1154800. [DOI] [PubMed] [Google Scholar]
- 6.Avenson TJ, Ahn TK, Zigmantas D, Niyogi KK, Li Z, Ballottari M, Bassi R, Fleming GR. J Biol Chem. 2008;283:3550–3558. doi: 10.1074/jbc.M705645200. [DOI] [PubMed] [Google Scholar]
- 7.Avenson TJ, Ahn TK, Niyogi KK, Ballottari M, Bassi R, Fleming GR. J Biol Chem. 2009;284:2830–2835. doi: 10.1074/jbc.M807192200. [DOI] [PubMed] [Google Scholar]
- 8.Focsan AL, Bowman MK, Konovalova TA, Molnar P, Deli J, Dixon DA, Kispert LD. J Phys Chem B. 2008;112:1806–1819. doi: 10.1021/jp0765650. [DOI] [PubMed] [Google Scholar]
- 9.Kumbhar A, Padhye S, Ross D. Biometals. 1996;9:235–240. doi: 10.1007/BF00817921. [DOI] [PubMed] [Google Scholar]
- 10.Kelkar VD, Gokhale RR, Gholap HR. Syn React Inorg Met. 1998;28:1253–1264. [Google Scholar]
- 11.Gokhale N, Padhye S, Newton C, Pritchard R. Metal-based Drugs. 2000;7:121–128. doi: 10.1155/MBD.2000.121. [DOI] [PMC free article] [PubMed] [Google Scholar]
- 12.Kobayashi M, Kakizono T, Nishio N, Nagai S, Kurimura Y, Tsuji Y. Appl Microbiol Biot. 1997;48:351–356. [Google Scholar]
- 13.Eom H, Lee CG, Jin E. Planta. 2006;223:1231–1242. doi: 10.1007/s00425-005-0171-2. [DOI] [PubMed] [Google Scholar]
- 14.Wang B, Zarka A, Trebst A, Boussiba S. J Phycol. 2003;39:1116–1124. [Google Scholar]
- 15.Hu ZY, Li YT, Sommerfeld M, Chen F, Hu Q. Eur J Phycol. 2008;43:365–376. [Google Scholar]
- 16.Guerin M, Huntley ME, Olaizola M. Trends Biotechnol. 2003;21:210–216. doi: 10.1016/S0167-7799(03)00078-7. [DOI] [PubMed] [Google Scholar]
- 17.Lorenz T. A technical review of Haematococcus algae. Cyanotech Corporation; http://www.cyanotech.com/pdfs/bioastin/axbul60.pdf. [Google Scholar]
- 18.Carragher NO. Curr Pharm Design. 2006;12:615–638. doi: 10.2174/138161206775474314. [DOI] [PubMed] [Google Scholar]
- 19.Migdał-Mikuli A, Hetmañczyk J. J Therm Anal Calorim. 2008;91:529–534. [Google Scholar]
- 20.Grunwald E, Jumper CF, Meiboom S. J Am Chem Soc. 1962;84:4664–4671. [Google Scholar]
- 21.Beck JS, Vartuli JC, Roth WJ, Leonowicz ME, Kresge CT, Schmitt KD, Chu CTW, Olson DH, Sheppard EW, McCullen SB, Higgins JB, Schlenker JL. J Am Chem Soc. 1992;114:10834–10843. [Google Scholar]
- 22.Konovalova TA, Li SG, Polyakov NE, Focsan AL, Dixon DA, Kispert LD. J Phys Chem B. 2009;113:8704–8716. doi: 10.1021/jp811369h. [DOI] [PubMed] [Google Scholar]
- 23.Mims WB. Proceedings of the Royal Society of London, Series A Mathematical and Physical Sciences. 1965;283:452–457. [Google Scholar]
- 24.Astashkin A. University of Arizona; http://quiz2.chem.arizona.edu/epr/epr_000006.htm. [Google Scholar]
- 25.Frisch MJ, Trucks GW, Schlegel HB, Scuseria GE, Robb MA, Cheeseman JR, Montgomery JAJ, TV, Kudin KN, Burant JC, Millam JM, Iyengar SS, Tomasi J, Barone V, Mennucci B, Cossi M, Scalmani G, Rega N, Petersson GA, Nakatsuji H, Hada M, Ehara M, Toyota K, Fukuda R, Hasegawa J, Ishida M, Nakajima T, Honda Y, Kitao O, Nakai H, Klene M, Li X, Knox JE, Hratchian HP, Cross JB, Adamo C, Jaramillo J, Gomperts R, Stratmann RE, Yazyev O, Austin AJ, Cammi R, Pomelli C, Ochterski JW, Ayala PY, Morokuma K, Voth GA, Salvador P, Dannenberg JJ, Zakrzewski VG, Dapprich S, Daniels AD, Strain MC, Farkas O, Malick DK, Rabuck AD, Raghavachari K, Foresman JB, Ortiz JV, Cui Q, Baboul AG, Clifford S, Cioslowski J, Stefanov BB, Liu G, Liashenko A, Piskorz P, Komaromi I, Martin RL, Fox DJ, Keith T, Al-Laham MA, Peng CY, Nanayakkara A, Challacombe M, Gill PMW, Johnson B, Chen W, Wong MW, Gonzalez C, Pople JA. 2003 [Google Scholar]
- 26.Becke AD. J Chem Phys. 1993;98:5648–5652. [Google Scholar]
- 27.Lee CT, Yang WT, Parr RG. Phys Rev B. 1988;37:785–789. doi: 10.1103/physrevb.37.785. [DOI] [PubMed] [Google Scholar]
- 28.Gao YL, Focsan AL, Kispert LD, Dixon DA. J Phys Chem B. 2006;110:24750–24756. doi: 10.1021/jp0643707. [DOI] [PubMed] [Google Scholar]
- 29.Schafer A, Horn H, Ahlrichs R. J Chem Phys. 1992;97:2571–2577. [Google Scholar]
- 30.Cho H, Felmy AR, Craciun R, Keenum JP, Shah N, Dixon DA. J Am Chem Soc. 2006;128:2324–2335. doi: 10.1021/ja0559202. [DOI] [PubMed] [Google Scholar]
- 31.Gao YL, Focsan AL, Li YY, Kispert LD. J Phys Chem A. 2006;110:10091–10097. doi: 10.1021/jp0623239. [DOI] [PubMed] [Google Scholar]
- 32.http://www.semichem.com/ampac/ampacgui-features.php.
- 33.Kispert LD, Polyakov NE. Chem Lett. 2010;39:148–155. [Google Scholar]
- 34.Kataoka K, Kimura S, Shirakawa F, Sasaki Y. Bulletin of the Chemical Society of Japan. 1981;54:2237–2242. [Google Scholar]
- 35.Kataoka K, Takagi T, Sasaki Y. Bulletin of the Chemical Society of Japan. 1982;55:1344–1347. [Google Scholar]
- 36.Liu DZ, Gao YL, Kispert LD. J Electroanal Chem. 2000;488:140–150. [Google Scholar]
- 37.Grant JL, Kramer VJ, Ding R, Kispert LD. J Am Chem Soc. 1988;110:2151–2157. [Google Scholar]
- 38.Hapiot PF, Kispert LD, Konovalov VV, Saveant JM. J Am Chem Soc. 2001;123:6669–6677. doi: 10.1021/ja0106063. [DOI] [PubMed] [Google Scholar]
- 39.Polyakov NE, Leshina TV, Salakhutdinov NF, Konovalova TA, Kispert LD. Free Radical Bio Med. 2006;40:1804–1809. doi: 10.1016/j.freeradbiomed.2006.01.015. [DOI] [PubMed] [Google Scholar]
- 40.Naguib YMA. J Agr Food Chem. 2000;48:1150–1154. doi: 10.1021/jf991106k. [DOI] [PubMed] [Google Scholar]
- 41.Polyakov NE, Kruppa AI, Leshina TV, Konovalova TA, Kispert LD. Free Radical Bio Med. 2001;31:43–52. doi: 10.1016/s0891-5849(01)00547-0. [DOI] [PubMed] [Google Scholar]
- 42.Halliwell B, Gutteridge JMC. Free Radicals in Biology and Medicine. New York: Oxford University Press; 1985. The chemistry of oxygen radicals and other oxygen-derived species; pp. 20–64. [Google Scholar]
- 43.Sharpley MS, Hirst J. J Biol Chem. 2006;281:34803–34809. doi: 10.1074/jbc.M607389200. [DOI] [PubMed] [Google Scholar]
- 44.Wu TH, Liao JH, Hou WC, Huang FY, Maher TJ, Hu CC. J Agr Food Chem. 2006;54:2418–2423. doi: 10.1021/jf052651q. [DOI] [PubMed] [Google Scholar]
- 45.Chen CS, Wu SH, Wu YY, Fang JM, Wu TH. Org Lett. 2007;9:2985–2988. doi: 10.1021/ol0709533. [DOI] [PubMed] [Google Scholar]
- 46.Bjerkeng B, Folling M, Lagocki S, Storebakken T, Olli JJ, Alsted N. Aquaculture. 1997;157:63–82. [Google Scholar]
- 47.Kispert LD, Konovalova T, Gao Y. Arch Biochem Biophys. 2004;430:49–60. doi: 10.1016/j.abb.2004.03.036. [DOI] [PubMed] [Google Scholar]
- 48.Gao YL, Konovalova TA, Lawrence JN, Smitha MA, Nunley J, Schad R, Kispert LD. J Phys Chem B. 2003;107:2459–2465. [Google Scholar]
- 49.Lawrence J, Focsan AL, Konovalova TA, Molnar P, Deli J, Bowman MK, Kispert LD. J Phys Chem B. 2008;112:5449–5457. doi: 10.1021/jp711310u. [DOI] [PubMed] [Google Scholar]
- 50.Palozza P, Krinsky NI. Arch Biochem Biophys. 1992;297:291–295. doi: 10.1016/0003-9861(92)90675-m. [DOI] [PubMed] [Google Scholar]
- 51.Polyakov NE, Leshina TV, Konovalova TA, Kispert LD. Free Radical Bio Med. 2001;31:398–404. doi: 10.1016/s0891-5849(01)00598-6. [DOI] [PubMed] [Google Scholar]
- 52.Zhang Z, Hui TLT, Orvig C. Canadian Journal of Chemistry. 1989;67:1708–1710. [Google Scholar]
- 53.Fukami H, Namikawa K, Sugiura-Tomimori N, Sumida M, Katano K, Nakao M. Journal of Oleo Science. 2006;55:653–656. [Google Scholar]
Associated Data
This section collects any data citations, data availability statements, or supplementary materials included in this article.


