

Over the past 25 years various immunosuppressive drugs have been screened for clinical usage in controlling allograft rejection, autoimmune disease, and malignancy. In vitro methodologies have permitted a rapid assessment of potential new drugs. In this study we have compared the immunosuppressive effects of two purine synthesis inhibitors mycophenolic acid (MPA)1 and bredinin (BR)2 to the known immunosuppressive drugs FK 506, rapamycin (RAPA), and cyclosporine (CyA). A variety of culture systems were used to study the potency of different drugs and their mechanisms of action. Such models included T-cell activation via calcium-dependent (A23187 and phytohemagglutinin [PHA]) and calcium-independent (interleukin-2 [IL-2] and phorbol myristic acetate [PMA]) pathways. We tested the effect of immunosuppressive drugs on freshly prepared peripheral blood lymphocytes (PBL), and transformed T- and non–T-cell lines. In addition, we also studied the combined effects of MPA, BR, and low doses of FK 506 and CyA in our system to determine whether there is any synergistic or additive effect between these drugs.
MATERIALS AND METHODS
Cells
PBL were isolated by Ficoll-Hypaque density gradient centrifugation of heparinized blood from healthy donors. Cells were resuspended in RPM I 1640 tissue culture medium (TCM) supplemented with 25 mmol/L Hepes buffer and 100 U/mL gentamycin and 5% normal human AB serum.
Reagents
FK 506 (Fujisawa Pharmaceuticals, Osaka, Japan) and CyA (Sandoz, Basel, Switzerland) were dissolved in methanol (1 mg/mL). MPA (Sigma Chemical Co, St Louis, Mo), BR (Sumitomo Chemical Co Ltd, Takarazuka, Japan), and RAPA (Wyeth-Ayerst Research, Rahway, NJ) were dissolved in ethanol, water, and methanol, respectively, before use. Calcium ionophore (A23187), PHA, and PMA were purchased from Sigma.
Proliferative Responses of Lymphocytes
Mitogen-Induced Proliferation Assays
Mononuclear cells were cultured in TCM at 105 cells/well (Nunc round bottom tissue culture plates) in the presence of A23187 (1 μg/mL), PHA (1%), or PMA (0.1 μg/mL) in a volume of 200 μL for 3 days.
Mixed Lymphocyte Reaction (MLR assay)
One-way MLR cultures were established with equal numbers (5 × 10⁴/well) of responder and irradiated stimulator cells in TCM and incubated for 6 days.
PLT Test
Alloreactive T cells (2 × 10⁴/well) were incubated with 105 irradiated (2,000 rad) stimulator cells for 3 days.
IL-2 Induced Proliferation
Alloreactive T-cell lines (2 × 10⁴/well) were incubated with 30 U/mL of recombinant IL-2 for 3 days. In all assays. proliferation was measured by the degree of 3H-thymidine incorporation during the last 20 hours of incubation.
Proliferative Responses of Various Cell Lines
T-lymphoma cell lines (DND41, Molt 13, Peer), EB virus-transformed B-lymphoblastoid cell lines (DT, CK, RK, DN), B-lymphoma cell line (RPMI-1788), erythroleukemia cell line (K562), and promyelocytic cell line (HL-60) were maintained in TCM supplemented with 10% fetal calf serum (FCS). DND41, Molt 13, and Peer were kindly provided by Dr C. Milcareck (Molecular Biology, University of Pittsburgh). RPMI-1788 and HL-60 were obtained from American Type Culture Collection (Rockville, Md). K562 was supplied by Dr T. Whiteside (Pittsburgh Cancer Institute). Proliferation was measured after 72 hours, of incubation by 3H-thymidine incorporation.
Drug Inhibition Assays
The inhibitory effects of various drugs alone or in combination were measured at different concentrations. The % inhibition was calculated as follows: % inhibition = (1-cpm with drug/cpm without drug) × 100.
The drug dose required to obtain 50% inhibition (IC50) was calculated by computer analysis, IBMP, using a nonlinear sigmoidal model curve fitting program (SAS, Inc, Cary, NC).
RESULTS
Effects of Immunosuppressive Drugs on T-Cell Proliferation
Table 1 summarizes the IC50 values of five immunosuppressive drugs in the proliferation of T cells activated by Ca-dependent (A213187 and PHA) and Ca-independent (IL-2 and PMA) pathways. Both FK 506 and RAPA exerted profoundly inhibitory effects (IC50 less than 1 nmol/L) of Ca-dependent T-cell proliferative responses whereas CyA and MPA required 100-fold higher concentrations. The IC50 of BR was about 104-fold higher than those for FK 506 and RAPA.
Table 1.
Inhibitory Effects of Immunosuppressive Drugs on T-Cell Proliferation
| T-Cell Activation Pathways | Mitogen | IC50 (nmol/L) |
||||
|---|---|---|---|---|---|---|
| FK 506 | CyA | RAPA | MPA | BR | ||
| Ca-dependent | A23187 | 0.18 | 23 | 0.42 | 81 | NT |
| PHA | 0.72 | 857 | 0.87 | 232 | 8,919 | |
| Ca-independent | IL-2 | No inhibition | 0.61 | 119 | 7,637 | |
| PMA | No inhibition | 0.35 | 81 | 14,861 | ||
In contrast to FK 506 and CyA, RAPA caused profound inhibition of Ca-independent T-cell proliferation (Table 1).
The same magnitude of IC50 was observed for RAPA in Ca-dependent and Ca-independent T-cell proliferation. Like RAPA, both MPA and BR inhibit T-cell proliferation induced by Ca-dependent and Ca-independent pathways. However, compared with RAPA, the IC50 were 102-and 105-fold higher for MPA and BR, respectively. On the other hand, MPA and BR were inhibitory towards Ca-independent T-cell proliferation at similar IC50 levels as observed for Ca-dependent proliferation. The findings suggest that RAPA, MPA, and BR inhibited both T-cell activation pathways at similar IC50 values for each drug, but the required concentrations of MPA and BR were 102-and 105-fold higher than those of RAPA.
Inhibition of Alloreactive T-Cell Responses by Immunosuppressive Drugs
All four drugs tested (FK 506, CyA, MPA, and BR) inhibited the primary MLR responses and the secondary PLT proliferation of alloreactive T cells (Table 2). The IC50 for FK 506 was 0.1 nmol/L whereas IC50 values for MPA and BR were 102- and 105-fold higher than for FK 506.
Table 2.
Inhibition of Alloreactive T-Cell Responses by Immunosuppressive Drugs
| Allostimulation | IC50 (nmol/L) |
|||
|---|---|---|---|---|
| FK 506 | CyA | MPA | BR | |
| Primary (MLR) | 0.1 | 10 | 103 | 14,706 |
| Secondary (PLT) | 0.17 | 29 | 163 | 28,751 |
Combinations of Low Doses of MPA and BR With FK 506
An additive effect on inhibition of PLT response was demonstrated with the combination of MPA (25 ng/mL) and FK 506 (0.001 to 0.1 ng/mL) (Fig 1). Similar results were achieved with combinations of BR (2,500 ng/mL) and FK 506 (0.001 to 0.1 ng/mL) (Fig 1). In contrast, increased levels of MPA and BR produced no significant additive effects with low doses of FK 506 (data not shown). No evidence was obtained for synergism or antagonism between these drugs in the suppression of PLT proliferation.
Fig 1.
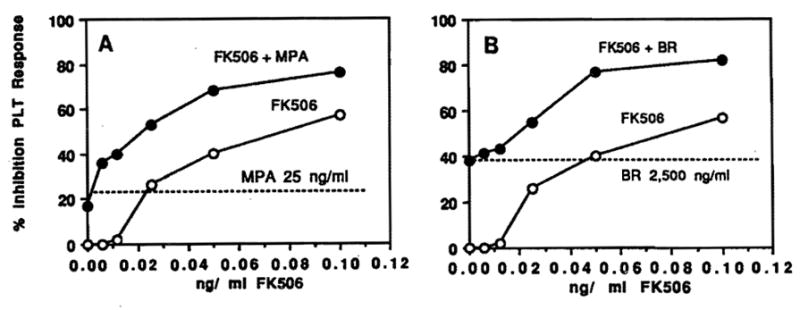
Inhibition of PLT response. Combination of low doses of FK 506 (0.01 to 0.1 ng/mL) with (a) MPA (25 ng/mL) and (b) BR (2,500 ng/mL). The results are expressed as % inhibition of PLT response in the presence of FK 506 alone (○) or in combination with MPA or BR (●).
Effects of Immunosuppressive Drugs on the Proliferation of Various Transformed Cell Lines
Table 3 summarizes the antiproliferative effects of MPA, BR, and RAPA on various T-cell lymphomas, EB virus-transformed B-lymphoblastoid cell lines, and other tumor cell lines. MPA significantly inhibited all cell lines tested at drug concentrations of 90 to 365 nmol/L. Similar inhibition was observed with BR, however, the IC50 dose of BR was 100 to 200-fold higher than those of MPA. In contrast, RAPA exhibited a more restricted spectrum of activity than MP and BR. The sensitivity of tumor cell lines to RAPA varied from sensitive (EB virus-transformed B-cell lines) to more resistant (K562, PEER) (Table 3).
Table 3.
Inhibitory Effects of Immunosuppressive Drugs on the Proliferation of Various Transformed Cell Lines
| Cell Culture | Origin | IC50 (nmol/L) |
||
|---|---|---|---|---|
| MPA | BR | RAPA | ||
| DND41 | T Lymphoma | 91 | 11,583 | NT |
| MOLT 13 | T Lymphoma | 365 | 96,525 | 274 |
| PEER | T Lymphoma | 275 | 28,275 | No inhibition |
| EB-DT | B Lymphoblast | 167 | 15,984 | 11 |
| EB-CK | B Lymphoblast | 164 | 25,135 | NT |
| EB-RK | B Lymphoblast | 274 | 46,332 | NT |
| EB-DN | B Lymphoblast | 292 | 42,471 | NT |
| RPMI-1788 | B Lymphoma | 182 | 19,305 | 10 |
| K562 | Erythroleukemia | 304 | 17,760 | No inhibition |
| HL-60 | Promyelocytic | 365 | 32,007 | 273 |
Note: FK 506 and CyA have no inhibitory effect.
DISCUSSION
These data show that MPA and BR inhibit in a dose-dependent manner the proliferative responses of normal T cells to mitogenic and alloantigenic stimulation. Both Ca-dependent and Ca-independent T-cell activation pathways are equally sensitive to MPA and BR immunosuppression. In contrast, FK 506 and CyA are most efficient in blocking Ca-dependent T-cell responses. 3–5 The drug inhibitory activity seems to be cell cycle dependent. Thus, FK 506 and CyA act at an early stage of T-cell differentiation by inhibiting the cell division cycle at the G0/G1 interface6 while MPA and BR act at a later stage of cell activation pathway by blocking the movement of cells from G1 to S.7,8 Similarly, RAPA acts at a later stage in cell cycle at some point in G1.6
MPA and BR also block the proliferation of many lymphoid and nonlymphoid cell lines. The inhibitory effects of these drugs are mediated through inhibition of ionosin monophosphate phosphatase dehydrogenase, an enzyme required for guanine nucleotide synthesis.7,8 Other drugs known as inhibitors of purine synthesis are methotrexate9 and azathioprine.10 However, the cytostatic effects of these drugs are similar for all cell types tested (lymphoid cells, fibroblasts, and endothelial cells) whereas MPA and BR seem to affect primarily T and B cells.7,8 Since RAPA significantly inhibited the in vitro expansion of EB virus-transformed lymphoblastoid cell lines it is likely that RAPA may have clinical efficacy in treating EBV -associated posttransplant lymphoproliferative disease.
No synergism between MPA or BR with FK 506 or CyA was observed in the inhibition of allogeneic T-cell proliferation. At most, an additive effect was seen with low doses of drugs tested in the MLR and PLT test. The additive effects have also been reported for combinations of CyA and BR in an in vitro model of CD3-activated T-cell proliferation8 and in experimental and clinical cadaveric renal allotransplantations.11,12 Recently, Todo and colleagues showed a significant prolongation of renal allografts in dogs treated with low doses of FK 506 and BR (personal communication). Thus, MPA and BR may offer an alternative regimen when used in conjunction with other immunosuppressive drugs in the treatment of allograft rejection.
Acknowledgments
Supported in part by grants AI-23467 and DK-29961 from the National Institutes of Health and the Pathology Education Research Foundation.
References
- 1.Franklin TJ, et al. Biochem J. 1969;113:515. doi: 10.1042/bj1130515. [DOI] [PMC free article] [PubMed] [Google Scholar]
- 2.Mizuno K, Tsugino M, Takada M, et al. J Antibiot (Tokyo) 1974;24:775. doi: 10.7164/antibiotics.27.775. [DOI] [PubMed] [Google Scholar]
- 3.Sawada S, Suzuki C, Kawase Y, et al. J Immunol. 1987;139:797. [PubMed] [Google Scholar]
- 4.Thomson AW, Woo J, Zeevi Z, et al. In: Handbook of Immune Response Modifiers. Brossard C, editor. Berlin: Lavoisier/Springer-Verlag; 1991. in press. [Google Scholar]
- 5.Kay JE, Benzie CR, Goodier MR, et al. Immunology. 1989;67:473. [PMC free article] [PubMed] [Google Scholar]
- 6.Metcalfe SM, Richards FM. Transplantation. 1990;49:798. [PubMed] [Google Scholar]
- 7.Eugui EM, Sjalquist C, Muller CD, et al. Scand J Immunol. 1991;33:1619. doi: 10.1111/j.1365-3083.1991.tb03746.x. [DOI] [PubMed] [Google Scholar]
- 8.Turka LA, Dayton J, Sinclair G, et al. J Clin Invest. 1991;87:940. doi: 10.1172/JCI115101. [DOI] [PMC free article] [PubMed] [Google Scholar]
- 9.Jolivet J, Cowan KH, Curt GA, et al. N Engl J Med. 1983;309:1094. doi: 10.1056/NEJM198311033091805. [DOI] [PubMed] [Google Scholar]
- 10.Herlia P, Murelli L, Scotti M, et al. Carcinogenesis. 1988;9:1011. doi: 10.1093/carcin/9.6.1011. [DOI] [PubMed] [Google Scholar]
- 11.Osakabe T, Vchida H, Masaki Y, et al. Transplant Proc. 1989;21:1598. [PubMed] [Google Scholar]
- 12.Amemiya H, Suzuki S, Watanabe H, et al. Transplant Proc. 1989;21:956. [PubMed] [Google Scholar]