Abstract
Glioblastoma (GBM) is the most aggressive primary brain tumor and is resistant to all therapeutic regimens. Relapse occurs regularly and might be caused by a poorly characterized tumor stem cell (TSC) subpopulation escaping therapy. We suggest aldehyde dehydrogenase 1 (ALDH1) as a novel stem cell marker in human GBM. Using the neurosphere formation assay as a functional method to identify brain TSCs, we show that high protein levels of ALDH1 facilitate neurosphere formation in established GBM cell lines. Even single ALDH1 positive cells give rise to colonies and neurospheres. Consequently, the inhibition of ALDH1 in vitro decreases both the number of neurospheres and their size. Cell lines without expression of ALDH1 do not form tumor spheroids under the same culturing conditions. High levels of ALDH1 seem to keep tumor cells in an undifferentiated, stem cell-like state indicated by the low expression of beta-III-tubulin. In contrast, ALDH1 inhibition induces premature cellular differentiation and reduces clonogenic capacity. Primary cell cultures obtained from fresh tumor samples approve the established GBM cell line results.
Keywords: glioblastoma, neurospheres, tumor stem cells
Glioblastoma (GBM) is the most common primary brain tumor in adults with a medium survival of approximately 15 months.1 Despite various efforts to improve the postoperative therapeutic regimen within the last years, the prognosis of this highly aggressive tumor has remained poor. Relapse occurs regularly after resection, irradiation, and chemotherapy. This could in part be due to the existence of so-called tumor stem cells (TSCs), a cellular subfraction within GBM contributing to recurrent tumor growth and resistance to drugs and irradiation. Within the last decade, TSCs have been identified and isolated in a variety of hematologic and solid neoplasms. The characterization of these cells seems to be crucial for a better understanding of tumor biology and for the development of more efficient antitumor therapies.
Owing to the TSC paradigm, hematologic and solid tumors consist of hierarchically ordered cellular subdivisions. TSCs are believed to harbor the ability to keep a tumor alive and growing: pluripotency, self-renewal, and resistance to chemo- and irradiation therapy. This concept arose from the notion that a subpopulation of cancer cells shows similarity to normal stem cells.2 Leukemias were the first malignancies from which cells could be isolated that showed the potential to self-renew and to drive tumor formation and growth.3
A stem cell subfraction has been described in brain tumors and especially in high-grade astrocytomas. Singh et al.4 were the first to identify and purify, a population with stem cell properties in pediatric solid brain tumors. Those cells were identified by their ability to form spheroids (neurospheres) when grown under serum-free cell culture conditions and by the expression of CD133 and nestin. CD133 (also known as prominin-1), a 120-kDa pentaspan transmembrane glycoprotein, has been found to be a marker of stemness in hematopoietic5 and neural cells.6 Together with nestin, an intermediate filament protein expressed by undifferentiated neuroepithelial cells7 and tumors of the CNS,8 CD133 has long remained the most important TSC marker in malignant glioma.
Aldehyde dehydrogenase 1 (ALDH1) is a cytoplasmatic stem cell marker in a variety of malignant tumors. As a member of the ALDH enzyme family, ALDH1 catalyzes the oxidation of intracellular aldehydes including the transformation of retinol to retinoic acid (RA). RA is a modulator of cell proliferation and differentiation that possibly contributes to the maintenance of an undifferentiated stem cell phenotype. Jones et al.9 presented a method to isolate human cells via flow cytometry depending on the amount of cytosolic ALDH. They were able to enrich human hematopoietic precursor cells capable of reconstituting bone marrow in irradiated animals. Recently, Ginestier et al.10 found ALDH1 to be a stem cell marker in breast carcinoma associated with poor clinical outcome. Since then ALDH1 has been described as a marker of stemness in other solid malignancies including lung cancer11 and colorectal cancer.12
Here, we show that ALDH1 overexpression correlates with stem cell capacity in established GBM cell lines as well as in primary cultures obtained from freshly resected tumor specimens. Therefore, we suggest ALDH1 overexpression as a marker for the identification of TSCs in human GBM.
Materials and Methods
Antibodies
The primary antibodies used were anti-ALDH1 (monoclonal, IgG isotype, BD Biosciences), anti-Musashi-1 (polyclonal, CST), anti-Sox-2 (monoclonal, IgG, Millipore), and anti-beta-III-tubulin (monoclonal, IgG isotype, Millipore).
Cell Culture
The human GBM cell lines LN18,13 LN229,13 LNZ308,13 and G13914 were cultured in the Dulbecco's modified Eagle's medium (DMEM) supplemented with 10% fetal calf serum (FCS), 2 mM l-glutamine, 100 U/mL penicillin, and 100 µg/mL streptomycin (Invitrogen) under the standard cell culture conditions at 37°C and 5% CO2. To investigate the neurosphere formation, the cells were grown in a serum-free neurobasal medium consisting of Knockout DMEM (Invitrogen), Nutrient Mixture Ham's F12 + l-glutamine (Invitrogen), and 10% Knockout-Serum Replacement (Invitrogen) with 1% N2-Supplement (Invitrogen), 1% Non-Essential Amino-Acids (Invitrogen), 0.1% natural mouse laminin (Invitrogen), 2 mM l-glutamine (Biochrom), 100 U/mL penicillin (Biochrom), 100 µg/mL streptomycin (Biochrom), 10 ng/mL basic fibroblast growth factor (bFGF; Invitrogen), and 50 ng/mL epidermal growth factor (EGF; human recombinant, Millipore). For nonadherent growth conditions, the culture dishes were covered with 0.1% gelatin type A (Sigma-Aldrich).
For the ALDH1 inhibition experiments, RA and 4-diethylaminobenzaldehyde (DEAB; Sigma-Aldrich) were added in a concentration of 100 µM every 48 hours together with fresh medium. The cells were grown on culture dishes until they began to form spheroids and were consequently transferred to culture flasks.
Mouse embryonic stem cells (TBV2) were cultured as reported previously.15 For the limiting dilution assay, both LN18 and LN229 cells were plated into 96 wells at a density of 10 and 1 cell/well. All cells were cultured in the neurobasal medium with EGF and FGF. ALDH1 inhibition was done as described above. After 12 days in culture, colonies were counted using the Zeiss Axiovert 25 microscope (Zeiss). A colony was defined to consist of at least 20 cells. Multiple wells were counted for each cell density. The experiment was repeated twice.
For primary cell culture, resected GBM specimens were obtained with patients’ consent according to the Technische Universität München (TUM) medical faculty's guidelines for tissue preservation from the Department of Neurosurgery (Head: Bernhard Meyer, MD, PhD). Tumor tissue was mechanically dissociated with sterile scalpel blades and subsequently enzymatically dissociated by 1-hour incubation in 2 mg/mL collagenase type I (Biochrom). Single-cell suspensions were cultured in both supplemented DMEM and neurobasal medium under the standard cell culture conditions.
Immunohistochemistry
Immunohistochemistry was performed on a paraffin-embedded human tumor tissue, diagnosed as GBM grade IV according to the WHO classification.16 The tissue was sectioned 2-µm thick and deparaffinized. To unmask epitopes, tissue was boiled in citrate buffer (pH 6.0) for 7 minutes. After washing in TRIS buffer (pH 7.6) for 5 minutes, an endogenous peroxidase quench was done in 3% H2O2 for 15 minutes at room temperature followed by blocking with Avidin/Biotin (Vector) for 15 minutes each. To block nonspecific binding sites, 5% goat serum (Normal, Dako) diluted in Dako REAL™ Antibody solution was used. The anti-ALDH antibody was diluted in Dako REAL™ Antibody solution (1:500). Antibody incubation was done at 4°C using 200 µL per slide overnight. Detection was performed with Dako REAL™ Detection System, Peroxidase/DAB+, Rabbit/Mouse. Slides were incubated for 15 minutes in a humidified chamber at room temperature with biotinylated secondary antibody and then with streptavidin peroxidase antibody for 15 minutes. Slides were incubated with DAB chromogen working solution for 4 minutes. Counterstaining was done with Meyer's hemalaun.
Immunofluorescence
After cells were grown on microscope slides for 24 hours, they were washed in PBS (without Ca2+and Mg2+) followed by fixation in 4% formaldehyde/PBS for 30 minutes at room temperature. Cells were then incubated for 10 minutes with 0.25% Triton X-100/PBS and washed again in PBS. Blocking was performed for 30 minutes with 5% goat serum (Normal, Dako) diluted in Dako REAL™ Antibody solution. Cells were then incubated with primary antibodies for 1 hour (anti-ALDH1, 1:100) or 2 hours (anti-SOX-2, 1:100 and anti-Musashi-1, 1:100), respectively, at room temperature. After washing with PBS, incubation was performed with a secondary antibody (FITC for ALDH1 and SOX2, 1:100; Cy-3 for Musashi-1, 1:100, Invitrogen) for 1 hour at room temperature and washed again. Nuclei were stained with DAPI (2 mg/mL) before mounting cells with VectaShield™ Mounting Medium (Vector Laboratories) and applicating coverslips. Fluorescence images were captured with a Zeiss ApoTome epifluorescence confocal microscope equipped with a digital camera and acquisition software AxioVision LE Rel 4.5 (Zeiss).
Western Blotting
Cells were lysed in lysis buffer (New England Biolabs) supplemented with 1 mM PMSF (Roth). Equal amounts of protein (10–20 µg) were separated by SDS–PAGE and transferred to immobilion membranes (Millipore). Blocking of unspecific binding sites was done using 5% (w/v) nonfat dry milk in tris-buffered saline Tween-20 (TBST). Membranes were incubated with polyclonal primary antibodies diluted in TBST overnight at 4°C. HRP-conjugated immunoglobulins (diluted 1:2000 in 5% nonfat dry milk/TBST) served as secondary antibodies and were probed for 1 hour at room temperature. Immunoreactivity was visualized by exposure to high-performance chemiluminescence film (Amersham). Antibody dilution: anti-SOX-2, 1:500; anti-ALDH1, 1:500; anti-beta-III-tubulin, 1:1000; anti-Musashi-1, 1:500. Alpha-tubulin immunoblots served as protein loading controls (dilution 1:10 000).
Statistical Analyzes
One-way ANOVA testing was used to assess differences in average neurosphere size after ALDH1 inhibition.
Results
Neurosphere Forming Established GBM Cell Lines Show High Levels of ALDH1
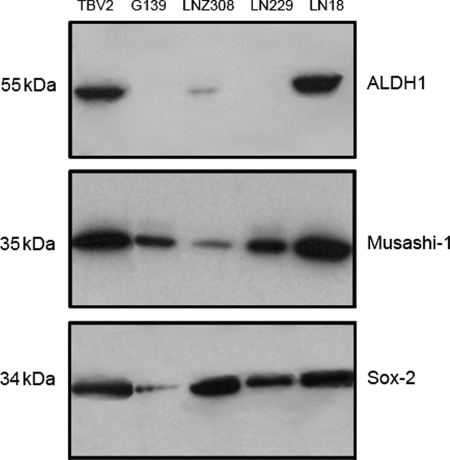
To determine stem cell capacity, 4 established human GBM cell lines (LN18, LN229, LNZ308, and G139) were screened for the ability to form neurospheres and ALDH1 expression. Therefore, cells were grown under serum-free conditions in the neurobasal medium supplemented with EGF and bFGF. Western blot analysis of cell lines grown in supplemented DMEM shows high expression of ALDH1 in LN18 and moderate expression in LNZ308 cells, whereas LN229 and G139 cells are negative (Fig. 1). LN18 and LNZ308 cells form neurospheres after 72 hours in culture (data not shown). Remarkably, spheroids built by LNZ308 cells are unstable and disintegrate at early stages of neurosphere formation. The ALDH1 negative (ALDH1−) cell lines LN229 and G139 do not form any spheroids under the same conditions (Fig. 1). In addition, the neurosphere forming cell lines LN18 and LNZ308 show coexpression of ALDH1 with Sox-2 and Musashi-1.
Fig. 1.
Western blot analysis shows high protein levels of ALDH1 in LN18 and in murine stem cells (TBV2) when grown in DMEM + FCS. LNZ308 cells are moderately positive. ALDH1 co-expression with Musashi-1 and Sox-2 was found in LN18, LNZ308, and TBV2. All 3 show neurosphere formation when cultured in a neurobasal medium containing EGF and bFGF. G139 and LN229 are negative for ALDH1 and do not form spheroids under the same conditions.
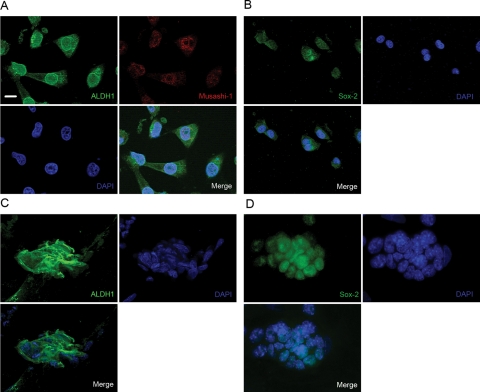
Immunofluorescence staining was performed to confirm ALDH1 expression in LN18 cells. These cells are highly positive for ALDH1 and coexpression of Musashi-1 was demonstrated in double-staining experiments (Fig. 2A). Additionally, LN18 cells are positive for Sox-2. Stem cells derived from the murine embryonic stem cell line TBV2 served as positive controls for ALDH1, Musashi-1, and Sox-2. RT–PCR analysis detected a high level of ALDH1 mRNA in LN18 cells (data not shown).
Fig. 2.
Immunofluorescence staining. (A) LN18 cells coexpress ALDH1 (cytoplasmatic) and Musashi-1 (nuclear) when cultured in DMEM + FCS. (B) Additionally, the cells are positive for Sox-2 (nuclear). Murine stem cells (TBV2) serve as controls and are highly positive for both ALDH1 and Sox-2 (C and D). Nuclei stained with DAPI. Scale bar represents 10 µm.
ALDH1 Inhibition Impairs Neurosphere Formation and Clonogenicity in Established and Primary GBM Cell Lines
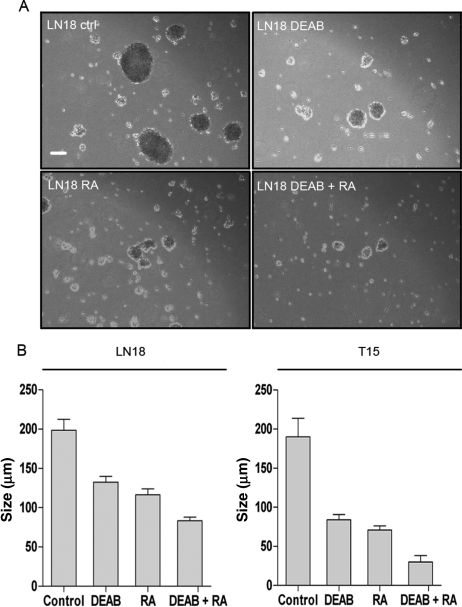
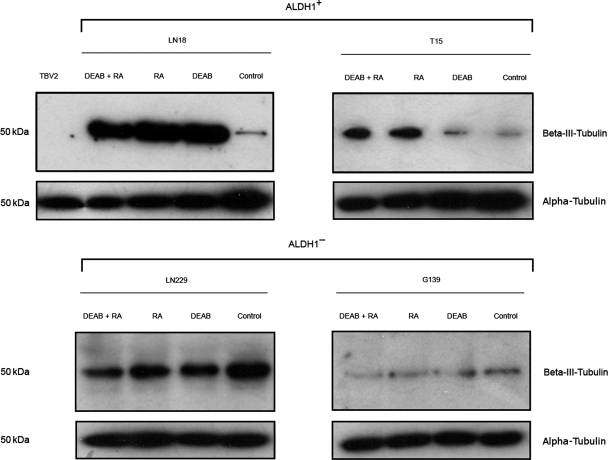
After identifying ALDH1 expression as a possible factor in the process of neurosphere formation, it was next investigated whether enzyme inhibition affects spheroid formation in vitro. Therefore, LN18 cells and the primary cell line T15 were incubated under serum-free conditions in the neurobasal medium with EGF and bFGF. For inhibition of ALDH1, DEAB, RA, or a combination of both were added to the medium. DEAB and RA are specific inhibitors of ALDH1.17,18 Untreated cells served as controls. The inhibitors did not affect cell viability compared with untreated control cells (data not shown). After 14 days of cultivation, the inhibited cells had formed significantly fewer and smaller neurospheres than the controls (Fig. 3A and B). The combination of DEAB and RA led to the most significant decline in spheroid number and size. Since ALDH1 participates in the maintenance of an undifferentiated phenotype, we analyzed the influence of ALDH1 inhibition on cell differentiation. LN18 and T15 control cells show moderate expression of beta-III-tubulin, a neuron-specific marker, when grown in the neurobasal medium (Fig. 4). The inhibited cells are highly positive for beta-III-tubulin reflecting a more differentiated state compared with untreated controls. Murine embryonic stem cells (TBV2) are negative for the neuronal marker. ALDH1 inhibition does not induce differentiation in the ALDH1− cell lines LN229 and G139.
Fig. 3.
(A) Neurospheres built by LN18 cells after 14 days in culture (neurobasal medium). The inhibitors DEAB and RA were added in a concentration of 100 µM every 48 hours with fresh medium. Scale bar represents 50 µm. (B) Average neurosphere size after 14 days in culture. The spheres formed by inhibited cells were significantly smaller (P < .05) than those built by LN18 and T15 control cells. Cells were treated with 100 µM DEAB, 100 µM RA, or a combination of both. Inhibition with DEAB and RA led to the most significant decline in neurosphere size.
Fig. 4.
Expression of the neuron-specific marker beta-III-tubulin in LN18 cells and the primary cell line T15. All cells except for TBV2 were grown in a neurobasal medium. LN18 and T15 control cells show moderate levels of beta-III-tubulin. The inhibition of ALDH1 induces pronounced differentiation indicated by higher protein levels of beta-III-tubulin in both cell lines. The undifferentiated TBV2 stem cells are negative for beta-III-tubulin. ALDH1 inhibition does not induce differentiation in LN229 and G139 cells (ALDH1−). Alpha-tubulin serves as a protein loading control.
To assess the clonogenic capacity of ALDH1 positive (ALDH1+) cells, LN18 and LN229 cells were plated into 96 wells at varying densities down to 1 cell/well. After 12 days of culture in a neurobasal medium with EGF and FGF, LN18 cells had formed colonies with an efficiency of 75.8% and neurospheres with a frequency of 18.9%. Even single-cell suspensions grew to colonies and neurospheres. The inhibition of ALDH1 in LN18 cells by RA reduced clonogenic capacity from 75.8% to 1.6%. The inhibited cells did not form spheroids. At least 10 LN229 cells (ALDH1−) per well were needed to obtain colonies with an efficiency of 4.3%. LN229 single-cell suspensions did not give rise to any colonies.
ALDH1 Expression Correlates Negatively with the Grade of Neuronal Differentiation in Primary GBM Cultures
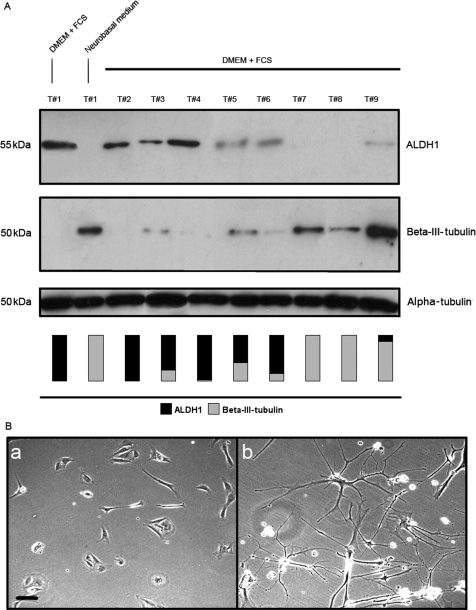
To evaluate the clinical relevance of ALDH1 expression in human GBM, the investigations were extended from the cell culture model to the human tumor tissue. Cells obtained from freshly resected GBM specimens were cultured in supplemented DMEM and under the serum-free conditions in the neurobasal medium. All samples were collected from tumors diagnosed as high-grade astrocytomas (WHO grade III and IV). Western blot analysis shows 4 primary cultures highly positive for ALDH1, 3 have moderate levels, and 2 are negative when cultured in DMEM + FCS (Fig. 5A). Beta-III-tubulin expression shows a reverse pattern: cells with high levels of ALDH1 show low expression of beta-III-tubulin and vice versa. Similar to the established cell lines, primary cells partly differentiate when grown in a neurobasal medium accompanied by expression of beta-III-tubulin (Fig. 5A and B). Western blot analysis of cells grown in DMEM without FCS confirmed that the loss of ALDH1 expression and tendency to differentiate in the neurobasal medium are not due to serum deprivation (data not shown).
Fig. 5.
(A) ALDH1 and beta-III-tubulin expression in primary cultures obtained from fresh high-grade glioma samples (WHO grade III and IV) cultured in a supplemented DMEM or a neurobasal medium. ALDH1 and beta-III-tubulin expression in both media is exemplarily shown for Tumor #1 (lane 2). Comparably to the established cell line LN18, primary cell lines express high levels of ALDH1 in DMEM + FCS and are negative when grown in a neurobasal medium (and beta-III-tubulin vice versa). All tumors are positive for either ALDH1 or beta-III-tubulin in DMEM + FCS. The vertical bars visualize ALDH1 and beta-III-tubulin expression of each cell line. Alpha-tubulin serves as a protein loading control. (B) Tumor #1 grown in supplemented DMEM (a) and neurobasal medium (b). Tumor cells positive for ALDH1 under serum conditions differentiate into mature neural and glial cells when cultured in a neurobasal medium. Scale bar represents 10 µm.
Immunohistochemistry Shows ALDH1 Expression in Resected GBMs and Non-neoplastic Neural Stem Cells
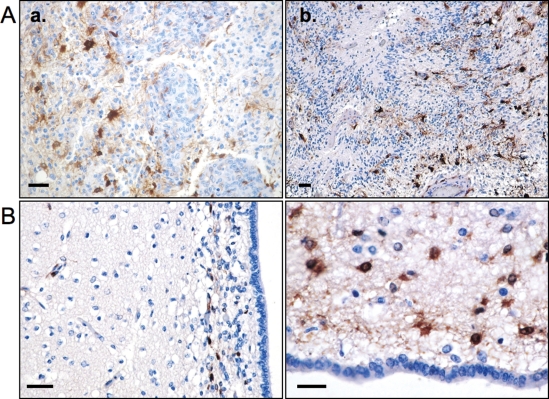
Immunohistochemical staining of paraffin sections from 24 resected GBMs was performed to confirm ALDH1 expression in tumor specimens. Varying degrees of ALDH1 expression were found in 20 tumor samples, and 4 specimens were negative. Interestingly, ALDH1+ tumor cells were mainly observed in the vicinity of tumor vessels and in hypoxic areas adjacent to tumor necrosis (Fig. 6A).
Fig. 6.
(A) Immunohistochemical staining showing tumor cells and proliferating vessels with ALDH1+ cells (brown) in their vicinity (a). In (b) tumor necrosis, pseudopalisades, and ALDH1+ cells can be seen. (B) Staining of human subventricular zone (SVZ). Scattered ALDH1+ cells are located in the subependymal ribbon. The brain tissue adjacent to the SVZ is negative for ALDH1. Scale bars represent 20 µm.
Immunohistochemistry on the paraffin-embedded human subventricular zone (SVZ) was performed to confirm staining specificity. Several types of astrocytes including multipotent stem cells have been described as being located in the human SVZ.19 ALDH1+ cells were found in a scattered pattern within the subependymal ribbon (Fig. 6B). The brain tissue adjacent to the SVZ did not contain cells positive for ALDH1.
Discussion
GBM is the most aggressive primary brain tumor and is highly resistant to all currently available therapeutic modalities. Despite treatment tumor relapse occurs regularly, accompanied by an unfavorable prognosis. This clinical behavior could be due to the existence of a TSC subpopulation in GBM. TSCs have recently been shown as highly resistant to irradiation and chemotherapy and are likely the major source of tumor recurrence.20–23 Therefore, identification and isolation of these cells seem crucial for a better understanding of tumor behavior, origin, and therapy.
To further characterize TSCs in malignant glioma, we examined established cell lines, primary cell cultures, and paraffin-embedded sections derived from human GBM for the expression of ALDH1. As a member of the ALDH family, ALDH1 oxidates intracellular aldehydes and has been shown to catalyze the reaction of retinol to RA, a modulator of cell proliferation and differentiation. Recently, ALDH1 has been described as a marker for the identification of non-neoplastic stem cells and TSCs.10,12,24
In the present investigation, we show a correlation between the cellular protein level of ALDH1 and the ability to form neurospheres in human GBM cells. We demonstrate that the established GBM lines harboring high levels of ALDH1 form tumor spheroids. ALDH1− cell lines do not build neurospheres when cultured under the same conditions. Moreover, the inhibition of ALDH1 leads to a significant decrease in neurosphere formation and clonogenic capacity. Inhibited cells express high levels of beta-III-tubulin suggesting a higher grade of neuronal differentiation compared with untreated controls. We observed high levels of ALDH1 in primary cultures obtained from freshly resected tumor tissue, confirming that ALDH1 overexpression is not a phenomenon restricted to established cell lines. The neurosphere formation assay is a well-established method to investigate the functional properties of non-neoplastic neural stem cells and is also appropriate for the examination of brain TSCs. So far cellular markers including CD133 have been used to identify TSCs in GBMs. Recently, the relevance of CD133 as a reliable TSC marker was doubted since it was shown that even CD133 negative GBM cells may behave as brain TSCs.25 Neurosphere formation, in contrast, is a functional assay to investigate the impact of ALDH1 expression on stem cell characteristics in vitro and therefore suitable for the ALDH1 in inhibition experiments described in the present investigation.
Recently published data showed that ALDH1 characterizes non-neoplastic neural stem cells and TSCs in a variety of malignancies. Corti et al.24 isolated primitive neural stem cells from murine neurospheres via flow cytometry with Aldefluor, a fluorescent substrate for ALDH1. The ALDH1+ cells showed self-renewal neurosphere formation and could be differentiated into both neurons and glial cells. Ginestier et al.10 used the Aldefluor assay to sort normal mammary epithelium cells for their level of cytosolic ALDH1. They found the capability to form spheroids (mammospheres) to be restricted to the Aldefluor positive cell population. Recently, ALDH1 has also been described as a stem cell marker in various solid neoplasms including lung cancer,11 breast carcinoma,10 and colorectal cancer.12 We showed that GBM cell lines harboring high levels of ALDH1 form neurospheres suggesting stem cell capacity. Considering that ALDH1 expression characterizes non-neoplastic neural stem cells as well as malignant stem cells in various solid tumors, we suggest ALDH1 to be a TSC marker in human GBM.
We claim that high ALDH1 activity in GBM cells is involved in the maintenance of an undifferentiated stem cell-like phenotype. LN18 cells grown in DMEM + FCS have high levels of ALDH1 and are negative for beta-III-tubulin suggesting an undifferentiated state. Primary cell cultures highly positive for ALDH1 show low levels of beta-III-tubulin and vice versa. None of the established cell lines builds spheroids when grown in a supplemented DMEM. When transferred to the neurobasal medium, neurospheres are only formed by the 2 cell lines (LN18 and LNZ308) that show ALDH1 expression in DMEM + FCS. It is therefore likely that ALDH1 overexpression characterizes TSCs, which are capable of initiating neurosphere formation. Under serum conditions, these cells remain in a proliferative and undifferentiated state. Culturing in a neurobasal medium partly pushes the TSCs into differentiation indicated by a decrease in ALDH1 expression and moderate increase in the beta-III-tubulin level. Beta-III-tubulin is a neural marker appearing at early stages of neuronal differentiation as well as in mature neurons. Consequently, low levels of beta-III-tubulin expression do not necessarily reflect mature neuronal differentiation. Multipotent ALDH1+ stem or progenitor cells might therefore remain in an undifferentiated and replicative state when cultured in DMEM + FCS. Neurobasal medium supplemented with EGF and FGF promotes the stem cell phenotype including asymmetrical division, neurosphere formation, and neural differentiation. The inhibition of ALDH1 in LN18 and T15 cells leads to pronounced differentiation with high expression of the neuron-specific marker. This effect is not seen in ALDH1− cell lines, suggesting a lack of multipotency and ability to differentiate. It might be hypothesized that the inhibition of ALDH1 leads to a premature differentiation of TSCs, thus having an adverse effect on neurosphere formation. The clonogenic capacity of ALDH1+ cells could be demonstrated by limiting dilution assays. Even single LN18 cells formed both colonies and neurospheres, whereas single LN229 cells did not show any proliferation in stem-cell promoting medium. ALDH1 inhibition significantly impaired the clonogenic and neurosphere formation capacity of LN18 cells, approving the essential role of ALDH1 for the maintenance of a stem cell-like phenotype.
Little is known about the functional role of ALDH1 in TSCs and in the process of neurosphere formation. The enzyme catalyzes the oxidation of retinol to RA, which is known to induce and regulate various biological effects. Mediated by the RA receptor and the retinoid X receptor, it affects development, cell division, apoptosis, and differentiation.26–30 Zeng et al.31 recently showed that treatment of an established GBM cell line with RA leads to upregulation of genes responsible for apoptosis and differentiation. Moreb et al.32 treated lung cancer cell lines with all-trans RA causing a significant decrease in the ALDH1 enzyme activity and the protein level. Considering these observations and the inhibition experiments described here, it seems most likely that a high ALDH1 activity is involved in the maintenance of an undifferentiated, stem cell-like phenotype.
In the present study, neurospheres are formed by cell lines that coexpress ALDH1 with the formerly described TSC markers Sox-2 and Musashi-1. Sox-2 encodes a group of transcription factors that are being activated at different times during development33 and has been found in neural progenitor cells.34 Ma et al.35 showed that Sox-2 mRNA expression increases with the grade of malignancy in WHO grade II, III, and IV GBM. Musashi-1 encodes for various RNA-binding proteins which contribute to the maintenance of an undifferentiated stem cell-like phenotype during CNS development.36 We show that cell lines, which are positive for Musashi-1 and Sox-2 but negative for ALDH1 (LN229 and G139), do not form spheroids. It might be therefore hypothesized that ALDH1 expression in combination with Musashi-1 and Sox-2 facilitates neurosphere formation in the established GBM cell lines.
To confirm ALDH1 expression in patient specimens, immunohistochemical analysis of GBM samples was performed. In many tumors, ALDH1+ cells were found in the vicinity of tumor vessels or around necrotic areas (Fig. 6A). Calabrese et al.37 hypothesized GBM TSCs to be predominantly localized in the proximity of tumor vessels showing close interaction with endothelial cells. Hypoxia has been claimed to attract neural stem cells in intracranial glioma xenografts.38 Li et al.39 demonstrated that glioma stem cells express hypoxia-inducible factors (HIFs) in response to hypoxia which induce tumor angiogenesis. In addition, HIF2α was found to be colocalized with TSC markers in tumor specimens. ALDH1 is an enzyme with detoxifying capacity and could therefore be involved in the protection of TSCs against cellular stress in hypoxic areas. This might explain why ALDH1+ tumor cells were oftentimes found adjacent to necrotic areas.
Magni et al.40 demonstrated that the detoxifying capacity of ALDH1 facilitates cell resistance against alkylating agents such as cyclophosphamide. This observation has clinical implications for GBM therapy. The standard treatment of newly diagnosed GBM currently consists of surgical resection and temozolomide given concomitantly with and after radiotherapy.1 GBM stem cells harboring high levels of ALDH1 could be resistant to this alkylating agent thus escaping chemotherapy and causing tumor relapse.
Immunohistochemistry on the paraffin-embedded human SVZ showed specific staining of ALDH1+ cells within the subependymal ribbon. This area contains a small subpopulation of SVZ astrocytes that behave as multipotent stem cells.19 Morphologically, these cells can hardly be distinguished from other cell types present in the SVZ such as neuronal precursor cells, other types of astrocytes, or oligodendrocytes. Consequently, ALDH1+ SVZ astrocytes cannot definitely be categorized as stem cells. However, taking into account the finding that normal neural stem cells were identified by their expression of ALDH1,24 we hypothesize these ALDH1+ SVZ cells to be stem or progenitor cells.
In conclusion, our data suggest ALDH1 as a novel TSC marker in human GBM. As a cytosolic protein, it is easily detectable and cells can be effectively sorted for their ALDH1 expression using flow cytometry. In addition, ALDH1 could be an attractive target of advanced antitumor therapies against human malignant glioma. TSCs are presumably responsible for resistance to therapy and for disease relapse. Consequently, the effective treatment of the TSC subfraction within GBMs is likely to be an indispensable part of novel therapeutic strategies against this devastating disease.
Funding
This work was supported by the Deutsche Forschungsgemeinschaft (SFB 824: “Imaging for the selection, monitoring and individualization of cancer therapies,” Project B6).
Acknowledgments
The authors thank Veronika Lachner and Gerhard Piendl for technical support.
Conflict of interest statement. None declared.
References
- 1.Stupp R, Mason WP, van den Bent MJ, et al. Radiotherapy plus concomitant and adjuvant temozolomide for glioblastoma. N Engl J Med. 2005;352:987–996. doi: 10.1056/NEJMoa043330. doi:10.1056/NEJMoa043330. [DOI] [PubMed] [Google Scholar]
- 2.Reya T, Morrison SJ, Clarke MF, Weissman IL. Stem cells, cancer, and cancer stem cells. Nature. 2001;414:105–111. doi: 10.1038/35102167. doi:10.1038/35102167. [DOI] [PubMed] [Google Scholar]
- 3.Bonnet D, Dick JE. Human acute myeloid leukemia is organized as a hierarchy that originates from a primitive hematopoietic cell. Nat Med. 1997;3:730–737. doi: 10.1038/nm0797-730. doi:10.1038/nm0797-730. [DOI] [PubMed] [Google Scholar]
- 4.Singh SK, Clarke ID, Terasaki M, et al. Identification of a cancer stem cell in human brain tumors. Cancer Res. 2003;63:5821–5828. [PubMed] [Google Scholar]
- 5.Yin AH, Miraglia S, Zanjani ED, et al. AC133, a novel marker for human hematopoietic stem and progenitor cells. Blood. 1997;90:5002–5012. [PubMed] [Google Scholar]
- 6.Uchida N, Buck DW, He D, et al. Direct isolation of human central nervous system stem cells. Proc Natl Acad Sci USA. 2000;97:14720–14725. doi: 10.1073/pnas.97.26.14720. doi:10.1073/pnas.97.26.14720. [DOI] [PMC free article] [PubMed] [Google Scholar]
- 7.Tohyama T, Lee VM, Rorke LB, Marvin M, McKay RD, Trojanowski JQ. Nestin expression in embryonic human neuroepithelium and in human neuroepithelial tumor cells. Lab Invest. 1992;66:303–313. [PubMed] [Google Scholar]
- 8.Dahlstrand J, Collins VP, Lendahl U. Expression of the class VI intermediate filament nestin in human central nervous system tumors. Cancer Res. 1992;52:5334–5341. [PubMed] [Google Scholar]
- 9.Jones RJ, Barber JP, Vala MS, et al. Assessment of aldehyde dehydrogenase in viable cells. Blood. 1995;85:2742–2746. [PubMed] [Google Scholar]
- 10.Ginestier C, Hur MH, Charafe-Jauffret E, et al. ALDH1 is a marker of normal and malignant human mammary stem cells and a predictor of poor clinical outcome. Cell Stem Cell. 2007;1:555–567. doi: 10.1016/j.stem.2007.08.014. doi:10.1016/j.stem.2007.08.014. [DOI] [PMC free article] [PubMed] [Google Scholar]
- 11.Jiang F, Qiu Q, Khanna A, et al. Aldehyde dehydrogenase 1 is a tumor stem cell-associated marker in lung cancer. Mol Cancer Res. 2009;7:330–338. doi: 10.1158/1541-7786.MCR-08-0393. doi:10.1158/1541-7786.MCR-08-0393. [DOI] [PMC free article] [PubMed] [Google Scholar]
- 12.Huang EH, Hynes MJ, Zhang T, et al. Aldehyde dehydrogenase 1 is a marker for normal and malignant human colonic stem cells (SC) and tracks SC overpopulation during colon tumorigenesis. Cancer Res. 2009;69:3382–3389. doi: 10.1158/0008-5472.CAN-08-4418. doi:10.1158/0008-5472.CAN-08-4418. [DOI] [PMC free article] [PubMed] [Google Scholar]
- 13.Ishii N, Maier D, Merlo A, et al. Frequent co-alterations of TP53, p16/CDKN2A, p14ARF, PTEN tumor suppressor genes in human glioma cell lines. Brain Pathol. 1999;9:469–479. doi: 10.1111/j.1750-3639.1999.tb00536.x. [DOI] [PMC free article] [PubMed] [Google Scholar]
- 14.Schlegel J, Piontek G, Budde B, Neff F, Kraus A. The Akt/protein kinase B-dependent anti-apoptotic pathway and the mitogen-activated protein kinase cascade are alternatively activated in human glioblastoma multiforme. Cancer Lett. 2000;158:103–108. doi: 10.1016/s0304-3835(00)00515-2. doi:10.1016/S0304-3835(00)00515-2. [DOI] [PubMed] [Google Scholar]
- 15.Rudelius M, Daldrup-Link HE, Heinzmann U, et al. Highly efficient paramagnetic labelling of embryonic and neuronal stem cells. Eur J Nucl Med Mol Imaging. 2003;30:1038–1044. doi: 10.1007/s00259-002-1110-0. doi:10.1007/s00259-002-1110-0. [DOI] [PubMed] [Google Scholar]
- 16.Louis DN, Ohgaki H, Wiestler OD, et al. The 2007 WHO classification of tumours of the central nervous system. Acta Neuropathol. 2007;114:97–109. doi: 10.1007/s00401-007-0243-4. doi:10.1007/s00401-007-0243-4. [DOI] [PMC free article] [PubMed] [Google Scholar]
- 17.Chute JP, Muramoto GG, Whitesides J, et al. Inhibition of aldehyde dehydrogenase and retinoid signaling induces the expansion of human hematopoietic stem cells. Proc Natl Acad Sci USA. 2006;103:11707–11712. doi: 10.1073/pnas.0603806103. doi:10.1073/pnas.0603806103. [DOI] [PMC free article] [PubMed] [Google Scholar]
- 18.Elizondo G, Corchero J, Sterneck E, Gonzalez FJ. Feedback inhibition of the retinaldehyde dehydrogenase gene ALDH1 by retinoic acid through retinoic acid receptor alpha and CCAAT/enhancer-binding protein beta. J Biol Chem. 2000;275:39747–39753. doi: 10.1074/jbc.M004987200. doi:10.1074/jbc.M004987200. [DOI] [PubMed] [Google Scholar]
- 19.Quinones-Hinojosa A, Sanai N, Soriano-Navarro M, et al. Cellular composition and cytoarchitecture of the adult human subventricular zone: a niche of neural stem cells. J Comp Neurol. 2006;494:415–434. doi: 10.1002/cne.20798. doi:10.1002/cne.20798. [DOI] [PubMed] [Google Scholar]
- 20.Bao S, Wu Q, McLendon RE, et al. Glioma stem cells promote radioresistance by preferential activation of the DNA damage response. Nature. 2006;444:756–760. doi: 10.1038/nature05236. doi:10.1038/nature05236. [DOI] [PubMed] [Google Scholar]
- 21.Frosina G. DNA repair and resistance of gliomas to chemotherapy and radiotherapy. Mol Cancer Res. 2009;7:989–999. doi: 10.1158/1541-7786.MCR-09-0030. doi:10.1158/1541-7786.MCR-09-0030. [DOI] [PubMed] [Google Scholar]
- 22.Singh SK, Hawkins C, Clarke ID, et al. Identification of human brain tumour initiating cells. Nature. 2004;432:396–401. doi: 10.1038/nature03128. doi:10.1038/nature03128. [DOI] [PubMed] [Google Scholar]
- 23.Ricci-Vitiani L, Lombardi DG, Pilozzi E, et al. Identification and expansion of human colon-cancer-initiating cells. Nature. 2007;445:111–115. doi: 10.1038/nature05384. doi:10.1038/nature05384. [DOI] [PubMed] [Google Scholar]
- 24.Corti S, Locatelli F, Papadimitriou D, et al. Identification of a primitive brain-derived neural stem cell population based on aldehyde dehydrogenase activity. Stem Cells. 2006;24:975–985. doi: 10.1634/stemcells.2005-0217. doi:10.1634/stemcells.2005-0217. [DOI] [PubMed] [Google Scholar]
- 25.Beier D, Hau P, Proescholdt M, et al. CD133(+) and CD133(-) glioblastoma-derived cancer stem cells show differential growth characteristics and molecular profiles. Cancer Res. 2007;67:4010–4015. doi: 10.1158/0008-5472.CAN-06-4180. doi:10.1158/0008-5472.CAN-06-4180. [DOI] [PubMed] [Google Scholar]
- 26.Chambon P. A decade of molecular biology of retinoic acid receptors. FASEB J. 1996;10:940–954. [PubMed] [Google Scholar]
- 27.Collins SJ. The role of retinoids and retinoic acid receptors in normal hematopoiesis. Leukemia. 2002;16:1896–1905. doi: 10.1038/sj.leu.2402718. doi:10.1038/sj.leu.2402718. [DOI] [PubMed] [Google Scholar]
- 28.Zechel C. Requirement of retinoic acid receptor isotypes alpha, beta, and gamma during the initial steps of neural differentiation of PCC7 cells. Mol Endocrinol. 2005;19:1629–1645. doi: 10.1210/me.2004-0540. doi:10.1210/me.2004-0540. [DOI] [PubMed] [Google Scholar]
- 29.Zile MH. Function of vitamin A in vertebrate embryonic development. J Nutr. 2001;131:705–708. doi: 10.1093/jn/131.3.705. [DOI] [PubMed] [Google Scholar]
- 30.Tocci A, Parolini I, Gabbianelli M, et al. Dual action of retinoic acid on human embryonic/fetal hematopoiesis: blockade of primitive progenitor proliferation and shift from multipotent/erythroid/monocytic to granulocytic differentiation program. Blood. 1996;88:2878–2888. [PubMed] [Google Scholar]
- 31.Zeng Y, Yang Z, Xu JG, Yang MS, Zeng ZX, You C. Differentially expressed genes from the glioblastoma cell line SHG-44 treated with all-trans retinoic acid in vitro. J Clin Neurosci. 2009;16:285–294. doi: 10.1016/j.jocn.2007.11.014. doi:10.1016/j.jocn.2007.11.014. [DOI] [PubMed] [Google Scholar]
- 32.Moreb JS, Gabr A, Vartikar GR, Gowda S, Zucali JR, Mohuczy D. Retinoic acid down-regulates aldehyde dehydrogenase and increases cytotoxicity of 4-hydroperoxycyclophosphamide and acetaldehyde. J Pharmacol Exp Ther. 2005;312:339–345. doi: 10.1124/jpet.104.072496. doi:10.1124/jpet.104.072496. [DOI] [PubMed] [Google Scholar]
- 33.Yuan H, Corbi N, Basilico C, Dailey L. Developmental-specific activity of the FGF-4 enhancer requires the synergistic action of Sox2 and Oct-3. Genes Dev. 1995;9:2635–2645. doi: 10.1101/gad.9.21.2635. doi:10.1101/gad.9.21.2635. [DOI] [PubMed] [Google Scholar]
- 34.Komitova M, Eriksson PS. Sox-2 is expressed by neural progenitors and astroglia in the adult rat brain. Neurosci Lett. 2004;369:24–27. doi: 10.1016/j.neulet.2004.07.035. doi:10.1016/j.neulet.2004.07.035. [DOI] [PubMed] [Google Scholar]
- 35.Ma YH, Mentlein R, Knerlich F, Kruse ML, Mehdorn HM, Held-Feindt J. Expression of stem cell markers in human astrocytomas of different WHO grades. J Neurooncol. 2008;86:31–45. doi: 10.1007/s11060-007-9439-7. doi:10.1007/s11060-007-9439-7. [DOI] [PubMed] [Google Scholar]
- 36.Okano H, Kawahara H, Toriya M, Nakao K, Shibata S, Imai T. Function of RNA-binding protein Musashi-1 in stem cells. Exp Cell Res. 2005;306:349–356. doi: 10.1016/j.yexcr.2005.02.021. doi:10.1016/j.yexcr.2005.02.021. [DOI] [PubMed] [Google Scholar]
- 37.Calabrese C, Poppleton H, Kocak M, et al. A perivascular niche for brain tumor stem cells. Cancer Cell. 2007;11:69–82. doi: 10.1016/j.ccr.2006.11.020. doi:10.1016/j.ccr.2006.11.020. [DOI] [PubMed] [Google Scholar]
- 38.Zhao D, Najbauer J, Garcia E, et al. Neural stem cell tropism to glioma: critical role of tumor hypoxia. Mol Cancer Res. 2008;6:1819–1829. doi: 10.1158/1541-7786.MCR-08-0146. doi:10.1158/1541-7786.MCR-08-0146. [DOI] [PubMed] [Google Scholar]
- 39.Li Z, Bao S, Wu Q, et al. Hypoxia-inducible factors regulate tumorigenic capacity of glioma stem cells. Cancer Cell. 2009;15:501–513. doi: 10.1016/j.ccr.2009.03.018. doi:10.1016/j.ccr.2009.03.018. [DOI] [PMC free article] [PubMed] [Google Scholar]
- 40.Magni M, Shammah S, Schiro R, Mellado W, Dalla-Favera R, Gianni AM. Induction of cyclophosphamide-resistance by aldehyde-dehydrogenase gene transfer. Blood. 1996;87:1097–1103. [PubMed] [Google Scholar]


