

Abstract
UDP-glucuronosyltransferases (UGTs) play an important role in the metabolism and excretion of various endogenous and xenobiotic compounds, including carcinogens and chemotherapeutic agents. The goal of the present study was to examine UGT2A1 expression in human tissues, determine its glucuronidation activity against tobacco carcinogens, and assess the potential functional role of UGT2A1 missense single nucleotide polymorphisms on UGT2A1 enzyme activity. As determined by reverse-transcription polymerase chain reaction, UGT2A1 was expressed in aerodigestive tract tissues including trachea, larynx and tonsil, and was also expressed in lung and colon; no expression was observed in breast, whole brain, pancreas, prostate, kidney, liver or esophagus. Real-time PCR suggested that UGT2A1 exhibited highest expression in the lung, followed by trachea > tonsil > larynx > colon > olfactory tissue. Cell homogenates prepared from wild-type UGT2A175Lys308Gly-over-expressing HEK293 cells showed significant glucuronidation activity, as observed by reverse-phase UPLC, against a variety of polycyclic aromatic hydrocarbons (PAHs) including, 1-hydroxy-benzo(a)pyrene, benzo(a)pyrene-7,8-diol, and 5-methylchrysene-1,2-diol. No activity was observed in UGT2A1-over-expressing cell homogenate against substrates that form N-glucuronides, such as NNAL, nicotine, or N-OH-PhIP. A significant (p<0.05) ~25% decrease in glucuronidation activity (Vmax/KM) was observed against all PAH substrates for the UGT2A175Arg308Gly variant as compared to homogenates from wild-type UGT2A175Lys308Gly; no activity was observed for cell homogenates over-expressing the UGT2A175Lys308Arg variant for all substrates tested. These data suggest that UGT2A1 is an important detoxification enzyme in the metabolism of PAHs within target tissues for tobacco carcinogens, and functional polymorphisms in UGT2A1 may play a role in tobacco-related cancer risk.
Keywords: UDP-glucuronosyltransferase, UGT2A1, polycyclic aromatic hydrocarbons, tobacco, single nucleotide polymorphism, aerodigestive tract, lung carcinogenesis, metabolism
INTRODUCTION
The UDP-glucuronosyltransferase (UGT) superfamily of enzymes catalyze the glucuronidation of a variety of compounds, including endogenous compounds such as hormones and bilirubin, as well as xenobiotics such as drugs and carcinogens [1–3]. Based on sequence and structural homology, UGTs are classified into several families and subfamilies [4]. The entire UGT1A family is derived from a single gene locus on chromosome 2, which codes for nine functional proteins that differ only in their amino terminus as a result of alternative splicing of exon 1 to a shared carboxy terminus encoded by exons 2–5 [5]. Members of the UGT2B family contain 6 separate exons derived from independent genes that are located on chromosome 4 [5, 6]. Members of the UGT2A family combine features of both the UGT1A and UGT2B families. Similar to UGT2B family members, UGT2A genes are found on chromosome 4 and consist of 6 exons. Similar to UGT1A family members, UGT2A1 and UGT2A2 are encoded by differential first exons that are spliced to a common region encoded by exons 2–6 [5, 7].
UGT2A1 was originally cloned and characterized from human olfactory tissue, and its role in the body was hypothesized to deal with the initiation and termination of olfactory stimuli [8]. In limited expression studies, UGT2A1 was determined to be extra-hepatic, with expression observed in the olfactory epithelium, fetal lung, and brain [8]. In more recent studies comparing the expression of various phase I and phase II enzymes, including eight individual UGTs, UGT2A1 was shown to be one of the top three UGT enzymes in expression levels in both the lung and trachea [9]. Limited studies have been performed examining UGT2A1 enzyme activity and xenobiotic metabolism. UGT2A1 was originally shown to exhibit activity against a range of phenol odorants, steroids, and drugs [8]. An additional study demonstrated that UGT2A1 exhibits significant glucuronidation activity against the estrogen metabolites epiestradiol and β-estradiol at both the 3-hydroxyl and 17-hydroxyl positions; this pattern was not observed for any of the 9 UGT1A isoforms or 7 UGT2B isoforms examined [10]. Similarly, UGT2A1 was reported to exhibit substantial non-preferential activity against both testosterone and epitestosterone, a pattern not observed for any other UGT analyzed [11]. UGT2A1 was also recently reported to exhibit activity against phenylphenols and the polycyclic aromatic hydrocarbon (PAH) 1-hydroxy-(OH)-pyrene (1-HP) [7].
Various polymorphisms have been previously identified for many of the UGT genes, and several studies have examined their potential role in tobacco carcinogenesis and risk for tobacco-induced cancers [12–14]. UGT2A1 exhibits two known non-synonymous coding polymorphisms with a >1% minor allele frequency as determined by a review of HapMap [15]. A SNP (rs1347046) at base +224 (encoded by what we refer to as the UGT2A1*2 allele) results in a conservative lysine to arginine amino acid change at codon 75. This SNP, according to HapMap, has a relatively low allelic frequency of 1.1% in Han Chinese and is not reported in Caucasian, Yoruban, or Japanese populations [15]. A second SNP (rs4148301) at base +922 (encoded by what we refer to as the UGT2A1*3 allele) results in a non-conservative glycine to arginine amino acid change at codon 308. This SNP exhibits an allelic frequency of 13% in Caucasians and at least 4% in all other HapMap populations analyzed [15]. The effects of these amino acid changes on UGT2A1 activity have not been previously investigated.
Given the activity of UGT2A1 against the simple PAH 1-HP and other phenols, and its reported expression in lung and trachea, the goal of the present study was to more fully investigate the role of UGT2A1 as a potentially relevant enzyme involved in tobacco carcinogen metabolism. In addition, a more complete expression profile of UGT2A1 was completed by screening tissues of the aerodigestive tract along with other tissues never before investigated for UGT2A1 expression. A final aim of this study was to determine how non-synonymous coding SNPs affect UGT2A1 activity, with a focus on metabolism of tobacco carcinogens. Results from the present study suggest that UGT2A1 is active against a cross-section of PAHs and their metabolites, is expressed in a variety of aerodigestive tract tissues targeted by tobacco carcinogens, and non-synonymous SNPs at codons 75 and 308 cause significant changes in UGT2A1 enzyme activity in vitro. Therefore, these in vitro studies suggest that UGT2A1 may potentially play an important role in smoking-related cancer susceptibility.
MATERIALS AND METHODS
Chemicals and Materials
UDPGA, alamethicin, β-glucuronidase, DMSO, nicotine, 4-methylumbelliferone (4-MU), 1-OH-pyrene, and 1-naphthol were purchased from Sigma-Aldrich (St. Louis, MO). 4-(methylnitrosamino)-1-(3-pyridyl)-1-butanol (NNAL), N-nitrosonornicotine (NNN), N-nitrosoanabasine (NAB), N-nitrosoanatabine (NAT), 2-amino-1-methyl-6-phenylimidazo[4,5-b]pyridine (PhIP), cotinine, and 1-naphthol-glucuronide were purchased from Toronto Research Chemicals (Ontario, Canada). 1-OH-benzo(a)pyrene [B(a)P], 3-OH-B(a)P, 7-OH-B(a)P, 8-OH-B(a)P, 5-methylchrysene-1,2-diol, dibenzo(a, l)pyrene-11,12-diol, B(a)P-7,8-diol, and N-OH-PhIP and were synthesized in the Organic Synthesis Core Facility at the Penn State College of Medicine. HPLC-grade ammonium acetate, acetonitrile, and agarose were purchased from Fisher Scientific (Pittsburgh, PA). Gene expression and genotyping assays were acquired from Applied Biosystems Inc. (Carlsbad, CA). The QuikChangeR site directed mutagenesis kit was from Stratagene (La Jolia, CA). Dulbecco’s modified Eagles medium (DMEM), Dulbecco’s phosphate-buffered saline (minus calcium-chloride and magnesium-chloride), fetal bovine serum, penicillin-streptomycin, and geneticin (G418) were purchased from Gibco (Grand Island, NY). The Platinum Pfx DNA polymerase, pcDNA3.1/V5-His-TOPO mammalian expression vector, and Superscript II RT kit were obtained from Invitrogen (Carlsbad, CA). The BCA protein assay kit was purchased from Pierce (Rockford, IL). The RNeasy kit, QIAquick gel extraction kit, and Plasmid Maxi kit were all purchased from Qiagen (Valencia, CA). The FastPlasmid Mini kit was acquired from Eppendorf (Hamburg, Germany). All PCR primers were purchased from IDT (Coralville, IA).
Determination of UGT2A1 tissue expression
UGT2A1 RNA expression in tissues was determined by reverse-transcription (RT)-PCR using pooled RNA from various tissues. RNA was obtained for lung, larynx, trachea, breast, whole brain, cerebral cortex, prostrate, kidney and pancreas from Clontech (Mountain View, CA) or Stratagene (La Jolla, CA). A sample of human olfactory tissue RNA was purchased from Biochain Institute (Hayward, CA). Tonsil, colon, mouth, esophagus, and liver RNA was extracted using an RNeasy kit from normal tissue obtained from the Penn State University College of Medicine Tissue Bank. All RT-PCR assays were performed using pooled RNA from at least three normal samples for each organ/tissue. Two μg of RNA was used for RT using a Superscript II RT kit following the manufacturer’s protocol. cDNA corresponding to 100 ng of RNA was used to PCR-amplify UGT2A1 with Pfx Polymerase and sense (5′-CTGCATCAAGCCACATCATG-3′) and antisense (5′-TCCCATGATTTCCAAAGAGT-3′) primers corresponding to nucleotides −17 to +3 and nucleotides +692 and +673, respectively, relative to the UGT2A1 translation start site as previously described [8]. PCR reactions were performed in a Bio-Rad MyCycler (Hercules, CA) with an initial denaturing temperature of 94°C for 2 min, 40 cycles of 94°C for 30s, 55°C for 30s, and 68°C for 2 min, followed by a final cycle of 10 min at 68°C. RNA from a HEK293 cell line over-expressing UGT2A1 was used as a positive control for PCR amplification, while water was used as a negative control. PCR products were gel-purified using a QIAquick gel extraction kit and sequenced by the Molecular Biology Core Facility at the Penn State University College of Medicine. To verify UGT2A1 expression in tissues analyzed, PCR reactions were run multiple times with positive and negative controls.
Real-time PCR was performed to quantitatively assess UGT2A1 expression in tissues observed to express UGT2A1 following screening by RT-PCR. Real-time PCR was performed using a UGT2A1-specific TaqMan® gene expression assay (ABI Hs00792016_m1) using the standard assay protocol with RPLPO (ABI Hs99999902_m1) as the housekeeping gene. RPLPO exhibits little inter-individual variability in expression in lung and aerodigestive tract tissues (P. Lazarus, unpublished data). cDNA corresponding to 20 ng RNA was used for each real-time reaction in this experiment. Real-time PCR experiments were carried out in the Penn State Functional Genomics Core Facility using an ABI 7900 HT thermal cycler, and data was analyzed using SDS 2.2 software. Relative expression of UGT2A1 in different tissues was calculated using the delta delta Ct method relative to lung tissue which had the highest expression of UGT2A1.
Genotyping assays to determine UGT2A1*2 and UGT2A1*3 allelic prevalence
The UGT2A1*2 (Lys75Arg) and UGT2A1*3 (Gly308Arg) SNPs were genotyped using TaqMan® drug metabolism genotyping assays (ABI). Control genomic DNA from 187 Caucasians, 112 African Americans, and 30 Asian individuals were used to verify allelic prevalences for both SNPs [16, 17]. Briefly, controls were recruited as part of previous case-control studies examining risk factors important in oral cancer risk. Controls were self-reported to have no previous diagnosis of cancer and were recruited between 1994 and 2000 from the Temple University Hospital (Philadelphia, PA) and the New York Eye and Ear Infirmary (New York, NY).
For each genotyping assay, 10 ng of genomic DNA was used for each 10 μL reaction with water used as a negative control. To analyze the UGT2A1*2 SNP, a commercially-available drug metabolism genotyping assay from ABI (C_8851830_30) was used to determine the allelic frequency of the A and G at base 224. For the UGT2A1*3 SNP, a custom ABI genotyping assay (AH5H88C) was designed, with sense (5′-GGAAGAATTTATCCAGAGCTCAGGTAA-3′) and antisense (5′-TGAGGCAATAAGATTGGCCTTTTCT-3′) primers corresponding to nucleotides +870 to +897 and +973 to +948, respectively, relative to the UGT2A1 translation start site. The probe used in this assay was TGTTTTCTCTG[G/A]GATCAA, corresponding to nucleotides +911 to +929 relative to the UGT2A1 translation start site [the bracketed nucleotides represent the UGT2A1*1 (G) and UGT2A1*3 (A) alleles at base 922]. The probe for the wild-type G allele was labeled with VIC, and the probe for the variant A allele was labeled with FAM. The SNP genotyping assays were completed in the Penn State University College of Medicine Functional Genomics Core Facility, using an ABI 7900 HT thermal cycler with data analyzed using SDS 2.2 software. Automatic calls were generated using the SDS software, and calls were verified by analyzing the absolute quantification plots for each sample. Genotype frequencies in each population were checked for Hardy-Weinberg Equilibrium.
Generation of UGT2A1 over-expressing cell lines
A cell line over-expressing wild-type UGT2A1*1 was generated by RT-PCR using pooled normal lung RNA. Two μg of RNA was used with reverse transcriptase for the RT reaction, and cDNA corresponding to 100 ng lung RNA was used with Pfx Polymerase for the PCR amplification of UGT2A1. The primers used to amplify UGT2A1 from lung cDNA were 5′-CATCAAATCTTCTGCATCAAGCCAC-3′ (sense) and 5′-TGACAGGAAGAGGGTATAGTCAGC-3′ (antisense), corresponding to nucleotides −28 to −4 and +1834 to +1811, respectively, relative to the UGT2A1 translation start site. PCRs were performed with an initial denaturing temperature of 94°C for 2 min, 40 cycles of 94°C for 30s, 56°C for 45s, and 68°C for 2 min, followed by a final cycle of 10 min at 68°C. UGT2A1 sequences were verified by dideoxy sequencing of the PCR-amplified product, performed using the same PCR primers and an UGT2A1-specific internal sense primer (5′-TGAAGTCCTGGTGTCTGATTCAGT-3′, corresponding to nucleotides +432 to +455 relative to the UGT2A1 translation start site) in the Penn State University College of Medicine Molecular Biology Core Facility, and compared with that described for UGT2A1 in GenBank (NM_006798). The fully-verified wild-type UGT2A1 cDNA was cloned into the pcDNA 3.1/V5-His-TOPO vector using standard protocols using One Shot TOP10 competent E.Coli (Invitrogen). After a large-scale plasmid prep, electroporation was used to generate the HEK293 cell line over-expressing wild-type UGT2A1 using 10 μg of pcDNA 3.1/V5-His-TOPO/UGT2A1 vector. Cells were grown in DMEM supplemented with FBS and G418 to 70% confluence. Cell homogenates were prepared essentially as previously described [13]. Total RNA was extracted using the RNeasy Mini kit (Qiagen) using manufacturer’s protocols. Total homogenate protein concentrations were determined using the BCA protein assay.
The variant UGT2A1*2 and UGT2A1*3 alleles were created by site-directed mutagenesis of the pcDNA3.1/V5-His-TOPO plasmid expressing the wild-type UGT2A1*1 allele. The SNPs were induced using the QuikChangeR site-directed mutagenesis kit as described previously [13]. The primers used to change base +224 from an A (UGT2A1*1) to G (UGT2A1*2) were: sense, 5′-CATTTGAAATATATAGGGTGCCCTTTGGC-3′, and antisense, 5′-GCCAAAGGGCACCCTATATATTTCAAATG-3′, both corresponding to nucleotides +209 to +237 from the translation start site. The primers used to change base 922 from G (UGT2A1*1) to A (UGT2A1*3) were: sense, 5′-GTGGTGTTTTCTCTGAGATCAATGGTCAAAAAC-3′, and antisense, 5′-GTTTTTGACCATTGATCTCAGAGAAAACACCAC-3′, both corresponding to nucleotides +907 to +940 from the translation start site. The underlined base for each primer denotes the base pair change. The UGT2A1*2 and UGT2A1*3 cDNA sequences were confirmed by dideoxy sequencing and transfected into HEK293 cells as described above for the wild-type UGT2A1*1 allele.
Determination of UGT2A1 protein levels in UGT2A1-over-expressing HEK293 cells
UGT protein levels were determined by Western blot analysis for all UGT-over-expressing cell lines used in this study. An antibody specific for UGT2A1 was designed using Open Biosystems (Huntsville, AL). A peptide unique to the N-terminal regions of UGT2A1 (ELTDQMSFTDRIRNFISYHL) was used as an antigen in rabbits. Levels of UGT2A1 protein in each cell line were measured using the anti-UGT2A1 antibody at a 1:500 dilution as recommended by the manufacturer. Thirty μg of total protein homogenate from each UGT2A1 cell line was loaded into each lane. The monoclonal β-actin antibody (Sigma) was used as a loading control. The intensity of UGT2A1 signal was measured with the ImageJ program (NIH). As a UGT2A1 standard is not commercially available, the relative protein expression of UGT2A1 in homogenate from each cell line was calculated relative to the cell line with the highest UGT2A1 expression. The relative UGT2A1 protein levels for all three cell lines were expressed as the mean of three independent experiments, and all activity assays were normalized based on relative UGT2A1 protein expression of each respective UGT2A1-over-expressing cell lines.
Glucuronidation Assays
The glucuronidation assays using homogenates from HEK293 cell lines over-expressing wild-type and variant UGT2A1 were performed essentially as previously described [18]. Briefly, after an initial incubation of total cell homogenate protein (100 μg) with alamethicin (50 μg/mg protein) for 15 minutes on ice, glucuronidation reactions were performed in a final reaction volume of 25 μL at 37°C with 50 mM Tris-HCl (pH 7.4), 10 mM MgCl2, 4 mM UDPGA, and between 6 and 750 μM of substrate. For each substrate, the glucuronidation rate was determined at 8 concentrations that encompassed the Km of the substrate. Reactions were terminated by the addition of 25 μL cold acetonitrile on ice. Reaction mixtures were centrifuged for 10 min at 16,100 g prior to the collection of supernatant. For glucuronidation rate determinations, cell homogenate protein levels and incubation times for each substrate were determined experimentally to ensure that substrate utilization was less than 10% and to maximize levels of detection while in a linear range of glucuronide formation.
Levels of glucuronide formation were determined using a Waters Acquity UPLC System (Milford, MA) as previously described [18–21]. The flow rate was maintained at 0.5 mL/min and a reverse phase Acquity UPLC BEH C18 – 1.7 μm 2.1 × 100 mm column was used to separate free substrate and the conjugated glucuronide. A gradient of solution A (5 mM NH4OAc (pH 5.0), 10% acetonitrile) and solution B (100% acetonitrile) was used to elute the glucuronide and substrate from the column. The initial solvent gradient used to detect glucuronidation of 1-naphthol was 80% solution A/20% solution B for 2 minutes, a linear gradient to 25% solution A/75% solution B from 2 to 4 minutes, and re-equilibrium to the initial condition from 4 to 6 minutes. For other substrates, a similar gradient was used, but the initial ratio of solution A to solution B was varied slightly. The initial condition for B(a)P-7,8-diol, 5-methyl-chrysene-1,2-diol, dibenzo(a, l)pyrene-11,12-diol, 1-OH-B(a)P, 3-OH-B(a)P, 7-OH-B(a)P, and 8-OH-B(a)P was 85% A and 15% B. The initial condition for 1-OH-pyrene and 4-MU was 90% A and 10% B, while the initial condition for NNAL, nicotine, PhIP, N-OH PhIP, NNN, NAB, NAT, and cotinine was 99% A and 1% B. The UV absorbances determined experimentally for each substrate and glucuronide were as follows: 1-HP and naphthol were detected at 240 nm; 5-methylchrysene-1,2-diol, B(a)P-7,8-diol, NNAL, NNN, NAT, NAB, nicotine, and cotinine were detected at 254 nm; 1-OH-B(a)P, 3-OH-B(a)P, 7-OH-B(a)P, 8-OH-B(a)P, dibenzo(a, l)pyrene-11,12-diol, and 4-MU were detected at 305 nm; and PhIP and N-OH-PhIP were detected at 316 nm.
Quantification of glucuronide formation for each substrate was determined essentially as previously described [12, 20, 22, 23]. Briefly, the amount of glucuronide formed was determined based on the ratio of glucuronide versus unconjugated substrate after calculating the area under the curve for the substrate and glucuronide peaks using the known amount of substrate in each reaction as the reference. This quantification method was validated for 1-naphthol-glucuronide formation, since this was a glucuronide of a substrate tested in the present studies that was also available commercially. Validation was performed by constructing a 1-naphthol-glucuronide standard curve and comparing the levels of 1-naphthol-glucuronide formation calculated using the peak area ratio method described above with the values from the standard curve. This was performed for 10 independent glucuronidation reactions using a 10-fold range of 1-naphthol concentrations, and, in all cases, levels of 1-naphthol-glucuronide formation were within 5% of the level predicted from the standard curve. Glucuronides were confirmed by sensitivity to β-glucuronidase, by mass spectrometry analysis, and in the case of 1-naphthol, by comparison to an authentic 1-naphthol glucuronide standard. Reactions with non-transfected HEK293 cell homogenate, no substrate added to the reaction mixture, or only substrate and no homogenate in the reaction mixture were used as negative controls. UGT2A1 activity against 4-MU, a common UGT substrate, was used as positive control for UGT2A1 activity [24]. Three independent experiments were performed for kinetic analysis of each UGT2A1-over-expressing cell homogenate against the various substrates tested. GraphPad Prism 5 software was used to calculate kinetic values. Kinetic constants Vmax and Km for all substrates were calculated by graphing the rate of product formation versus substrate concentration and then using the Michaelis-Menten equation. For visualization as the whether the kinetics data was consistent with the simple Michaelis-Menten mechanism, the data were transformed into linear Eadie-Hofstee plots.
Statistical Analysis
The Student’s t-test was used to compare rates and kinetics of glucuronide formation for the three UGT2A1 cell lines. The Km, Vmax, and Vmax/Km of the variant UGT2A1 cell lines were compared to wild-type UGT2A1 cell line for all substrates tested.
RESULTS
Expression of UGT2A1 in human tissues
Previous studies demonstrated that UGT2A1 is expressed primarily in olfactory epithelium, with expression also observed in the brain, lung and trachea [8]. In the present study, a more comprehensive analysis was undertaken to examine UGT2A1 expression, particularly focusing on tissues of the aerodigestive tract. In an initial screening, pooled RNA samples were obtained and probed non-quantitatively for UGT2A1 expression by RT-PCR (Fig. 1, panel A). UGT2A1 was well-expressed in the lung, larynx, trachea, tonsil, and colon; a low level of expression was observed in floor of mouth. Using real-time PCR (Fig. 1, panel B), the relative levels of UGT2A1 expression was demonstrated to be the highest in lung (used as the reference at 1.0) followed by the trachea (0.91 ± 0.04) > tonsil (0.61 ± 0.07) > larynx (0.51 ± 0.07) > colon (0.33 ± 0.05) > olfactory epithelium (0.19 ± 0.04). No UGT2A1 expression was detected after multiple RT-PCR attempts or by real-time PCR in prostate, liver, or pancreas (Fig. 1, panel A), or esophagus, whole brain, cerebral cortex, kidney or breast (results not shown).
Fig. 1. Characterization of UGT2A1 tissue expression.
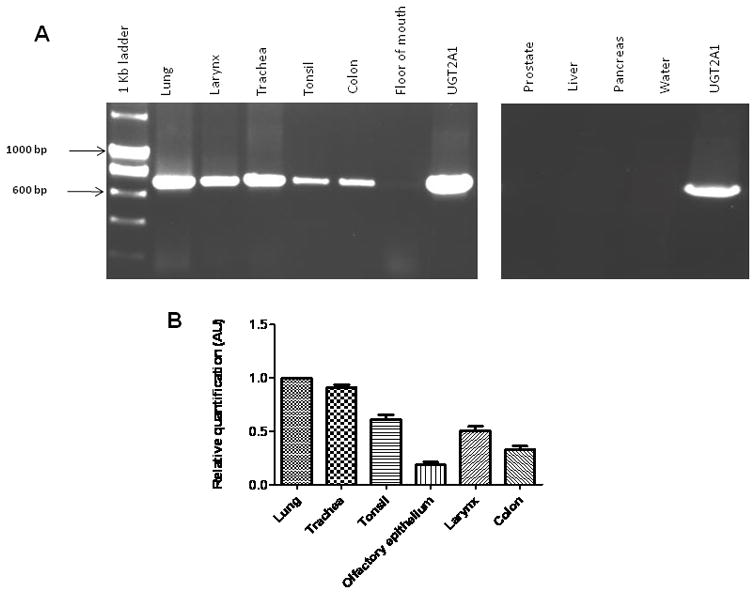
(A) Initial characterization of UGT2A1 expression in multiple human tissues using RT-PCR. RNA pooled from at least three individuals was used to assess overall UGT2A1 expression. RNA from HEK293 cell lines over-expressing wild-type UGT2A1was used as a positive control; water in place of cDNA was used as a negative control. (B) Quantitative analysis of UGT2A1 expression in human tissues. RNA from tissues exhibiting UGT2A1 expression in Fig. 1A was used in conjunction with a UGT2A1-specific real-time PCR assay (ABI) to quantitatively assess UGT2A1 expression. Relative UGT2A1 mRNA tissue expression was determined by comparing mRNA levels in each tissue to that observed in the tissue with the highest UGT2A1 expression (i.e., lung). Results, expressed as the mean ± SD of triplicates, were normalized to RPLPO mRNA expression in each tissue.
Kinetic studies of UGT2A1 carcinogen metabolism
As UGT2A1 was shown to be well-expressed in lung and a variety of aerodigestive tract tissues, the goal was to examine the glucuronidation activity of UGT2A1 against a variety of tobacco carcinogens. Using homogenates from a wild-type UGT2A1-over-expressing HEK293 cell line, in vitro glucuronidation assays demonstrated UGT2A1 activity against the known UGT2A1 substrate, 4-MU (results not shown) as well as the simple PAH, 1-naphthol, with a naphthol-1-O-glucuronide peak at 1.3 min and a naphthol substrate peak at 4.0 min by UPLC (Fig. 2, panel A). The naphthol-1-O-glucuronide peak was sensitive to treatment with β-glucuronidase (Fig. 2, panel B). Similarly, the proximate carcinogen 5-methylchrysene-1,2-diol was also glucuronidated by wild-type UGT2A1, with the retention time of the glucuronide of 5-methylchrysene-1,2-diol at 3.2 min versus 4.0 min for the unconjugated substrate (Fig. 2, panel D). Representative Eadie-Hofstee plots are shown for wild-type UGT2A1against 1-naphthol (Fig. 2, panel F) and 5-methylchrysene-1,2-diol (Fig. 2, panel G). Kinetic analysis demonstrated similarly high glucuronidation activity for wild-type UGT2A1 against all other PAHs tested including 1-OH-pyrene, 1-OH-B(a)P, 3-OH-B(a)P, 7-OH-B(a)P, 8-OH-B(a)P, dibenzo(a, l)pyrene-11,12-diol, and B(a)P-7,8-diol (Table 1). UGT2A1 exhibited no detectable activity against several tobacco-specific nitrosamines (NNAL, NNN, NAT or NAB), nicotine or its major metabolite cotinine (results not shown). In addition, UGT2A1 exhibited no glucuronidation against the heterocyclic amine and important colon carcinogen, PhIP, or its major metabolite, N-OH-PhIP (results not shown).
Fig. 2. UPLC analyses of UGT2A1 over-expressing cell line glucuronidation activities.
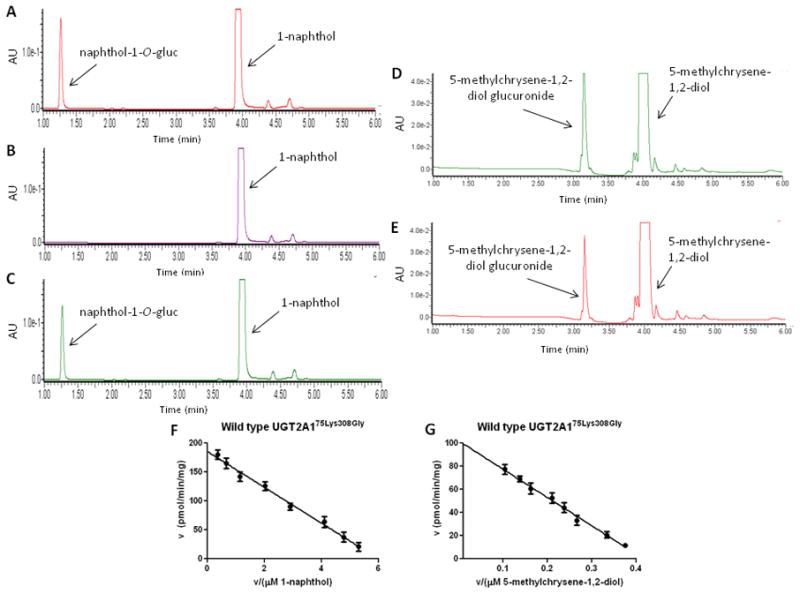
(A) UPLC trace of 1-naphthol-0-glucuronide formation following incubation with wild-type UGT2A1 cell homogenate. (B) UPLC trace of reaction from top panel following treatment with 1000 units of E. Coli β-glucuronidase. (C) UPLC trace of 1-naphthol-O-glucuronide formation using homogenate from cell line over-expressing the UGT2A175Arg308Gly variant. (D) UPLC trace of 5-methylchrysene-1,2-diol glucuronide formation following incubation with wild-type UGT2A1 cell homogenate. (E) UPLC trace of 5-methylchrysene-1,2-diol glucuronide formation using homogenate from cell line over-expressing UGT2A175Arg308Gly. (F) Eadie-Hofstee plot of 1-napthol glucuronidation by wild-type UGT2A1. (G) Eadie-Hofstee plot of 5-methyl-chrysene-1,2-diol glucuronidation by wild-type UGT2A1.
Table 1.
Enzyme kinetics summary of UGT2A1 activity against PAH substrates
| Substrate | UGT2A175Lys308Gly | UGT2A175Arg308Gly | ||||
|---|---|---|---|---|---|---|
| Km (μM) | Vmax (pmol/min/mg)a | Vmax/Km (μL/min/mg)a | Km (μM) | Vmax (pmol/min/mg)a | Vmax/Km (μL/min/mg)a | |
| 1-hydroxypyrene | 91 ± 7.2 | 300 ± 17 | 3.3 ± 0.2 | 111 ± 19 | 269 ± 18 | 2.4 ± 0.2b |
| 1-naphthol | 30 ± 2.9 | 185 ± 11 | 6.2 ± 0.4 | 44 ± 11b | 177 ± 20 | 4.0 ± 0.7b |
| 5-methylchrysene-1,2-diol | 270 ± 24 | 100 ± 7.2 | 0.37 ± 0.04 | 381 ± 37b | 87 ± 7.4 | 0.23 ± 0.02b |
| dibenzo(a, l)pyrene-11,12-diol | 284 ± 27 | 26 ± 1.0 | 0.09 ± 0.004 | 307 ± 8.9 | 22 ± 0.4b | 0.07 ± 0.001b |
| benzo(a)pyrene-7,8-diol | 397 ± 33 | 109 ± 14 | 0.28 ± 0.04 | 426 ± 53 | 86 ± 8.1b | 0.20 ± 0.009b |
| 1-OH benzo(a)pyrene | 247 ± 12 | 70 ± 4.4 | 0.28 ± 0.01 | 263 ± 29 | 61 ± 1.4b | 0.23 ± 0.02b |
| 3-OH benzo(a)pyrene | 271 ± 15 | 84 ± 3.6 | 0.31 ± 0.008 | 278 ± 21 | 74 ± 1.6b | 0.27 ± 0.014b |
| 7-OH benzo(a)pyrene | 261 ± 35 | 58 ± 4.6 | 0.22 ± 0.01 | 334 ± 20 | 49 ± 2.4b | 0.15 ± 0.004b |
| 8-OH benzo(a)pyrene | 308 ± 20 | 76 ± 6.6 | 0.25 ± 0.008 | 368 ± 51 | 60 ± 5.1b | 0.16 ± 0.02b |
Data expressed as mg of total protein homogenate, corrected for relative UGT2A1 protein. Km, Vmax, and Vmax/Km represent the mean of three independent experiments.
Denotes p<0.05 versus corresponding value for UGT2A175Lys308Gly.
Effect of UGT2A1 SNPs on glucuronidation activity
The effects of two UGT2A1 non-synonymous coding SNPs on UGT2A1 enzyme activity were investigated in this study. The UGT2A1*2 SNP (adenine to guanine at base +224) that causes a lysine to arginine change at codon 75 was reported by HapMap only for the Han Chinese with an allelic prevalence of 1.1% [15]. The UGT2A1*3 SNP (guanine to adenine at base +922), which causes a glycine to arginine amino acid change at codon 308, was reported by HapMap to be found in all populations tested, with the highest allelic prevalence being 13.1% in Caucasians [15]. In a screening of healthy control subjects recruited as part of previous case-control studies [16, 17], the UGT2A1*2 SNP had an allelic frequency of 8.3% in Asians (n=30 subjects) and 4.0% in both Caucasians (n=186 subjects) and African Americans (n=111 subjects; Table 2). The UGT2A1*3 SNP was found to have an overall allelic prevalence of 5.0% in Asians (n=30 subjects), 10.4% in Caucasians (187 subjects), and 4.5% in African Americans (n=112 subjects; Table 2). None of the subjects with the codon 75Arg variant also exhibited a codon 308Arg variant. The genotype distributions followed Hardy-Weinberg equilibrium for both SNPs in all populations examined.
Table 2.
Prevalence of UGT2A1 SNPs
| UGT2A1 SNP | Genotype | Caucasians | African Americans | Asians | Totala |
|---|---|---|---|---|---|
| Lys75Arg | AA | 172 | 102 | 26 | 300 |
| AG | 13 | 9 | 3 | 25 | |
| GG | 1 | 0 | 1 | 2 | |
| MAFb | 4.0% | 4.0% | 8.3% | 4.4% | |
| Gly308Arg | GG | 151 | 102 | 27 | 280 |
| GA | 33 | 10 | 3 | 46 | |
| AA | 3 | 0 | 0 | 3 | |
| MAFb | 10.4% | 4.5% | 5.0% | 7.9% |
Informative results were obtained for 30 Asians, 186 Caucasians, and 111 African Americans for the codon 75 SNP, and 30 Asians, 187 Caucasians, and 112 African Americans for the codon 308 SNP.
MAF, minor allele frequency.
To examine the function of the two SNPs on UGT2A1 glucuronidation activity, the UGT2A175Arg308Gly and UGT2A175Lys308Arg variants were cloned into the HEK293 cell line and their activity was compared to that of wild-type UGT2A175Lys308Gly. As shown in Figure 3, Western blot analysis using an anti-UGT2A1 antibody showed high levels of UGT2A1 expression in each of the UGT2A1-over-expressing HEK293 cell lines. No cross-reactivity was observed with other UGTs using protein homogenates from UGT1A1- or UGT2B7-over-expressing cell lines (Fig. 3, panel A), or homogenate from a UGT2A3-over-expressing cell line (data not shown). Homogenates from the UGT2A175Arg308Gly- and UGT2A175Lys308Arg-over-expressing cell lines demonstrated slightly less UGT2A1 protein relative to that of the wild-type UGT2A175Lys308Gly-over-expressing cell line (Fig. 3, panel B). Relative UGT2A1 protein levels were calculated for each cell line and used for normalization of kinetic data, with the wild-type UGT2A1-over-expressing cell line set as the reference at 1.0. For UGT2A1 enzyme kinetics calculations, the rate at each substrate concentration was normalized to the relative UGT2A1 protein expression in each UGT2A1 cell line based on Western blot analysis.
Fig. 3. Western blot analysis of UGT2A1 protein expression in HEK293 over-expressing cell lines.
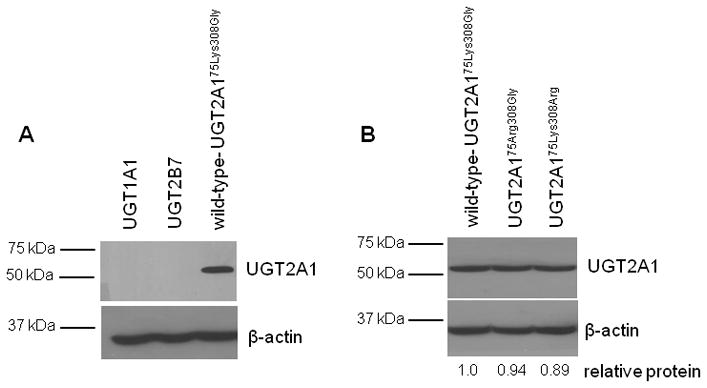
(A) Antibody against UGT2A1 was analyzed for specificity and possible cross-reactivity using homogenate from HEK293 cell lines over-expressing UGT1A1, UGT2B7, and UGT2A1. (B) Protein levels in the wild-type and variant UGT2A1-over-expressing cell lines. An equal amount (30 μg) of total protein homogenate from each cell lysate was loaded to each lane. β-actin was used as a loading control. The relative ratio of UGT2A1 protein to β-actin protein was used to determine relative UGT2A1 protein expression in each over-expressing cell line. The protein level of wild-type UGT2A175Lys308Gly homogenate was set to 1.0 as a reference. UGT2A175Arg308Gly homogenate had a relative protein level of 0.94±0.03 and UGT2A175Lys308Arg homogenate had a relative protein level of 0.89±0.04, compared to the wild- type UGT2A1 homogenate. The relative UGT2A1 protein expression in each cell line was determined using the mean of three independent Western blot experiments.
Homogenate from HEK293 cells over-expressing the UGT2A175Arg308Gly variant showed glucuronidation activity against both 1-naphthol (Fig. 2, panel C) and 5-methylchrysene-1,2-diol (Fig. 2, panel E). Kinetic analysis demonstrated that the UGT2A175Arg308Gly variant exhibited a significantly (p<0.05) higher Km and significantly (p<0.05) lower Vmax/Km as compared to wild-type UGT2A175Lys308Gly for both 1-naphthol and 5-methylchrysene-1,2-diol (Table 1). A similar decrease in activity was observed for the UGT2A175Arg308Gly variant against all other PAHs tested, with a significantly higher Vmax/Km exhibited by wild-type UGT2A175Lys308Gly against dibenzo(a, l)pyrene-11,12-diol, B(a)P-7,8-diol, 1-OH-B(a)P, 3-OH-B(a)P, 7-OH-B(a)P, 8-OH-B(a)P, and 1-OH-pyrene (p<0.05 for each).
The UGT2A175Lys308Arg variant exhibited no detectable glucuronidation activity against 1-naphthol or 5-methylchrysene-1,2-diol and was inactive against all other substrates tested in this study using up to 200 μg cellular homogenate and 750 μM substrate in a 12 h incubation (results not shown). This variant also lacked activity against 4-MU, a known UGT2A1 substrate and a common substrate of most UGT isoforms [24].
Discussion
This study is the first to demonstrate that UGT2A1 is expressed in a variety of tissues that are target sites for tobacco carcinogenesis and that UGT2A1 exhibits glucuronidation activity against members of the PAH class of carcinogens. This study confirmed previous studies demonstrating that UGT2A1 is expressed in trachea [9] and for the first time demonstrated expression in other aerodigestive tract tissues including larynx and tonsil. Other PAH-metabolizing UGTs known to be well-expressed in multiple aerodigestive tract tissues include UGTs 1A7 and 1A10 [13], but the relative level of expression of UGT2A1 versus UGTs 1A7 and 1A10 has not yet been determined. The present study also confirmed previous studies indicating relatively high UGT2A1 expression in lung [9]. While UGT1A6 was expressed at a higher level in lung in a previous study [9], this enzyme exhibits limited activity against simple B(a)P metabolites such as 7-OH B(a)P, and no reported activity against more complex activated B(a)P metabolites, such as B(a)P-7,8-diol [25–27]. Of the other UGTs that are active against PAHs, UGT1A10 is expressed in lung but at relatively low levels [13, 26, 28]. Together, these data suggest that UGT2A1 may be important in detoxifying PAHs in multiple aerodigestive tract tissues as well as in lung. UGT2A1 was also found to be expressed in colon, where dietary PAH exposure is a known risk factor for colorectal cancer [29, 30]. No glucuronidation activity was observed for UGT2A1 against carcinogens other than PAHs, including tobacco-specific nitrosamines or heterocyclic amines. Tobacco-specific nitrosamines and heterocyclic amines are glucuronidated at electrophilic nitrogen moieties, which suggests that UGT2A1 is not an efficient enzyme for N-glucuronidation.
Functional polymorphisms have been identified in many UGT genes, and several polymorphisms have been shown to significantly alter enzyme activity and impact cancer risk. Three variant protein isoforms exist for UGT1A7 that exhibit differences in enzyme activity against B(a)P metabolites and other substrates as compared to wild-type UGT1A7 [31]. Low-activity UGT1A7 alleles have been linked to increased risk for hepatic and colorectal cancer [32–34], and also have been linked to an increased risk for orolaryngeal cancer in smokers [16]. A SNP at codon 139 in the UGT1A10 gene has been linked to altered orolaryngeal cancer risk in African Americans [17]. The UGT2B17 whole-gene deletion polymorphism (UGT2B17*2) has been found to be associated with a gender-specific increased risk for lung adenocarcinoma, with this association likely due to UGT2B17’s glucuronidation activity towards NNAL [14, 35].
Results from the present study demonstrate that polymorphic variants in UGT2A1 exhibit decreased glucuronidation activity against PAHs. The UGT2A175Arg308Gly variant exhibited a ~25% decrease in activity as compared to wild-type UGT2A1 against a variety of PAHs; this modest change in activity is unlikely to have major physiological relevance. -Conversely, the UGT2A175Lys308Arg variant did not exhibit glucuronidation activity against any substrate tested. The glycine to arginine amino acid change at codon 308 is a non-conservative amino acid change in the C-terminus of the UGT protein, which is the UDPGA-binding region of the enzyme [36]. Analysis of a crystal structure of the UDPGA-binding domain of UGT2B7 suggests that a glycine residue in UGT2B7, at codon 310, is critical to protein folding to create a UDPGA-binding pocket [37]. This codon 310 glycine residue is conserved between all UGT2B members and the UGT1A common region, and corresponds to the glycine residue in UGT2A1 codon 308 upon amino acid sequence alignment (Fig. 4). Although the complete crystal structure of UGT2A1 is unknown, there is a high likelihood that UGT2A1 and UGT2B7 have similar UDPGA-binding regions due to high (70%) amino acid homology between these two enzymes [8]. A recently completed homology model of UGT1A1 also predicts the Gly308 residue in UGT1A1 to be critical for UDPGA binding [38]. Therefore, the polymorphic non-conservative glycine to arginine change in this highly conserved UGT region could inhibit UDPGA-binding by altering protein folding, thus significantly disrupting UGT activity.
Fig. 4. Conservation of codon 308 glycine residue in UGT2A1.
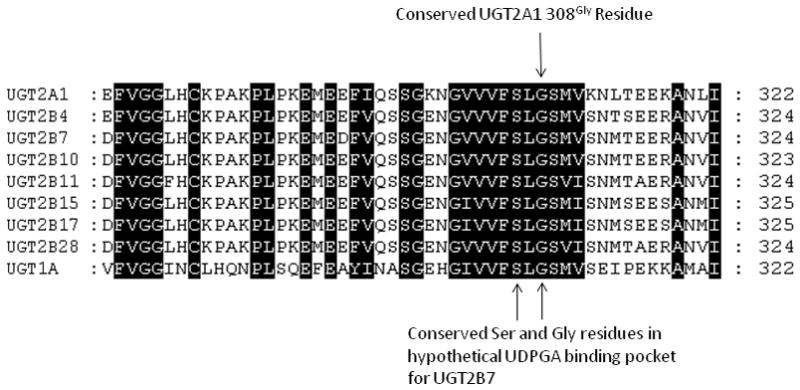
Alignment of the UDPGA-binding region domain for UGT2A1, UGT2B enzymes, and the common UGT1A region, including the glycine residue at codon 308 in UGT2A1. The conserved serine and glycine residues form a portion of the hypothetical UDPGA-binding domain in the crystal structure of UGT2B7 [37].
The UGT2A1*2 SNP at codon 75 was reported by HapMap to have a low allelic prevalence of 1.1% in Han Chinese individuals and was not observed in other racial groups [15]. The data presented here suggest that this SNP may have a greater allelic prevalence in an Asian population (~8%) and may also be found in a significant proportion of Caucasians and African Americans (~4% allelic prevalence for both groups). Differences observed between our study and that reported in HapMap may be due to low subject numbers; a larger genotyping study may be warranted to determine the true allelic frequency of the codon 75 SNP in different racial groups. Another non-synonymous coding SNP in UGT2A1, a valine to isoleucine change at codon 391 (rs4148304), is reported to only be expressed in Caucasians, and at a low allelic frequency of 0.8% [15]. This SNP was not analyzed in our study due to its low allelic frequency, but it may warrant further investigation into its functional effects particularly if the allelic frequency of this SNP is determined to be higher than what is currently published by HapMap.
UGT2A1 and UGT2A2 transcripts are comprised of individual first exons spliced to common exons 2–6 [5, 7]. The UGT2A1*2 SNP is located in exon 1, making the functional effects of this SNP unique to UGT2A1. The codon 308 SNP encoded by the UGT2A1*3 allele lies within the common region shared by UGT2A1 and 2A2. One study to date has characterized UGT2A2, reporting UGT2A2 to be expressed in the nasal mucosa and to have substrate specificity against simple phenols and estrogen metabolites [7]. Additional studies analyzing UGT2A2, including a more widespread screen for expression in tobacco target organs and an activity screen against tobacco carcinogens, are necessary to determine UGT2A2’s potential role in tobacco carcinogen metabolism and possible codon 308 SNP-induced effects on UGT2A2 activity.
Together, the in vitro data presented in this study suggest that UGT2A1 may play an important role in PAH metabolism in multiple target organs and that prevalent SNPs within UGT2A1 alter its glucuronidation activity against these substrates. Large case-control studies will be required to examine the potential linkage between these SNPs and cancer risk.
Acknowledgments
Funding:
This work was supported in part by the National Institutes of Health National Institute of Dental and Craniofacial Research [Grant R01-DE13158]; and the Pennsylvania Department of Health’s Health Research Formula Funding Programs [Grants 4100038714, 4100038715].
We thank the Penn State Cancer Institute’s Organic Synthesis Core for supplying various PAH carcinogens used in this study. We also thank the Functional Genomics Core and the Molecular Biology Core at the Penn State University College of Medicine for DNA sequencing, DNA genotyping, and equipment used for real-time PCR and genotyping analysis.
References
- 1.Ren Q, Murphy SE, Zheng Z, Lazarus P. O-Glucuronidation of the lung carcinogen 4-(methylnitrosamino)-1- (3-pyridyl)-1-butanol (NNAL) by human UDP-glucuronosyltransferases 2B7 and 1A9. Drug Metab Dispos. 2000;28(11):1352–60. [PubMed] [Google Scholar]
- 2.Gueraud F, Paris A. Glucuronidation: a dual control. Gen Pharmacol. 1998;31(5):683–8. doi: 10.1016/s0306-3623(98)00114-1. [DOI] [PubMed] [Google Scholar]
- 3.Tephly TR, Burchell B. UDP-glucuronosyltransferases: a family of detoxifying enzymes. Trends Pharmacol Sci. 1990;11(7):276–9. doi: 10.1016/0165-6147(90)90008-v. [DOI] [PubMed] [Google Scholar]
- 4.Jin C, Miners JO, Lillywhite KJ, Mackenzie PI. Complementary deoxyribonucleic acid cloning and expression of a human liver uridine diphosphate-glucuronosyltransferase glucuronidating carboxylic acid-containing drugs. J Pharmacol Exp Ther. 1993;264(1):475–9. [PubMed] [Google Scholar]
- 5.Mackenzie PI, Bock KW, Burchell B, Guillemette C, Ikushiro S, Iyanagi T, et al. Nomenclature update for the mammalian UDP glycosyltransferase (UGT) gene superfamily. Pharmacogenet Genomics. 2005;15(10):677–85. doi: 10.1097/01.fpc.0000173483.13689.56. [DOI] [PubMed] [Google Scholar]
- 6.Beaulieu M, Levesque E, Tchernof A, Beatty BG, Belanger A, Hum DW. Chromosomal localization, structure, and regulation of the UGT2B17 gene, encoding a C19 steroid metabolizing enzyme. DNA Cell Biol. 1997;16(10):1143–54. doi: 10.1089/dna.1997.16.1143. [DOI] [PubMed] [Google Scholar]
- 7.Sneitz N, Court MH, Zhang X, Laajanen K, Yee KK, Dalton P, et al. Human UDP-glucuronosyltransferase UGT2A2: cDNA construction, expression, and functional characterization in comparison with UGT2A1 and UGT2A3. Pharmacogenet Genomics. 2009 doi: 10.1097/FPC.0b013e3283330767. [DOI] [PMC free article] [PubMed] [Google Scholar]
- 8.Jedlitschky G, Cassidy AJ, Sales M, Pratt N, Burchell B. Cloning and characterization of a novel human olfactory UDP-glucuronosyltransferase. Biochem J. 1999;340 ( Pt 3):837–43. [PMC free article] [PubMed] [Google Scholar]
- 9.Nishimura M, Naito S. Tissue-specific mRNA expression profiles of human phase I metabolizing enzymes except for cytochrome P450 and phase II metabolizing enzymes. Drug Metab Pharmacokinet. 2006;21(5):357–74. doi: 10.2133/dmpk.21.357. [DOI] [PubMed] [Google Scholar]
- 10.Itaaho K, Mackenzie PI, Ikushiro S, Miners JO, Finel M. The configuration of the 17-hydroxy group variably influences the glucuronidation of beta-estradiol and epiestradiol by human UDP-glucuronosyltransferases. Drug Metab Dispos. 2008;36(11):2307–15. doi: 10.1124/dmd.108.022731. [DOI] [PubMed] [Google Scholar]
- 11.Sten T, Bichlmaier I, Kuuranne T, Leinonen A, Yli-Kauhaluoma J, Finel M. UDP-glucuronosyltransferases (UGTs) 2B7 and UGT2B17 display converse specificity in testosterone and epitestosterone glucuronidation, whereas UGT2A1 conjugates both androgens similarly. Drug Metab Dispos. 2009;37(2):417–23. doi: 10.1124/dmd.108.024844. [DOI] [PubMed] [Google Scholar]
- 12.Chen G, Dellinger RW, Gallagher CJ, Sun D, Lazarus P. Identification of a prevalent functional missense polymorphism in the UGT2B10 gene and its association with UGT2B10 inactivation against tobacco-specific nitrosamines. Pharmacogenet Genomics. 2008;18(3):181–91. doi: 10.1097/FPC.0b013e3282f4dbdd. [DOI] [PubMed] [Google Scholar]
- 13.Dellinger RW, Fang JL, Chen G, Weinberg R, Lazarus P. Importance of UDP-glucuronosyltransferase 1A10 (UGT1A10) in the detoxification of polycyclic aromatic hydrocarbons: decreased glucuronidative activity of the UGT1A10139Lys isoform. Drug Metab Dispos. 2006;34(6):943–9. doi: 10.1124/dmd.105.009100. [DOI] [PubMed] [Google Scholar]
- 14.Gallagher CJ, Muscat JE, Hicks AN, Zheng Y, Dyer AM, Chase GA, et al. The UDP-glucuronosyltransferase 2B17 gene deletion polymorphism: sex-specific association with urinary 4-(methylnitrosamino)-1-(3-pyridyl)-1-butanol glucuronidation phenotype and risk for lung cancer. Cancer Epidemiol Biomarkers Prev. 2007;16(4):823–8. doi: 10.1158/1055-9965.EPI-06-0823. [DOI] [PubMed] [Google Scholar]
- 15.The International HapMap Project. Nature. 2003;426(6968):789–96. doi: 10.1038/nature02168. [DOI] [PubMed] [Google Scholar]
- 16.Zheng Z, Park JY, Guillemette C, Schantz SP, Lazarus P. Tobacco carcinogen-detoxifying enzyme UGT1A7 and its association with orolaryngeal cancer risk. J Natl Cancer Inst. 2001;93(18):1411–8. doi: 10.1093/jnci/93.18.1411. [DOI] [PubMed] [Google Scholar]
- 17.Elahi A, Bendaly J, Zheng Z, Muscat JE, Richie JP, Jr, Schantz SP, et al. Detection of UGT1A10 polymorphisms and their association with orolaryngeal carcinoma risk. Cancer. 2003;98(4):872–80. doi: 10.1002/cncr.11587. [DOI] [PubMed] [Google Scholar]
- 18.Fang JL, Beland FA, Doerge DR, Wiener D, Guillemette C, Marques MM, et al. Characterization of benzo(a)pyrene-trans-7,8-dihydrodiol glucuronidation by human tissue microsomes and overexpressed UDP-glucuronosyltransferase enzymes. Cancer Res. 2002;62(7):1978–86. [PubMed] [Google Scholar]
- 19.Wiener D, Fang JL, Dossett N, Lazarus P. Correlation between UDP-glucuronosyltransferase genotypes and 4-(methylnitrosamino)-1-(3-pyridyl)-1-butanone glucuronidation phenotype in human liver microsomes. Cancer Res. 2004;64(3):1190–6. doi: 10.1158/0008-5472.can-03-3219. [DOI] [PubMed] [Google Scholar]
- 20.Balliet RM, Chen G, Gallagher CJ, Dellinger RW, Sun D, Lazarus P. Characterization of UGTs active against SAHA and association between SAHA glucuronidation activity phenotype with UGT genotype. Cancer Res. 2009;69(7):2981–9. doi: 10.1158/0008-5472.CAN-08-4143. [DOI] [PMC free article] [PubMed] [Google Scholar]
- 21.Sun D, Sharma AK, Dellinger RW, Blevins-Primeau AS, Balliet RM, Chen G, et al. Glucuronidation of active tamoxifen metabolites by the human UDP glucuronosyltransferases. Drug Metab Dispos. 2007;35(11):2006–14. doi: 10.1124/dmd.107.017145. [DOI] [PubMed] [Google Scholar]
- 22.Dellinger RW, Chen G, Blevins-Primeau AS, Krzeminski J, Amin S, Lazarus P. Glucuronidation of PhIP and N-OH-PhIP by UDP-glucuronosyltransferase 1A10. Carcinogenesis. 2007;28(11):2412–8. doi: 10.1093/carcin/bgm164. [DOI] [PubMed] [Google Scholar]
- 23.Blevins-Primeau AS, Sun D, Chen G, Sharma AK, Gallagher CJ, Amin S, et al. Functional significance of UDP-glucuronosyltransferase variants in the metabolism of active tamoxifen metabolites. Cancer Res. 2009;69(5):1892–900. doi: 10.1158/0008-5472.CAN-08-3708. [DOI] [PMC free article] [PubMed] [Google Scholar]
- 24.Uchaipichat V, Mackenzie PI, Guo XH, Gardner-Stephen D, Galetin A, Houston JB, et al. Human udp-glucuronosyltransferases: isoform selectivity and kinetics of 4-methylumbelliferone and 1-naphthol glucuronidation, effects of organic solvents, and inhibition by diclofenac and probenecid. Drug Metab Dispos. 2004;32(4):413–23. doi: 10.1124/dmd.32.4.413. [DOI] [PubMed] [Google Scholar]
- 25.Jin CJ, Miners JO, Burchell B, Mackenzie PI. The glucuronidation of hydroxylated metabolites of benzo[a]pyrene and 2-acetylaminofluorene by cDNA-expressed human UDP-glucuronosyltransferases. Carcinogenesis. 1993;14(12):2637–9. doi: 10.1093/carcin/14.12.2637. [DOI] [PubMed] [Google Scholar]
- 26.Zheng Z, Fang JL, Lazarus P. Glucuronidation: an important mechanism for detoxification of benzo[a]pyrene metabolites in aerodigestive tract tissues. Drug Metab Dispos. 2002;30(4):397–403. doi: 10.1124/dmd.30.4.397. [DOI] [PubMed] [Google Scholar]
- 27.Luukkanen L, Mikkola J, Forsman T, Taavitsainen P, Taskinen J, Elovaara E. Glucuronidation of 1-hydroxypyrene by human liver microsomes and human UDP-glucuronosyltransferases UGT1A6, UGT1A7, and UGT1A9: development of a high-sensitivity glucuronidation assay for human tissue. Drug Metab Dispos. 2001;29(8):1096–101. [PubMed] [Google Scholar]
- 28.Nakamura A, Nakajima M, Yamanaka H, Fujiwara R, Yokoi T. Expression of UGT1A and UGT2B mRNA in human normal tissues and various cell lines. Drug Metab Dispos. 2008;36(8):1461–4. doi: 10.1124/dmd.108.021428. [DOI] [PubMed] [Google Scholar]
- 29.Girard H, Butler LM, Villeneuve L, Millikan RC, Sinha R, Sandler RS, et al. UGT1A1 and UGT1A9 functional variants, meat intake, and colon cancer, among Caucasians and African-Americans. Mutat Res. 2008;644(1–2):56–63. doi: 10.1016/j.mrfmmm.2008.07.002. [DOI] [PMC free article] [PubMed] [Google Scholar]
- 30.Butler LM, Sinha R, Millikan RC, Martin CF, Newman B, Gammon MD, et al. Heterocyclic amines, meat intake, and association with colon cancer in a population-based study. Am J Epidemiol. 2003;157(5):434–45. doi: 10.1093/aje/kwf221. [DOI] [PubMed] [Google Scholar]
- 31.Guillemette C, Ritter JK, Auyeung DJ, Kessler FK, Housman DE. Structural heterogeneity at the UDP-glucuronosyltransferase 1 locus: functional consequences of three novel missense mutations in the human UGT1A7 gene. Pharmacogenetics. 2000;10(7):629–44. doi: 10.1097/00008571-200010000-00006. [DOI] [PubMed] [Google Scholar]
- 32.Kim PM, Wells PG. Genoprotection by UDP-glucuronosyltransferases in peroxidase-dependent, reactive oxygen species-mediated micronucleus initiation by the carcinogens 4-(methylnitrosamino)-1-(3-pyridyl)-1-butanone and benzo[a]pyrene. Cancer Res. 1996;56(7):1526–32. [PubMed] [Google Scholar]
- 33.Ockenga J, Vogel A, Teich N, Keim V, Manns MP, Strassburg CP. UDP glucuronosyltransferase (UGT1A7) gene polymorphisms increase the risk of chronic pancreatitis and pancreatic cancer. Gastroenterology. 2003;124(7):1802–8. doi: 10.1016/s0016-5085(03)00294-4. [DOI] [PubMed] [Google Scholar]
- 34.Strassburg CP, Vogel A, Kneip S, Tukey RH, Manns MP. Polymorphisms of the human UDP-glucuronosyltransferase (UGT) 1A7 gene in colorectal cancer. Gut. 2002;50(6):851–6. doi: 10.1136/gut.50.6.851. [DOI] [PMC free article] [PubMed] [Google Scholar]
- 35.Lazarus P, Zheng Y, Aaron Runkle E, Muscat JE, Wiener D. Genotype-phenotype correlation between the polymorphic UGT2B17 gene deletion and NNAL glucuronidation activities in human liver microsomes. Pharmacogenet Genomics. 2005;15(11):769–78. doi: 10.1097/01.fpc.0000175596.52443.ef. [DOI] [PubMed] [Google Scholar]
- 36.Nagar S, Remmel RP. Uridine diphosphoglucuronosyltransferase pharmacogenetics and cancer. Oncogene. 2006;25(11):1659–72. doi: 10.1038/sj.onc.1209375. [DOI] [PubMed] [Google Scholar]
- 37.Miley MJ, Zielinska AK, Keenan JE, Bratton SM, Radominska-Pandya A, Redinbo MR. Crystal structure of the cofactor-binding domain of the human phase II drug-metabolism enzyme UDP-glucuronosyltransferase 2B7. J Mol Biol. 2007;369(2):498–511. doi: 10.1016/j.jmb.2007.03.066. [DOI] [PMC free article] [PubMed] [Google Scholar]
- 38.Laakkonen L, Finel M. A molecular model of the human UDP-glucuronosyltransferase 1A1, its membrane orientation, and the interactions between different parts of the enzyme. Mol Pharmacol. 77(6):931–9. doi: 10.1124/mol.109.063289. [DOI] [PubMed] [Google Scholar]