

Abstract
There is accumulating evidence that cinnamon extracts contain components that enhance insulin action. However, little is know about the effects of cinnamon on non-insulin stimulated glucose uptake. Therefore, the effects of cinnamaldehyde on the glucose transport activity of GLUT1 in L929 fibroblast cells were examined under both basal conditions and conditions where glucose uptake is activated by glucose deprivation. The data reveal that cinnamaldehyde has a dual action on the glucose transport activity of GLUT1. Under basal conditions it stimulates glucose uptake and reaches a 3.5 fold maximum stimulation at 2.0 mM. However, cinnamaldehyde also inhibits the activation of glucose uptake by glucose deprivation in a dose dependent manner. Experiments with cinnamaldehyde analogs reveal that these activities are dependent on the α,β-unsaturated aldehyde structural motif in cinnamaldehyde. The inhibitory, but not the stimulatory activity of cinnamaldehyde was maintained after a wash-recovery period. Pretreatment of cinnamaldehyde with thiol-containing compounds, such as β-mercaptoethanol or cysteine, blocked the inhibitory activity of cinnamaldehyde. These results suggest that cinnamaldehyde inhibits the activation of GLUT1 by forming a covalent link to target cysteine residue/s. This dual activity of cinnamaldehyde on the transport activity of GLUT1 suggests that cinnamaldehye is not a major contributor to the anti-diabetic properties of cinnamon.
1. Introduction
There is increasing interest in the use of cinnamon as a natural insulin sensitizer for the treatment of type 2 diabetes. Randomized human trials of the effectiveness of cinnamon on glycemic control have yielded mixed results [1–6]. A meta-analysis that included five studies which measured different parameters in a varied population concluded that cinnamon had no measurable effect on HbA1C, blood glucose and lipid concentrations [7]. However, a more recent study utilizing poorly controlled type 2 diabetes patients (initial HbA1C>7.0), [6], indicated that supplementing the patient’s conventional diabetes treatment plan with cinnamon capsules significantly lowered HbA1C. Due in part to the impressive potential cost savings of using cinnamon, this result has led to a call for effectiveness research on cinnamon compared to other FDA-approve oral antidiabetic drugs, such as sitagliptin and saxagliptin [8].
Cinnamon extract has been shown to be efficacious for the treatment of diabetes in a number of diabetic animal models including streptozotocin-treated rats [9, 10], fructose-fed rats [11], and db/db mice [12]. The anti-diabetic activity of cinnamon extracts has been attributed to a variety of compounds including polyphenols [13–15], hydroxychalcone [16], and cinnamaldehyde [9,10].
One of the anti-diabetic characteristics of cinnamon extracts is stimulation of glucose uptake. It appears that cinnamon can both up regulate the expression of GLUT4 [9] and act as an insulin mimetic by stimulating the translocation of GLUT4 in a PI3K dependent manner (inhibited by wortmannin) [16, 17]. Cinnamon extract has also been shown to increase the expression of GLUT1 in macrophages [18]. However, little is know about the effects of cinnamon extract on non-insulin dependent glucose transport; that is, its acute effects on the transport activity of GLUT1.
GLUT1 is ubiquitously expressed in mammalian tissues and is traditionally thought to be responsible for only basal glucose uptake. However, studies suggest that GLUT1 can also be acutely activated by cell stressors such as azide [19, 20], osmotic stress [21, 22], methylene blue [23], and glucose deprivation [24, 25]. In addition, it has been recently shown that C-peptide activates GLUT1 transport activity in erthryocytes, suggesting that insulin, in addition to activating GLUT4, may indirectly activate GLUT1 by the co-release of C-peptide[26]. However, this effect has not yet been confirmed in other cell types.
There is experimental evidence that cysteine residues are important in the regulation of GLUT1 activity. Phenylarsine oxide, a reagent that reacts with vicinal thiols, has been shown to activate glucose uptake, but inhibit the activation of glucose uptake by cell stressors in L929 fibroblast cells [27, 28]. This dual action of phenylarsine oxide had previously been observed in striated muscle [28]. In addition, the activation of GLUT1 in erythrocytes has been shown to be dependent on internal disulfide bond formation within GLUT1 [29].
A major component of cinnamon extract is cinnamaldehyde, which has an α,β-unsaturated aldehyde structural motif that is an active Michael acceptor of thiols. As such, it has been shown that cinnamaldehyde will form covalent adducts to cysteine residues of some proteins [30, 31]. Since thiols appear to be important in the regulation of GLUT1 transport activity, we were interested to determine, first, if cinnamaldehyde affects GLUT1 transport activity by reacting with cysteine residues, and second, if this effect on GLUT1 could contribute to the anti-diabetic effects previously attributed to cinnamaldehyde [9, 10]. These studies were conducted using L929 fibroblast cells, a cell line that expresses only GLUT1 [32].
2. Materials and Methods
2.1 Chemicals
Cinnamaldehyde (CA) and its analogs, hydrocinnamaldehyde (HCA), cinnamyl alcohol, 3-phenyl-1-propanol, crotonaldehyde, benzaldehyde, propionaldehyde, as well as β-mercaptoethanol (BME), cysteine, serine, 2-deoxy-D-glucose-[1,2-3H] (2DG) and D-mannitol-1-14C were purchased from the Sigma-Aldrich Chemical Company (St. Louis, MO, USA).
2.2 Cell culture
L929 mouse fibroblast cells were obtained from the American Type Culture Collection. To initiate each experiment, approximately 1.0 × 10⁵ L929 fibroblast cells were plated into each well of a 24-well culture-treated plate in 1.0 mL of low glucose (5.5 mM) DMEM (Dulbecco’s Modified Eagle Medium) supplemented with 10% fetal bovine serum and 1% penicillin/streptomycin. The cells were grown overnight at 37 °C in an incubator supplied with humidified room air with 5% CO2.
2.3 General experimental design
Cells grown overnight in 24-well plates were rinsed with 0.2 mL of treatment media and then incubated in 0.8 mL of fresh treatment media consisting of either low-glucose DMEM (0% FBS) (basal), or glucose free DMEM (0% FBS) (activation by glucose deprivation) plus 0.0–5.0 mM CA or CA analog as indicated in the figure and table legends. The cells were maintained in this treatment media at 37 °C minutes for 30 minutes. Following the incubation period media were removed and glucose uptake was measured during a 10-minute glucose uptake phase as described below.
In experiments designed to measure recovery from the effects of CA or HCA, the treatment phase was followed by a recovery period in which cells were washed and returned to low-glucose media (0.8 mL) for 30-minutes. The media was then replaced with no-glucose DMEM (0.8 mL) to activate glucose uptake. Glucose uptake was measured as described below.
To measure the effects of thiols on the activity of CA or HCA, stock solutions of CA or HCA plus either BME, cysteine, or serine at 2-fold excess were generated either one hour or 24 hours (serine and cysteine) prior to the experiment. Final concentrations in the media were 2.0 mM CA or HCA plus 4.0 mM of the thiol reagent.
2.4 Glucose uptake assay
Glucose uptake was measured using the radiolabeled glucose analog 2-deoxyglucose (2DG) as previously described [23]. Briefly, the media was replaced with 0.3 mL of glucose-free HEPES buffer (140 mM NaCl, 5 mM KCl, 20 mM HEPES/Na pH=7.4, 2.5 mM MgSO4, 1 mM CaCl2, 2 mM NaPyruvate, 1 mM mannitol) supplemented with 1.0 mM (0.3 µCi/mL) 2-DG (1, 2-3H) and 1.0 mM (0.02 µCi/mL) mannitol (1-14C). After a 10-minute incubation, cells were washed twice with cold glucose-free HEPES. The cells were lysed in 0.5 mL lysis buffer (10 mM Tris pH=7.4, 150 mM NaCl, 5 mM EDTA, 1.0% triton X-100, 0.4% SDS) and the 3H-2 DG uptake with 14C-mannitol as the extracellular marker was measured using scintillation spectrometry. Uptake of 14C-mannitol only occurs if the cell membrane is compromised. Therefore, the use of a double-labeled uptake solution allows us to both measure surface binding as well as monitor potential toxic effects of the experimental treatments.
2.5 Statistical analysis
Experimental conditions were repeated in triplicate or quadruplicate and glucose uptake was measured and reported as nmoles/10 minutes/well ± standard error. Statistical significance was determined by either ANOVA followed by a post-hoc Dunnett test (dose dependent effects) or a two-tailed t-test. Statistical significance is reported at P<0.01 or P<0.05. Experiments were repeated several times and results from representative experiments are reported.
3. Results
3.1 Dose response effects of CA on basal and activated glucose uptake activity
The direct effects of cinnamaldehyde on the transport activity of the ubiquitously expressed glucose transporter, GLUT1, are unknown. There is evidence that the activity of this transporter is dependent on vicinal thiols [27–29]. Therefore, we were interested in measuring the effects of cinnamaldehyde, a compound expected to react with thiols, on the glucose transport activity of GLUT1. To investigate the effects of cinnamaldehyde on basal glucose uptake by GLUT1, L929 fibroblast cells were exposed to DMEM media containing 5.5 mM glucose and increasing concentrations of cinnamaldehyde for 30 minutes. The results, shown in Figure 1, show a dose dependent stimulation of glucose uptake that reached a maximum 3.5 fold stimulation at 2.0 mM CA (from 0.95±0.05 to 3.34±0.16 nmol/10 min/well).
Figure 1.

Effects of cinnamaldehyde on glucose uptake under basal and activated conditions. L929 fibroblast cells were incubated for 30 minutes in either low glucose media (basal), or glucose free media (activated), with cinnamaldehyde as indicated. Ten-minute glucose uptakes were then measured as described in Materials and Methods. Glucose uptakes are reported as means ± S.E. *Significantly different than its respective control (no added cinnamaldehye) at P< 0.01.
In contrast, when glucose uptake is activated in these cells by glucose deprivation, CA has an inhibitory effect on glucose uptake (see Figure 1). Exposure of L929 cells to DMEM media lacking glucose for 30 minutes activates glucose uptake 6.8 fold (0.95±0.05 to 6.46±0.56 nmol/10 min/well), as had been previously documented [24]. However, when CA is included in the 30-minute glucose deprivation treatment, there is a dose dependent inhibition of the activation of glucose uptake. 2.0 mM CA, a concentration that is maximally activating under basal conditions, now completely blocks the activation of glucose uptake (reduced from 6.46 ± 0.56 to 0.86 ± 0.22 nmol/10 min/well compared to a basal uptake of 0.95 ± 0.05). Exposure of cells to no glucose media containing 5.0 mM CA reduces glucose uptake to 0.06 ± 0.0005 nmol/10 min/well, well below basal glucose uptake. These data reveal a dual action of CA that is similar to the properties of the thiol binding compound, phenylarsine oxide [27, 28].
3.2 Effects of CA analogs on glucose uptake
To investigate which structural features of CA are responsible for the dual effects of CA on glucose uptake, we measured the effects of CA analogs on glucose uptake under both basal and activating conditions. L929 cells were treated for 30 minutes with a 2.0 mM concentration of cinnamaldehyde (CA), hydrocinnamaldehyde (HCA), cinnamyl alcohol, 3-phenyl-1-propanol, crotonaldehyde, benzaldehyde, or propionaldehyde, in DMEM with 5.5 mM glucose (basal) or in DMEM with 0.0 mM glucose (activating). The results are shown in Table 1. For ease of comparison, the data are normalized to the uptakes measured in cells that were not exposed to CA or an analog. The data reveal that crotonaldehyde, which maintains the α,β unsaturated aldehyde structural motif of CA, best mimics the behavior of CA; both its stimulatory and inhibitory effects are moderately muted compared to CA. Hydrocinnamaldehyde, which lacks the α,β double bond, also mimics the effects of CA, but its effects are even more muted than those of crotonaldehyde. The change of the aldehyde functional group to an alcohol in cinnamyl alcohol and 3-phenyl-1-propanol maintains a small activating effect under basal conditions, but displays no ability to inhibit the activation of glucose uptake by glucose deprivation, suggesting that the aldehyde functional group is essential to the inhibitory action of CA.
Table 1.
Effects of Cinnamaldehyde and its analogs on glucose uptake
| Compound | Structure | 2DG Uptake (nmol/10min/well) | |
|---|---|---|---|
| Basal | Activated | ||
| Control | No substance added | 1.00 ± 0.07 | 6.36 ± 0.35 |
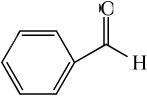
| cinnamaldehyde |
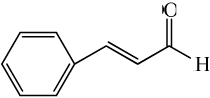
|
3.52 ± 0.17* | 0.86 ± 0.23* |
| crotonaldehyde |
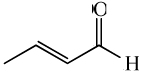
|
2.19 ± 0.15* | 2.56 ± 0.24* |
| hydrocinnamaldehye |
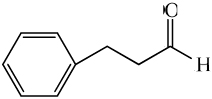
|
1.83 ± 0.31* | 4.06 ± 0.35* |
| Cinnamyl alcohol |
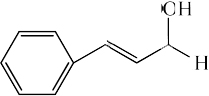
|
1.60 ± 0.07* | 7.97 ± 0.33 |
| 3-phenyl-1-propanol |
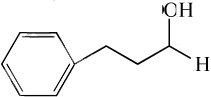
|
1.31 ± 0.08* | 7.74 ± 0.31 |
| benzaldehyde |
|
1.43 ± 0.09* | 6.24 ± 0.29 |
| propionaldehyde |

|
0.44 ± 0.14 | 5.79 ± 0.44 |
Cells were incubated in either low glucose DMEM (basal), or no glucose DMEM (activated), with the indicated chemical at 2.0 mM for 30 minutes. Glucose uptake was then measured as described in Materials and Methods. Uptakes were normalized to control values and are reported as means ±S.E.
Significantly different than its respective control (no added substance) at P < 0.01.
However, it appears that the structural location of the aldehyde is also important to this inhibitory effect, as both benzaldehyde and propionaldehyde lack the ability to inhibit activation of glucose uptake. Taken together, these results indicate that the key structural feature for both the activation of glucose uptake and the inhibition of activation by glucose deprivation is the α,β-unsaturated aldehyde. In addition, it appears that the phenyl ring contributes to the activating property of CA.
3.3 Pretreatment of cells with CA inhibits subsequent activation of glucose uptake
Aldehydes readily form addition products with nucleophiles such as amines and α,β, unsaturated aldehydes readily for addition products with nucleophilic thiols. This suggests the possibility that CA forms a covalent adduct that leads to the inhibition of the activation of glucose uptake by glucose deprivation. To test this hypothesis L929 cells were pre-treated with 2.0 mM CA or HCA for 30 minutes in no glucose media. The media was then removed and the cells were allowed to recover for 30 minutes in low glucose media. This was followed by a 30-minute exposure to no glucose media to activate glucose uptake. As shown in Figure 2, pretreatment of cells with CA completely prevents subsequent activation of glucose uptake by glucose deprivation. Glucose uptake in cells pretreated with CA was 2.58±0.41 nmol/10 min/well compared to basal uptake of 2.18±0.14 nmol/10 min/well. Cells treated in the same manner, but without exposure to CA exhibit a robust activation of glucose uptake measured at 9.77±0.09 nmol/10 min/well. Pretreatment with HCA also significantly inhibits activation, although not as efficiently as CA (uptake measured at 4.90 ±0.36 nmol/10 min/well). These results indicate that the inhibitory effects of CA or HCA persist at least 30 minutes after their removal suggesting a covalent interaction of these agents with cellular components.
Figure 2.

Recovery from the effects of cinnamaldehyde. L929 fibroblast cells were incubated for 30 minutes in glucose free media plus 2.0 mM of either CA or HCA as indicated. Cells were then washed and returned to low glucose media without CA or HCA to recover for 30 minutes. Following this, cells were again exposed to glucose free media for 30 minutes, but without CA or HCA. In control cells, low glucose media was exchanged but maintained throughout the three incubation periods. Ten-minute glucose uptakes were then measured as described in Materials and Methods. Glucose uptakes are reported as means ± S.E. aSignificantly different than NG control and bsignificantly different than LG control at P< 0.01.
In order to determine if the activating properties of CA are also maintained after removal of CA, cells were pretreated with 2.0 mM CA under basal conditions (low glucose media) followed by a 30-minute recovery in low glucose media with no CA. Cells were then incubated for another 30 minutes in either low glucose media so see if the activating effects of CA are maintained or in no glucose media to determine if pretreatment with CA in low glucose media also inhibited subsequent activation by glucose deprivation (as previously seen when the pretreatment occurred in no glucose media (see Figure 2)). We also repeated the pretreatment of cells with 2.0 mM CA in no glucose media in order to directly compare the effects of pretreatment with CA in activating conditions (no glucose media) to pretreatment with CA in basal conditions (low glucose media). The results are shown in Table 2. It is clear that the activating effects of CA are not maintained. Cells re-exposed to low glucose after pretreatment with CA had reduced, not elevated uptakes (1.02 ± 0.18 compared to 1.49 ± 0.09 nmol/10 min/well). It also appears that pretreatment with CA in no glucose conditions more effectively blocks subsequent activation than pretreatment of CA in low glucose media (1.14 ± 0.15 compared to 1.88 ± 0.23 nmol/10 min/well). These data suggest that the activating effects of CA are not the result of a covalent addition of CA to a target protein. In addition, it appears that glucose deprivation more effectively exposes CA reaction sites on protein/s responsible for inhibition of glucose uptake. Because of the strong, more permanent, effect of CA on inhibition of the activation of glucose uptake, the remainder of this study will focus on that phenomenon.
Table 2.
Effects of pretreatment with cinnamaldehyde
| Media Conditions in each 30 min phase | 2DG Uptake nmol/10 min/well) |
||
|---|---|---|---|
| Treatment | Recovery | Activation | |
| LG | LG | LG | 1.49 ± 0.09 |
| NG | LG | NG | 5.65 ± 0.52 |
| LG + 2 mM CA | LG | LG | 1.02 ± 0.18 |
| LG + 2 mM CA | LG | NG | 1.88 ± 0.23* |
| NG + 2 mM CA | LG | NG | 1.14 ± 0.15* |
Cells were incubated in a 30-minute treatment phase in low glucose DMEM (LG) (5.5 mM glucose), or no glucose DMEM (NG) (0.0 mM glucose), plus or minus 2.0 mM CA. Cells were allowed to recover for 30 minutes in low glucose media and then incubated for 30 minutes with low glucose media (basal conditions) or no glucose media (activating conditions). Glucose uptake was then measured as described in Materials and Methods. Uptakes are reported as means ± S.E.
Significantly different from each other at P < 0.05.
3.4 Compounds containing thiols block inhibitory activity of CA
Given the propensity of thiols to undergo a Michael addition with the α,β-unsaturated aldehyde structural component of CA, we were interested to determine if we could block the effects of CA by pretreatment of CA with thiol containing compounds. Glucose uptake was activated by glucose deprivation in the presence of 2.0 mM CA or HCA alone or each premixed with 4.0 mM BME (to insure stoichiometric excess). The results are shown in Figure 3. As previously reported (see Table 1), CA significantly inhibits activation by glucose deprivation (uptake reduced from 14.26 ± 0.39 to 3.05 ± 0.46 nmol/10 min/well) while HCA had a more modest inhibitory effect (reduced to 11.35 ± 0.05 nmol/10 min/well). In the control experiment, pretreatment with BME alone had no effect on glucose uptake (14.41 ± 0.47 nmol/10 min/well). However, when BME was premixed with CA, it effectively reduced the inhibitory effect of CA (uptake increased from 3.05 ± 0.46 to 11.18 ± 0.41 nmol/10 min/well), but BME had no significant effect on the inhibitory effect of HCA (11.35 ± 0.05 and 10.51 ± 0.19 nmol/10 min/well respectively). These results are consistent with BME blocking the inhibitory effects of CA by adding 1–4 to the α,β unsaturated aldehyde of CA; BME has little effect on the inhibitory activity of HCA, which lacks the α,β double bond and thus does not react with the thiol.
Figure 3.

Effects of β-mercaptoethanol on the activity of cinnamaldehyde and hydrocinnamaldehyde. L929 fibroblast cells were incubated for 30 minutes in glucose free media (NG) plus BME (4.0 mM), cinnamaldehyde (2.0 mM), or hydrocinnamaldehyde (2.0 mM) alone or as a premixed combination as indicated in the figure. Ten-minute glucose uptakes were then measured as described in Materials and Methods. Glucose uptakes are reported as means ± S.E. *Significantly different than its respective control (no added BME) at P< 0.01.
In a confirming experiment, we mixed CA with either cysteine or serine and incubated the compounds overnight. Cysteine contains a thiol that would be expected to add 1–4 and an amino group that could add to the aldehyde, while serine contains lacks the thiol and would be expected to add preferentially to the aldehyde. L929 cells were activated by glucose deprivation in the presence of CA or CA pre-reacted with either cysteine or serine. The results are shown on Figure 4. Again, the data reveal a significant inhibition by CA of the activation of glucose uptake by glucose deprivation (reduces uptake from 10.12 ± 0.37 to 0.52 ± 0.09 nmol/10 min/well). The inhibitory effect of CA was much more efficiently blocked by pretreatment with cysteine than by serine (7.18 ± 0.22 compared to 2.57 ± 0.23 nmol/10 min/well). In control experiments, cysteine or serine alone had no effect on glucose uptake (data not shown). This suggests that the effects of CA depend significantly on its ability to react with a thiol (cysteine) residue on its target protein/s.
Figure 4.

Effects of cysteine and serine on the activity of cinnamaldehyde. L929 fibroblast cells were incubated for 30 minutes in glucose free media plus either cinnamaldehyde (2.0 mM), or cinnamaldehyde premixed with either cysteine or serine at 4.0 mM. Ten-minute glucose uptakes were then measured as described in Materials and Methods. Glucose uptakes are reported as means ± S.E. *Significantly different than both CA treated cells and each other at P< 0.01.
4. Discussion
There is accumulating evidence that cinnamon or cinnamon extracts have some efficacy in the treatment of type 2 diabetes. A single treatment of cinnamon has been shown to delay gastric empting, to decrease both postprandial blood glucose and subsequent resting plasma glucose, and to increase insulin sensitivity [33, 34]. Although long-term controlled studies have shown mixed results [1–7], the most recent study has shown efficacy in patients with poorly controlled diabetes [7]. This has led to a call for more comparative human studies [8]. The efficacy of cinnamon in animal and cell based studies have been more definitive and have clearly documented an increase in glucose uptake and utilization in insulin sensitive tissues [9–17]. However, little is known regarding the effects of cinnamon affects on basal or noninsulin sensitive glucose uptake. This study reports the unique finding that CA, a major ingredient in cinnamon, stimulates the glucose uptake activity in L929 fibroblast cells in a dose dependent manner (Figure 1). Maximum stimulation was achieved by 2.0 mM concentration. It has been previously demonstrated that this cell line expresses only GLUT1 (32) and glucose uptake is completely blocked by cytochalasin B (23). Thus, the activation of glucose uptake by CA in L929 fibroblast cells can only be attributed to changes in GLUT1 activity. It is not likely that enhanced transport can be attributed to increased GLUT1 concentrations. Previous studies with multiple cell lines and stimulants suggest that chronic treatments of at least 4–6 hours are needed to increase GLUT1 expression and any acute activation (< 2 hours) of GLUT1 occurs without a change in the concentration of GLUT1 (35–40).
While this activation of GLUT1 by CA is interesting and unique, it is not likely that CA is a major contributor to the anti-diabetic properties of cinnamon. The concentration required for activation (1.0 mM) is higher than would be expected from ingestion of cinnamon, and the bioavailability of CA from the ingestion is extremely low. A study in rats revealed that nearly all of the CA, from ingesting cinnamon or CA itself, is metabolized to cinnamic acid before being absorbed into the blood steam (41).
Interestingly, while CA activated basal level glucose uptake, it also had a dose dependent inhibitory effect on the activation of glucose uptake by glucose deprivation (Figure 1). This apparently opposing effect of CA on glucose uptake was also seen in 3T3-L1 adipocytes where cinnamon water extract was shown to have stimulatory effects on glucose uptake at 0.2 mg/mL and waned at higher concentrations. In those cells the extract also inhibited insulin stimulated glucose uptake [17]. The authors suggested that the opposing effects were due to different components in the extract. Indeed, the antidiabetic effects of cinnamon have been attributed to multiple components, including polyphenols [13–15], hydroxychalcone [16], and cinnamaldehyde [9,10]. However, in this study the dual action can only be attributed to one component, CA.
The CA results reported in this study are very similar to data documenting the dual action of another thiol reactive agent, PAO [27, 28]. The mechanism for the dual action of CA is not clear and is likely to be complex involving multiple proteins. Based on the activity of CA analogs (Table 1), it appears the activation involves both a reaction of a thiol with the α,β aldehyde functional group of CA as well as a simple reversible binding associated with its aromatic functionality. On the other hand, the inhibitory activity of CA is likely caused by the reaction of CA with a cysteine residue/s in a target protein/s directly involve in glucose uptake or the activation of uptake; possibly GLUT1 itself. The evidence for this threefold: 1) the activity of CA is best mimicked by crotonaldehyde, which maintains the α,β-unsaturated aldehyde structural motif known to react with thiols [30, 31] (see Table 1).2) Pretreatment with CA prevents subsequent activation of glucose uptake suggesting formation of a covalent bond (see Figure 2). 3) Pretreatment of CA with either the thiol containing compound BME or cysteine blocks the inhibitory effects of CA (see Figures 3 and 4). The importance of cysteine residues to the activity of GLUT1 has been previously noted in erythrocytes where activation of GLUT1 requires an internal disulfide bond formation that triggers a GLUT1 oligomerization and activation [29]. If GLUT1 is activated in L929 cells by a similar disulfide bond formation, it might be expected that a covalent addition to cysteine would interfere with this process.
5. Conclusions
This study shows for the first time that CA, either directly or indirectly, activates the transport activity of the ubiquitously expressed transporter, GLUT1, but inhibits the activation of the transporter by glucose deprivation. Thus the anti-diabetic properties of cinnamon are not likely due to the effects of CA on GLUT 1. However, more importantly, this study provides additional evidence of the importance of cysteine residues to the regulation of the activity of GLUT1.
Acknowledgements
This research was supported by a Merck Institute of Science Education Grant, a Beckman Scholars Program Award and a NIH R15 (DK08193-1A1). Special thanks to Darla McCarthy for her critique of this manuscript.
Footnotes
Publisher's Disclaimer: This is a PDF file of an unedited manuscript that has been accepted for publication. As a service to our customers we are providing this early version of the manuscript. The manuscript will undergo copyediting, typesetting, and review of the resulting proof before it is published in its final citable form. Please note that during the production process errors may be discovered which could affect the content, and all legal disclaimers that apply to the journal pertain.
References
- 1.Khan A, Khattak KN, Safdar M, Anderson RA, Ali Khan MM. Cinnamon improves glucose and lipids of people with type 2 diabetes. Diabetes Care. 2003;26:3215–3218. doi: 10.2337/diacare.26.12.3215. [DOI] [PubMed] [Google Scholar]
- 2.Vanschoonbeek K, Thomassen BL, Senden JM, Wodzig WK, van Loon LJ. Cinnamon supplementation does not improve glycemic control in postmenopausal type 2 diabetes patients. J. Nutr. 2006;136:977–980. doi: 10.1093/jn/136.4.977. [DOI] [PubMed] [Google Scholar]
- 3.Mang B, Wolters M, Schmitt B, Kelb K, Lichtinghagen R, Stichtenoth DO, Hahn A. Effects of a cinnamon extract on plasma glucose, HbA1c, and serum lipids in diabetes mellitus type 2. Eur. J. Clin. Invest. 2006;36:340–344. doi: 10.1111/j.1365-2362.2006.01629.x. [DOI] [PubMed] [Google Scholar]
- 4.Altschuler JA, Casella SJ, MacKenzie TA, Curtis KM. The effect of cinnamon on A1C among adolescents with type 1 diabetes. Diabetes Care. 2007;30:813–816. doi: 10.2337/dc06-1871. [DOI] [PubMed] [Google Scholar]
- 5.Blevins SM, Leyva MJ, Brown J, Wright J, Scofield RH, Aston CE. Effect of cinnamon on glucose and lipid levels in non insulin-dependent type 2 diabetes. Diabetes Care. 2007;30:2236–2237. doi: 10.2337/dc07-0098. [DOI] [PubMed] [Google Scholar]
- 6.Crawford P. Effectiveness of cinnamon for lowering hemoglobin A1C in patients with type 2 diabetes: a randomized, controlled trial. JABFM. 2009;22:507–512. doi: 10.3122/jabfm.2009.05.080093. [DOI] [PubMed] [Google Scholar]
- 7.Baker WL, Gutierrez-Williams G, White CM, Kluger J, Coleman CI. Effect of cinnamon on glucose control and lipid parameters. Diabetes Care. 2008;31:41–43. doi: 10.2337/dc07-1711. [DOI] [PubMed] [Google Scholar]
- 8.Fairman KA, Curtiss FR. Call for comparative effectiveness research: lowering A1C with sitagliptin, saxagliptin, or cinnamon. J. Man. Care Pham. 2009;15:696–700. doi: 10.18553/jmcp.2009.15.8.696. [DOI] [PMC free article] [PubMed] [Google Scholar]
- 9.Zhang W, Xu Y, Guo F, Meng Y, Li M. Anti-diabetic effects of cinnamaldehyde and berberine and their impacts on retinol-binding protein 4 expression in rats with type 2 diabetes mellitus. Chin. Med. J. 2008;121:2124–2128. [PubMed] [Google Scholar]
- 10.Subash BP, Prabuseenivasan S, Ignacimuthu S. Cinnamaldehye—a potential antidiabetic agent. Phytomedicine. 2006;14:15–22. doi: 10.1016/j.phymed.2006.11.005. [DOI] [PubMed] [Google Scholar]
- 11.Kannappan S, Jayaraman T, Rajasekar P, Ravichandran MK, Anuradha CV. Cinnamon bark extract improves glucose metabolism and lipid profile in the fructose-fed rat. Singapore Med. J. 2006;47:858–863. [PubMed] [Google Scholar]
- 12.Kim SH, Hyun SH, Choung SY. Anti-diabetic effect of cinnamon extract on blood glucose in db/db mice. J. Ethnopharmacol. 2006;104:119–123. doi: 10.1016/j.jep.2005.08.059. [DOI] [PubMed] [Google Scholar]
- 13.Anderson RA, Broadhurst CL, Poansky MM, Schmidt WF, Khan A, Flanagan VP, Schoene NW, Graves DJ. Isolation and characterization of polyphenol type-A polymers from cinnamon with insulin-like biological activity. J. Agric. Food Chem. 2004;14:65–70. doi: 10.1021/jf034916b. [DOI] [PubMed] [Google Scholar]
- 14.Cao H, Polansky MM, Anderson RA. Cinnamon extract and polyphenols affect the expression of tristetraprolin, insulin receptor, and glucose transporter 4 in mouse 3T3-L1 adipocytes. Arch Biochem Biophys. 2007;459:214–222. doi: 10.1016/j.abb.2006.12.034. [DOI] [PubMed] [Google Scholar]
- 15.Peng X, Cheng K, Ma J, Chen B, Ho CT, Chen F, Wang M. Cinnamon bark proanthocyanidins as reactive carbonyl scavengers to prevent the formation of advanced glycation endproducts. J Agric Food Chem. 2008;56:1907–1911. doi: 10.1021/jf073065v. [DOI] [PubMed] [Google Scholar]
- 16.Jarvill-Taylor KJ, Anderson RA, Graves DJ. A hydoxychalcone derived from cinnamon functions as a mimetic for insulin in 3T3-L1 adipocytes. J. Am. Coll. Nutr. 2001;20:327–336. doi: 10.1080/07315724.2001.10719053. [DOI] [PubMed] [Google Scholar]
- 17.Roffey B, Atwal A, Kubow S. Cinnamon water extracts increase glucose uptake but inhibit adiponectin secretion in 3T3-L1 adipose cells. Mol. Nutr. Food Res. 2006;50:739–745. doi: 10.1002/mnfr.200500253. [DOI] [PubMed] [Google Scholar]
- 18.Cao H, Urban JF, Anderson RA. Cinnamon polyphenol extract affects immune responses by regulating anti- and proinflammatory and glucose transporter gene expression in mouse macrophages. J. Nutr. 2008;138:833–840. doi: 10.1093/jn/138.5.833. [DOI] [PubMed] [Google Scholar]
- 19.Shetty M, Loeb JN, Vikstrom K, Ismail-Beigi F. Rapid activation of GLUT-1 glucose transporter following inhibition of oxidative phosphorylation in clone 9 cells. J. Biol. Chem. 1993;268:17225–17232. [PubMed] [Google Scholar]
- 20.Rubin D, Ismail-Beigi F. Distribution of Glut1 in detergent-resistant membranes (DRMs) and non-DRM domains: effect of treatment with azide. Am. J. Physiol. Cell Physiol. 2003;285:C377–C383. doi: 10.1152/ajpcell.00060.2003. [DOI] [PubMed] [Google Scholar]
- 21.Barnes K, Ingram JC, Porras OH, Barros LF, Hudson ER, Fryer LG, Foufelle F, Carling D, Hardie DG, Baldwin SA. Activation of GLUT1 by metabolic and osmotic stress: potential involvement of AMP-activated protein kinase (AMPK) J. Cell Sci. 2002;115:2433–2442. doi: 10.1242/jcs.115.11.2433. [DOI] [PubMed] [Google Scholar]
- 22.Barros LF, Barnes K, Ingram JC, Castro J, Porras OH, Baldwin SA. Hyperosmotic shock induces both activation and translocation of glucose transporters in mammalian cells. Eur. J. of Physiol. 2001;442:614–621. doi: 10.1007/s004240100577. [DOI] [PubMed] [Google Scholar]
- 23.Louters LL, Dyste SG, Frieswyk D, TenHarmsel A, Vander Kooy TO, Walters L, Whalen T. Methylene blue stimulates 2-deoxyglucose uptake in L929 fibroblast cells. Life Sci. 2006;785:86–591. doi: 10.1016/j.lfs.2005.05.082. [DOI] [PubMed] [Google Scholar]
- 24.Roelofs B, Tidball A, Lindborg AE, Ten Harmsel A, Vander Kooy TO, Louters LL. Acute activation of glucose uptake by glucose deprivation in L929 fibroblast cells. Biochimie. 2006;88:1941–1946. doi: 10.1016/j.biochi.2006.08.004. [DOI] [PubMed] [Google Scholar]
- 25.Kumar A, Xiao YP, Laipis PJ, Fletcher BS, Frost SC. Glucose deprivation enhances targeting of GLUT1 to lipid rafts in 3T3-L1 adipocytes. Am. J. Physiol. Endocrinol. Metab. 2003;286:E568–E576. doi: 10.1152/ajpendo.00372.2003. [DOI] [PubMed] [Google Scholar]
- 26.Meyer A, Froelich JM, Reid GE, Karunarathne WKA, Spence DM. Metal activated C-peptide facilitates glucose clearance and the release of nitric oxide stimulus via the GLUT1 transporter. Diabetologia. 2008;51:175–182. doi: 10.1007/s00125-007-0853-3. [DOI] [PMC free article] [PubMed] [Google Scholar]
- 27.Scott J, Opejin A, Tidball A, Stehouwer N, Reckman J, Louters LL. Dual action of phenylarsine oxide on the glucose transport activity of GLUT1. Chemico-Biol. Interact. 2009;182:199–203. doi: 10.1016/j.cbi.2009.08.008. [DOI] [PubMed] [Google Scholar]
- 28.Henriksen EJ, Holloszy JO. Effect of phenylarsine oxide on stimulation of glusoce transport in rat skeletal muscle. Am. J. Physiol. Cell Physiol. 1990;258:C648–C653. doi: 10.1152/ajpcell.1990.258.4.C648. [DOI] [PubMed] [Google Scholar]
- 29.Zottola RJ, Cloherty EK, Coderre PE, Hansen A, Herbert DN, Carruthers A. Glucose transporter function is controlled by transporter oligomeric structure. A single, intramolecular disulfide promotes GLUT1 tetramerization. Biochemistry. 1995;34:9734–9747. doi: 10.1021/bi00030a011. [DOI] [PubMed] [Google Scholar]
- 30.Macpherson LJ, Dubin AE, Evans MJ, Marr F, Schultz PG, Cravatt BF, Papaputian A. Noxous compounds activate TRPA1 channels through covalent modifications of cysteines. Nature. 2007;445:541–545. doi: 10.1038/nature05544. [DOI] [PubMed] [Google Scholar]
- 31.Weibel H, Hansen J. Interaction of cinnamaldehyde (a sensitizer in fragrance) with protein. Contact Dermatitis. 1989;20:161–166. doi: 10.1111/j.1600-0536.1989.tb04650.x. [DOI] [PubMed] [Google Scholar]
- 32.Liong E, Kong SK, Au KK, Li JY, Xu GY, Lee YL, Kwok TT, Choy YM, Lee CY, Fung KP. Inhibition of glucose uptake and suppression of glucose transporter 1 mRNA expression in L929 cells by tumor necrosis factor-alpha. Life Sci. 1999;65:PL215–PL220. doi: 10.1016/s0024-3205(99)00408-7. [DOI] [PubMed] [Google Scholar]
- 33.Hlebowicz J, Darwiche G, Björgell O, Almér LO. Effect of cinnamon on postprandial blood glucose, gastric emptying and satiety. Am. J. Clin. Nutr. 2007;85:1552–1556. doi: 10.1093/ajcn/85.6.1552. [DOI] [PubMed] [Google Scholar]
- 34.Solomon TP, Blannin AK. Effects of short-term cinnamon ingestion on in vivo glucose tolerance. Diabetes Obes. Metab. 2007;9:895–901. doi: 10.1111/j.1463-1326.2006.00694.x. [DOI] [PubMed] [Google Scholar]
- 35.Wetheimer E, Sasson S, Cerasi E, Ben-Neriah Y. The ubiquitous glucose transporter GLUT-1 belongs to the glucose-regulated protein family of stress-inducible proteins. Proc. Natl. Acad. Sci. USA. 1991;88:2525–2529. doi: 10.1073/pnas.88.6.2525. [DOI] [PMC free article] [PubMed] [Google Scholar]
- 36.Klitzman HH, Jr, McMahon RJ, Williams MG, Frost SC. Effect of glucose deprivation of GLUT1 expression in 3T3-L1 adipocytes. J. Biol. Chem. 1993;268:1320–1325. [PubMed] [Google Scholar]
- 37.Behrooz A, Ismail-Beigi F. Dual control of glut1 glucose transporter gene expression by hypoxia and by inhibition of oxidative phosphorylation. J. Biol. Chem. 1997;272:5555–5562. doi: 10.1074/jbc.272.9.5555. [DOI] [PubMed] [Google Scholar]
- 38.Walker PS, Ramala T, Sarabia V, Koivisto U, Bilan PJ, Pessin JE, Klip A. Glucose transport activity in L6 muscle cells is regulated by the coordinate control of subcellular glucose transporter distribution, biosynthesis, and mRNA transcription. J. Biol. Chem. 1990;265:1516–1523. [PubMed] [Google Scholar]
- 39.Kim SH, Shin EJ, Kim ED, Bayaraa T, Frost SC, Hyun CK. Berberine Activates GLUT1-mediated glucose uptake in 3T3-L1 adipocytes. Biol. Pharm. Bull. 2007;30:2120–2125. doi: 10.1248/bpb.30.2120. [DOI] [PubMed] [Google Scholar]
- 40.Shetty M, Loeb JN, Ismail-Beigi F. Enhancement of glucose transport in response to inhibition of oxidative metabolism: pre- and posttranslational mechanisms. Am. J. Physiol. 1992;262:C527–C532. doi: 10.1152/ajpcell.1992.262.2.C527. [DOI] [PubMed] [Google Scholar]
- 41.Chen Y, Ma Y, Ma W. Pharmachokinetics and bioavailability of cinnamic acid after oral administration of Ramulus Cinnamomi in rats. Eur. J. Drug Metab. Pharmocokint. 2009:51–56. doi: 10.1007/BF03191384. [DOI] [PubMed] [Google Scholar]