

Abstract
Hydrogel biomarker capturing microparticles were evaluated as a biomaterial to amplify the sensitivity of urine testing for infectious disease proteins. Lyme disease is a bacterial infection transmitted by ticks. Early diagnosis and prompt treatment of Lyme disease reduces complications including arthritis and cardiac involvement. While a urine test is highly desirable for Lyme disease screening, this has been difficult to accomplish because the antigen is present at extremely low concentrations, below the detection limit of clinical immunoassays. N-isopropylacrylamide (NIPAm) – acrylic acid (AAc) microparticles were covalently functionalized with amine containing dyes via amidation of carboxylic groups present in the microparticles. The dyes act as affinity baits towards protein analytes in solution. NIPAm/AAc microparticles functionalized with acid black 48 (AB48) mixed with human urine, achieved close to one hundred percent capture and 100 percent extraction yield of the target antigen. In urine, microparticles sequestered and concentrated Lyme disease antigens 100 fold, compared to the absence of microparticles, achieving an immunoassay detection sensitivity of 700 pg/mL in 10mL urine. Antigen present in a single infected tick could be readily detected following microparticle sequestration. Hydrogel microparticles functionalized with high affinity baits can dramatically increase the sensitivity of urinary antigen tests for infectious diseases such as Lyme disease. These findings justify controlled clinical studies evaluating the sensitivity and precision of Lyme antigen testing in urine.
1. Introduction
Lyme disease, a bacterial infection caused by the bacteria Borrelia burgdorferi and transmitted by Ixodes sp. ticks to humans, has become an increasingly common illness [1]. In its early stages, this disease is treatable by appropriate antibiotics, but if left untreated, Lyme disease can lead to serious complications including chronic joint inflammation[2], cognitive defects [3], heart irregularities [4], and memory loss [5].
Lyme disease is most often diagnosed after the infection is well established and the patient has raised an antibody titer against the bacteria B. burgdorferi [6]. Antibodies specific to B. burgdorferi proteins can take three to four weeks to develop [7]. Early stage Lyme disease, prior to the appearance of a serologic titer, is extremely difficult to diagnose due to the low sensitivity of current diagnostic tests for B. burgdorferi antigen [6].
Lyme disease tests fall into three categories: serum antibody tests, antigen tests, and PCR for the bacterial nucleic acid. Following sera-conversion in an infected individual, sera antibodies can be detected which recognize a variety of bacterial antigen proteins by Western blot with the following molecular weights (kDa): 18, 22–25, 28, 30, 39, 41, 45, 58, 66 and 93. According to the Centers for Disease Control and Prevention (CDC), a result is considered positive if the patient's sera antibodies react with five or more proteins. Unfortunately both ELISA and western blotting technologies lack adequate sensitivity. Serological testing alone has been found to only be 77% specific when coupled with symptomatic analysis [8]. Ticks found on a patient may be screened for the presence of B. burgdorferi by means of PCR assays for total tick B. burgdorferi genes (e.g., OspA and Ly1 Chromosomal gene). However the presence of a positive tick does not mean that the infection is established in the patient.
Ideally, the optimal Lyme disease screening test would utilize a non invasive body fluid such as urine or saliva, and be sensitive enough to reliably detect Stage 1 disease (prior to seroconversion). Immunoassays to detect the bacterial proteins in the patient's urine have been previously proposed [9] but have been judged unreliable due to inadequate sensitivity and specificity [10]. Polymerase chain reaction (PCR) amplification assays targeting shed microbial B. burgdorferi genes, such as Outer Surface Protein A (OspA) [11], have not proven suitable for direct urine testing. Thus, while it is imperative that Lyme disease be diagnosed before stage 2 of the infection, currently there exists no reliable and sensitive testing option [12].
Hydrogel-based particles have been widely applied in the biomedical field for imaging, bio-sensing, and drug delivery [13–16]. Recently, a novel application of hydrogel microparticles has been proposed to overcome the major roadblocks to discovery and measurement of blood borne biomarker in early detection of cancer [17–19]. Harvesting hydrogel microparticles perform three functions in one step: 1) molecular size sieving, 2) protein concentration, and 3) protection from degradation [17–19].
Hydrogel microparticles were created by polymerization of N-isopropylacrylamide (NIPAm) and co-monomers (acrylic acid, AAc, and allylamine, AA) with cross links of N,N'-methylenebisacrylamide (BIS) [17, 18, 20, 21]. Chemical baits, such as dye molecules (e.g. Acid Black 48, AB48), with high affinity to proteins were covalently incorporated in the microparticles. As shown in Figure 1a, the dye molecules exhibited a high affinity for the analyte such that the target molecules were completely sequestered from the solution and trapped in the microparticles. High molecular weight proteins were excluded from the interior of the microparticles, due to their size sieving properties (Supplementary Data). The low molecular weight target proteins (smaller than 40 kDa) that were sequestered by the microparticles were completely protected from degradation [17, 18, 20, 21].
Figure 1.

a. Affinity baits (such as Acid Black 48) covalently incorporated in the microparticles bind proteins with high affinity. Due to the molecular size sieving property of the microparticles, only low molecular weight proteins may enter the microparticles. b. The process by which proteins are concentrated. The proteins are mixed with the microparticles. Low molecular weight proteins enter the microparticles. The solution is separated by centrifugation. The microparticles containing low molecular weight proteins form a pellet at the bottom of the test tube. The supernatant, which contains high molecular weight proteins, is removed.
The microparticle analyte concentration effect is based on the volumetric ratio. The new limit of detection of an assay, following particle-based concentration, can be estimated by a simple mathematical equation, knowing the sensitivity of the assay, the initial volume of biological fluid, and the output volume of the elution:
where Lmin is the minimum detectable concentration of analyte in the biological fluid, L is the lowest limit of sensitivity of the assay, V is the starting volume of biological fluid tested, v is the output volume of the eluate, and C=V/v is the concentration factor given by the ratio between the initial volume of biological fluid and the volume of the eluate. Assuming that we mix the microparticles with 10 mL of biological fluid and the protein analytes captured in the microparticles can be eluted in the volume v of 50 μL, the concentration factor C is 200. If the sensitivity of the assay L is 50 pg/mL, Lmin, the minimum detectable concentration of analyte, is 0.25 pg/mL with 10 mL of biological fluid as a starting volume (Figure 2).
Figure 2.

Concentration effect of microparticle pre treatment. For an initial sample volume of 10 mL and a final collection volume of 50 μL the concentration factor is 200.
The present study evaluates the application of harvesting microparticles to increase the sensitivity of antibody based diagnostic tests directed towards bacterial proteins in urine. We screened a variety of dye-loaded microparticles and we optimized the capturing conditions for the sequestration and concentration of bacterial proteins by hydrogel microparticles introduced into urine. The concentrated B. burgdorferi proteins were assayed with a Western blot and detected with validated monoclonal antibodies directed against B. burgdorferi outer surface protein A (OspA), 31 kDa, and outer surface protein B (OspB), 34 kDa [22, 23]. We evaluated the sequestration efficiency, the extraction yield, and the diagnostic sensitivity for B. burgdorferi antigen detection in urine or directly from individual infected ticks.
2. Materials and Methods
2.1 Reagents
N-isopropylacrylamide (NIPAm), N,N'-methylenebisacrylamide (BIS), acrylic acid (AAc), allylamine (AA), ammonium persulfate (KPS), sodium dodecyl sulfate (SDS), acid blue 22, monobasic phosphate sodium (NaH2PO4), rhodamine 123, Tween 20, aprotinin, lysozyme, carbonic anhydrase, ovalbumin, pararosaniline base, ammonium hydroxide, and sodium hydroxide were purchased from Sigma-Aldrich. Cibacron blue F3G-A dye (CB) was purchased from Polysciences, Inc. Glacial acetic acid, disperse orange 3, acetonitrile, hydrochloric acid, and coomassie brilliant R-250 were purchased from Fischer Scientific. Acid black 48 was purchased from Acros Organics. Dulbecco's phosphate buffered saline (PBS) was purchased from GIBCO. Borrelia burgdorferi Grade 2 antigen was purchased from American Research Products. Metricel filter membranes were purchased from Pall Corporation. Anti - OspA and anti - OspB antibodies were purchased from ViroStat. 50 mL polypropylene centrifuge tubes were purchased from Nalgene Labware. Immobilon PVDF membranes were purchased from Millipore. I-Block was purchased from Applied Biosystems/Tropix. Synthetic urine (Surine, Negative Control for urine testing) was purchased from Dyna-Tek Industries. Trypsin inhibitor, 4–20% Tris-Glycine gel, Sypro Ruby protein stain and Tris-Glycine SDS running buffer were purchased from Invitrogen Corporation, USA. Bovine serum albumin (BSA) and Supersignal West Dura enhanced chemiluminescence system were purchased from ThermoFisher Scientific. O-benzotriazole- N,N,N',N'-tetramethyluronium-hexafluoro-phosphate (HBTU) and 1-hydroxy-benzotriazole (HOBt) were purchased from Peptides International. FAST Slides were purchased from, Whatman, Florham Park, NJ. Diaminobenzidine and CSA Mouse Kit was purchased from Dako. Urine for the experiments was collected from healthy donors with an IRB approved protocol (protocol number GMU HSRB #6194). Dog's urine was collected under informed consent of the owner.
2.2. Hydrogel Microparticle Synthesis
Particle synthesis and bait coupling were performed as we described previously [18, 20]. Briefly, NIPAm, BIS microparticles were obtained by precipitation polymerization [24]. Microparticles containing acrylic acid (AAc) [18] and allylamine (AA) [20] as copolymers were created. In order to obtain NIPAm-AAc microparticles, NIPAm (5.2 grams) and BIS (0.40 grams) were dissolved in Milli-Q water (600 mL). The solution was filtered with a nylon filter membrane, pore size 0.45 μm, thoroughly degassed and purged under nitrogen. Acrylic acid (500 μL) was added and the temperature of the system was raised to 80 °C. Ammonium persulfate (KPS, 0.276 grams) dissolved in water (5 mL) were added. The reaction was allowed to proceed for 6 hours at 80 °C. The reaction was allowed to cool to room temperature and stirred overnight. Microparticles were extensively washed by centrifugation in order to remove un-reacted monomer. Dye (disperse orange 3, acid black 48, coomassie brilliant R-250, acid blue 22, pararosaniline base, and rhodamine 123) coupling to NIPAm-AAc microparticles was performed via amidation of carboxylic acid activated with HBTU/HOBt/NMM [25]. Millimoles of acrylic acid in the microparticles were calculated by titration with 0.1 M NaOH (phenolphthalein as indicator). Aliquots of 10 mL of NIPAm-AAc microparticles (0.150 mmol) were lyophilized and resuspended 10 mL of dimethyl formamide (DMF) under nitrogen atmosphere. The suspension was thoroughly purged and degassed with nitrogen to completely exclude water from the system. The microparticles were activated by adding O-benzotriazole-N,N,N',N'-tetramethyl-uroniumhexafluoro- phosphate (HBTU, 0.171 g, 0.45 mmol), 1-hydroxy-benzotriazole (HOBt, 0.060 g, 0.45 mmol), 4-methylmorpholine (NMM, 0.045 g, 0.45 mmol) to the suspension. The contents of the reaction vessel were allowed to react for 5 min at room temperature under nitrogen atmosphere. After 5 min, two equivalents of the dyes listed above (disperse orange 3 0.073 g, acid black 48 0.199 g, coomassie brilliant R-250 0.248 g, acid blue 22 0.221 g, pararosaniline base 0.091 g, and rhodamine 123 0.114 g) dissolved in 10 mL of DMF were added to the suspension and let react for 48 hours at room temperature with vigorous stirring under nitrogen atmosphere. Stained microparticles were thoroughly washed in DMF and water.
In order to prepare NIPAm/AA microparticles, NIPAm (17.8 g) and BIS (0.84 g) were dissolved in water (600 mL) and then passed through a 0.2 μm filter nylon membrane. The solution was extensively purged with nitrogen at room temperature with a medium stirring rate before AA (0.52 g) was added. The solution was heated to 75 °C. KPS (0.140 g) in water (1.0 mL) was added to the solution to initiate polymerization. The reaction was maintained at 75°C under nitrogen for 3 hours. The reaction was allowed to cool to room temperature and stirred overnight. Microparticles were extensively washed via centrifugation. To obtain NIPAm/cibacron blue F3G-A (CB) microparticles, CB (0.76 g) was dissolved in aqueous sodium carbonate (10 mL, 0.1 M). The NIPAm/AA microparticle suspension (10 mL volume) was purged with nitrogen and solid sodium carbonate (0.106 g) was added to the suspension. The CB solution was then added to the NIPAm/AA microparticle suspension, and the reaction was allowed to proceed for 48 h. The resulting NIPAm/CB microparticles were harvested and washed by centrifugation.
2.3. Microparticle Characterization
Particle size dependence on temperature and pH was determined via photon correlation spectroscopy (N5 Submicron microparticle Size Analyzer, Beckman Coulter). The pH of the solution was controlled by adding proper amounts of NaOH and HCl. Average values were calculated for three measurements using a 200 s integration time, and the solutions were allowed to thermally equilibrate for 10 min before each set of measurements. Measured values were then converted to microparticle sizes via the Stokes-Einstein relationship [26]. Microparticle diameters were measured at increasing temperature from 20°C to 50°C in MilliQ water (pH 5.5) and, subsequently, at pH values ranging from 3 to 8 (25°C).
Atomic Force Microscopy (AFM) images of the microparticles were obtained using a NanoInk Atomic Force Microscope (NSCRIPTOR™ DPNH System). The NIPAm-AB48 microparticle suspension in MilliQ water (pH 5.5, 1 mg/mL) was sonicated before imaging, was deposited onto a piece of freshly cleaved mica under humid atmosphere at room temperature for 15 minutes, and was dried under nitrogen flow. Images were acquired under AC mode using a silicon tip with a typical resonance frequency of 300 kHz and a radius smaller than 10 nm. Particle weight was determined by freeze drying the microparticles and weighting the dry microparticle content.
2.4. Microparticle Incubation with Analyte Solution and Washing
Aliquots of microparticles were incubated with analyte solution, synthetic urine (Surine) or human urine, for 30 minutes at room temperature under slow rotation. Human urine was preliminarily centrifuged at 3000 rcf for 5 minutes and 4 °C to pellet cellular content. The specific gravity of the urine was measured and noted using a pocket refractometer (PAL-10S Refractometer, Atago Inc.). After incubation, the microparticles were centrifuged (7 min, 25 °C, 16,100 rcf), the supernatant was saved and the microparticles were washed three times by resuspending the pellets in water (1 mL) and centrifuging (7 min, 25 °C, 16,100 rcf). The microparticles were then directly loaded on the gel or incubated with elution buffers. Incubations with urine (10 mL) were performed with 50 mL polypropylene centrifuge tubes (Nalgene) and microparticles were separated from urine by centrifugation (45 min, 25 °C, 40,000 rcf) and washed as previously described.
2.5 Protein Extraction from Ixodes Ticks
Ixodes ticks were submerged in liquid nitrogen and pulverized. PBS (1 mL) was added to the pulverized ticks, and the mixture was combined with of NIPAm-AB48 microparticles (100 μl). The washed pellet of microparticles was incubated for 15 min at room temperature with elution buffer (300 μl, 66% acetonitrile-10% ammonium hydroxide). After incubation, the microparticles were spun (7 min, 25 °C, 16 100 rcf) and the eluate was saved. The elution step was repeated twice and the eluates were pooled together. Eluates were brought to complete dryness with Speed Vac (Thermo-Fisher).
2.6. SDS PAGE Analysis
Sodium dodecyl sulfate polyacrylamide gel electrophoresis (SDS-PAGE) was performed using 4–20% Tris-Glycine gel in the presence of Tris-Glycine SDS running Buffer on a Novex X-Cell IITM Mini-Cell (Invitrogen Corporation, USA), at 120 V. The gels were stained by silver staining.
2.7. Western Blot Analysis
Proteins were separated by 1-D gel electrophoresis in 4–20% Tris-Glycine gel as before, and then transferred onto an Immobilon PVDF membrane. The membrane was then incubated with PBS supplemented with 0.2% I-Block and 0.1% Tween 20 for 1 hour at room temperature, and then with antibody raised against OspA and OspB overnight at 4 °C under continuous agitation (1:50 dilution in PBS supplemented with 0.2% I-Block and 0.1% Tween 20). After washes with PBS supplemented with 0.2% I-Block (w/v) and 0.1% Tween 20, immunoreactivity was revealed by using a specific horseradish peroxidase conjugated anti-IgG secondary antibody (1:4000 dilution in PBS supplemented with 0.2% I-Block and 0.1% Tween 20) and the enhanced chemiluminescence system (Supersignal West Dura, ThermoFisher Scientific).
2.8. Reverse Phase Protein Microarray (RPMA) Analysis
Samples were printed on glass backed nitrocellulose array slides using an Aushon 2470 arrayer (Aushon BioSystems, Burlington, MA) equipped with 350 μm pins as previously described [27]. Immunostaining was performed on a Dako Autostainer per manufacturer's instructions (CSA kit, Dako) [27]. Each slide was incubated with anti - OspA monoclonal antibody (1:50) at room temperature for 30 minutes. This antibody was validated by western blotting. The negative control slide was incubated with antibody diluent. Secondary antibody was rabbit anti-mouse IgG (1:10). Subsequent signal detection was amplified via horseradish peroxidase mediated biotinyl tyramide deposition with chromogenic detection (Diaminobenzidine) per manufacturer's instructions (Dako). Total protein per microarray spot was determined with a Sypro Ruby protein stain per manufacturer's directions and imaged with a CCD camera (NovaRay, Alpha Innotech, San Leandro, CA).
3. Results
3.1. Bait Selection and Incorporation in the Microparticles
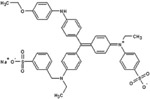
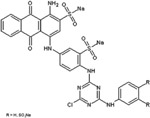
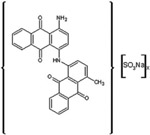
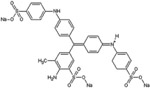
Certain dye molecules strongly and specifically interact with proteins [28–30]. In previous studies, bait loaded hydrogel microparticles have been successfully exploited as capturing agents for low molecular weight, low abundance biomarkers in biologic fluids [17, 18, 20, 21]. Dye molecules were covalently bound to harvesting hydrogel microparticles. Dyes were selected that show affinity for proteins in analytical techniques (e.g. brilliant blue R-250) [31], that are known to induce allergic reaction upon skin contact (e.g. acid black 48) [28, 29], and that are utilized in histological staining of pathology specimens (e.g. pararosalinine base)[30] (Table 1). The dyes are characterized by very diverse chemical structures but they all have a primary or secondary amine as side group. N-isopropylacrylamide (NIPAm) based hydrogel microparticles containing acrylic acid (AAc) as copolymer provided carboxylic groups that were coupled to the dye amines to form amides. The reaction was carried out in dimethylformamide (DMF) using HBTU/HOBT/NMM activation [32]. Cibacron blue 3FGA was coupled to NIPAm/allylamine microparticles via chlorine substitution in the triazine group present in the dye as described by Fredolini et al. [20].
Table 1.
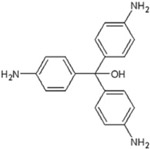
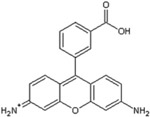
Dye chemical structures and names.
|
Coomassie Brilliant Blue R-250 |
|
Cibacron Blue F3GA |
|
|
Disperse Orange 3 |
|
Acid Black 48 |
|
Acid Blue 22 |
|
Pararosaniline Base |
|
Rhodamine 123 |
3.2. Physical Characterization of the Microparticles
Particle dimensions and responsiveness to variations in solution temperature and pH were characterized by means of light scattering. At 25 °C NIPAm-acid black 48 (AB48) microparticles had an average diameter of 761.8 nm +/− 16.07. At higher temperatures NIPAm-AB48 microparticle size diminished significantly (Figure 3a). In addition, the diameter of the microparticles demonstrated a positive correlation with pH. Diameters ranged from 360.8 +/− 7.85 nm to 1019.7 +/− 33.06 nm for pH values from 2.6 to 8.2 (Figure 3b). This temperature and pH sensitive behavior is typical of hydrogel microparticles [33]. As a result of the demonstrated dependence of the NIPAm-AB48 microparticle diameter with respect to pH, SDS-PAGE analyses were performed to determine at which pH the microparticles would optimize their performance as described below. All urine samples were then titrated to the optimum pH with hydrochloric acid before incubating the microparticles in the urine.
Figure 3.

a. Correlation between temperature and average diameter of microparticles. Standard deviations represented by error bars. b. Correlation between pH and average diameter of microparticles. Standard deviations represented by error bars. c. and d. False color AFM images of the NIPAm-AB48 hydrogel microparticles. Diameter, measured on the AFM image of 20 microparticles, was 606.6 +/− 22 nm.
Particles were imaged by means of atomic force microscopy (AFM). NIPAm-AB48 microparticles appeared homogeneous in size and not prone to aggregation. These characteristics are very important for a high degree of homogeneity in results and for insuring that microparticles remain in suspension and do not precipitate when mixed with analyte solution. Shown in Figure 3c and 3d are images of the NIPAm-AB48 microparticles.
3.3. Screening of Different Bait Chemistries against B. burgdorferi Proteins
A panel of microparticles functionalized with different affinity baits was screened against B. burgdorferi proteins to determine which microparticles had the best performance. SDS-PAGE analysis was conducted with B. burgdorferi whole protein mixture. Aliquots of 50 μl of B. burgdorferi protein (0.08 mg/mL) were incubated with 50 μl (1 mg/mL) of nine different types of bait-functionalized microparticles (cibacron blue F3GA, brilliant blue R-250, acid blue 22, disperse orange 3, acid black 48, pararosaniline base, rhodamine 123, acrylic acid, and allylamine). Microparticles were separated from the solution by centrifugation and washed with water prior to loading the SDS-PAGE as described in the Materials and Methods Section.
Two antigen species at 31 and 34 kDa, corresponding to the known sizes of OspA and OspB, respectively, were sequestered to some degree by every type of bait tested (Figure 4). Each type of microparticle bait harvested B. burgdorferi protein with a different level of affinity. AB48 functionalized hydrogel microparticles were chosen for further experimentation because they outperformed all the other classes of baits as demonstrated by the intense silver stained bands on SDS-PAGE.
Figure 4.

Silver stain SDS-PAGE demonstrating the ability of nine different types of dye-functionalized hydrogel microparticles (listed above each gel) to concentrate B. burgdorferi proteins in water. Acid Black 48 dye was determined to be the most effective at concentrating the total protein mix. OspA 31 kDa, OspB 34 kDa, IS = initial solution, S = supernatant, and P = microparticle content.
3.4. pH Dependence of Protein Uptake by AB48 Microparticles
An SDS-PAGE gel electrophoresis experiment was conducted to examine the ability of the NIPAm-AB48 microparticles to concentrate and sequester B. burgdorferi protein in Surine and to determine the optimum pH of urine for testing. Three solutions were made, each containing 0.088 mg/mL B. burgdorferi whole protein mixture in synthetic urine at pH 5, 6, and 7. 50 μl of each solution was mixed with 200 μl of NIPAm-AB48 microparticles. Microparticles were pelleted and washed with water. SDS PAGE analysis was performed (Figure 5).
Figure 5.

NIPAm-Acid Black 48 hydrogel microparticles sequester and concentrate B. burgdorferi proteins in synthetic urine in a pH dependent manner. SDS-PAGE silver stain of B. burgdorferi proteins OspA and OspB post incubation with NIPAm-AB48 microparticles in synthetic urine at three different pH values: 5, 6 and 7 (lanes 3, 5, and 6 respectively) showed optimal binding microparticle capacity at pH 5 (lane 3). Supernatant was completely depleted. IS = initial solution, S = supernatant, and P = microparticle content.
NIPAm-Acid Black 48 microparticles were able to concentrate the B. burgdorferi proteins in synthetic urine and completely deplete the supernatant (the solution phase outside the microparticles). The optimal pH for protein uptake was between 5 and 6. In all subsequent experiments, synthetic and human urine were titrated with hydrochloric acid to pH 5 to maintain a constant pH in the range of normal human urine and to optimize the performance of NIPAm-AB48 microparticles.
3.5. Detection of Microparticle Harvested Proteins in Synthetic Urine by Western Blotting
In order to assess the sensitivity of western blotting with NIPAm-AB48 microparticle harvested bacterial proteins, we performed western blotting with B. burgdorferi proteins dissolved in 100 μl of synthetic urine at pH 5 (0.07 mg/mL) and incubated with 100 μl AB48 microparticles. Microparticles were pelleted by centrifugation, washed, separated by SDS-PAGE and then blotted onto Immobilon PVDF membranes. One membrane was then incubated with OspA antibody and the other with OspB antibody.
OspA and OspB antibodies detected strong bands at 31 and 34 kDa respectively (Figure 6a and 6b). The analysis confirmed complete uptake of B. burgdorferi proteins in solution and concentration inside NIPAm-AB48 microparticles.
Figure 6.

Western blot analysis demonstrating the presence of B. burgdorferi proteins captured from synthetic urine. a. OspA and b. OspB were detected in the protein mixture. NIPAm-AB48 microparticles completely depleted the supernatant and concentrated B. burgdorferi proteins present in solution. C= control, i.e. B. burgdorferi protein solution, S = supernatant, and P = microparticles. NIPAm/AB48 microparticles sequestered and concentrated OspA and OspB spiked in 100 μL of synthetic urine at a concentration of c. 7 μg/mL, 3.5 μg/mL, 0.7 μg/mL; d. 0.35 μg/mL, 0.07 μg/mL, and e. 0.07 μg/mL, 0.007 μg/mL, and 0.0007 μg/mL, respectively. This study indicates that the minimum detectable concentration of B. burgdorferi protein in 100 μL solution after microparticle concentration was 7 ng/mL, therefore a protein quantity of 700 pg. IS= initial solution, S = supernatant, and P = microparticles.
Additional western blot analyses were performed to test the sensitivity of this system. B. burgdorferi proteins were dissolved in 100 μL of synthetic urine at pH 5 at the following concentrations 7 μg/mL, 3.5 μg/mL, 0.7 μg/mL, 0.35 μg/mL, 0.070 μg/mL, 0.007 μg/mL, and 0.0007 μg/mL. 100 μL of NIPAm-AB48 microparticles were added to these solutions. NIPAm-AB48 captured B. burgdorferi proteins with high affinity and concentrated them from synthetic urine (Figure 6c, 6d, and 6e).
The western blot detection limit was 7 ng/mL with the microparticles (Figure 6e, lane 6) and 70 ng/mL without the microparticles (Figure 6e, lane 1). The ability of the microparticles to concentrate proteins is based on volumetric ratio between the initial solution and the final microparticle pellet; therefore, the higher the volume of the initial solution, the higher the sensitivity that can be achieved. In this first experiment 100 μL of initial solution was used. If the starting volume is one mL, or ten times larger, the solution will contain ten times more antigen and the sensitivity will increase 10 fold. This effect is due to the fact that microparticles will sequester all of the antigen in this larger volume.
3.6 Detection of B. burgdorferi Proteins in a Single Tick
The microparticles were used to detect the B. burgdorferi antigen in Ixodes ticks. During feeding, B. burgdorferi reproduces in the tick gut. B. burgdorferi bacteria take approximately 24 hours to be transferred from tick to human [34]. By the time the B. burgdorferi bacteria have been transferred to a human, the B. burgdorferi present in the tick gut have multiplied from approximately 8,000 organisms to approximately 170,000 organisms [35]. Proteins extracted from infected ticks and concentrated by NIPAm-AB48 microparticles contained the characteristic species of B. burgdorferi and were scored positive for Lyme disease (Figure 7).
Figure 7.

Western blot analysis showing the control mixture containing 7ng B. burgdorferi protein diluted in water, and the eluate from NIPAm-AB48 microparticles incubated with the tick proteins. The band pattern from the ticks was similar to that from the control protein mixture, indicating that the antibodies reacted with B. burgdorferi protein in the tick. C= commercial control, E= eluate from the microparticles.
A total of 14 Ixodes scapularis ticks, representing female and male ticks collected in Virginia and Pennsylvania, were tested for B. burgdorferi proteins. Each tick was incubated with microparticles in the same procedure as described above, and was tested for the antigens OspA and OspB. Four out of nine female ticks were positive for Lyme disease, while all five male ticks were negative (Table 2). These experiments demonstrated that the proposed test for Lyme disease utilizing a preprocessing step with microparticles has the ability to detect naturally occurring proteins antigens with high sensitivity in single infected ticks.
Table 2.
Description of ticks and whether or not Western blot was positive for the bacterial antigens OspA and OspB.
| Tick | Description | Positive |
|---|---|---|
| 1 | Female, Ixodes scapularis, Virginia | Yes |
| 2 | Male, Ixodes scapularis, Virginia | No |
| 3 | Male, Ixodes scapularis, Virginia | No |
| 4 | Male, Ixodes scapularis, Virginia | No |
| 5 | Engorged female, Ixodes scapularis, Virginia | Yes |
| 6 | Engorged female, Ixodes scapularis, Virginia | Yes |
| 7 | Female, Ixodes scapularis, Virginia | Yes |
| 8 | Female, Ixodes scapularis, Virginia | No[a] |
| 9 | Engorged female, Ixodes scapularis, Virginia | No[a] |
| 10 | Male, Ixodes scapularis, Pennsylvania | No |
| 11 | Female, Ixodes scapularis, Pennsylvania | No |
| 12 | Engorged female, Ixodes scapularis, Pennsylvania | No |
| 13 | Male, Ixodes scapularis, Pennsylvania | No |
| 14 | Female, Ixodes scapularis, Pennsylvania | No |
Ticks 8 and 9 came from a dog that had received an Lyme disease vaccination
3.7. Limit of Detection in Human Urine
To evaluate the process in human urine, in the presence of competing human proteins, an incubation was conducted with B. burgdorferi protein spiked at a concentration of 7 ng/mL in 1 mL of human urine (specific gravity 1.004) titrated at pH 5 using hydrochloric acid. 200 μl of NIPAm-AB48 microparticles were added to the urine solution and incubated for 30 minutes. Using western blot analysis (Figure 8a), it was shown that the microparticles were able to completely sequester and concentrate B. burgdorferi proteins spiked in human urine. Proteins at the initial concentration of 7 ng/mL were not detectable without the microparticle concentration step (Figure 8a, lane 2); the detection antibodies did not cross react with any of the excess human proteins supporting the specificity of the antibody.
Figure 8.

Western blot showing the concentration of B. burgdorferi proteins from a. 1 mL and b. 10 mL human urine. U=plain human urine, IS= initial solution of B. burgdorferi proteins spiked in human urine, S = supernatant, and P = microparticles, E = eluate from the microparticles. c. Graph shows the concentration effect of the microparticles. The band intensity for the proteins OspA and OspB was greatly increased by the microparticles (more than 100 fold).
To increase the sensitivity, another western blot analysis was performed on a larger volume of urine. B. burgdorferi proteins were spiked in 10 mL of human urine (specific gravity 1.024) at the following concentrations: 7 ng/mL, 3.5 ng/mL, 1.75 ng/mL, and 0.7 ng/mL. 0.75 mL of NIPAm-AB48 microparticles were added to each sample and the samples were incubated for 30 minutes (Figure 8b).
The microparticles were able to concentrate 7 ng of B. burgdorferi proteins from 10 mL to attain a strong western signal in the presence of a 10,000 fold excess of human proteins in the urine. The final concentration of B. burgdorferi proteins detected in human urine using the microparticles was 0.7 ng/mL. This result, along with the result shown in Figure 6, indicates that the NIPAm-AB48 microparticles were able to concentrate all the protein in the solution and that the sensitivity, as expected, is a function of the starting volume of urine solution. The projected sensitivity limit for western blotting is 700 pg of protein in the entire sample in order for the test to have a positive result (Figure 6). Using ImageQuant 5.2 software, the intensities of the initial solution and microparticle bands on the Western blot shown in Figure 8b were measured. The microparticles raised the band intensity values of OspA and OspB more than one hundred fold with respect to the initial urine solution achieving the measurement of extremely diluted solutions otherwise not detectable with Western blot analysis (Figure 8c).
3.8. Reverse Phase Protein Microarray Analysis
Reverse Phase Protein Microarray (RPMA) technology was used to further evaluate the concentration capabilities of the microparticles and to provide more sensitive and quantitative information about bacterial antigens in biological solutions. OspA immunoassay using the previously described monoclonal anti-OspA antibody was calibrated as reported in Figure 9a and the limit of detection was 0.3 ng/mL. Microparticles were incubated with a model solution of OspA diluted in 1 mL of water at a concentration of 3.4 +/− 0.4 ng/mL. The captured proteins were eluted in a volume of 100 μL giving a theoretical concentration factor of 10. As shown in Figure 9b, there was no residual protein in the supernatant and OspA value in the eluate was 38.1 +/− 2.3 ng/mL, resulting in a yield higher than 95%.
Figure 9.

Microparticle concentration step was successfully coupled to reverse phase protein microarray (RPMA) calibrated immunoassay directed against outer surface protein A (OspA). After microparticle preprocessing, no OspA was detectable in the supernatant and the yield of the concentration process was higher than > 95%.
Using this calibrated immunoassay, we evaluated the presence of bacterial antigen in the urine of an example dog that was infected by Lyme disease. 3.5 mL of dog's urine were incubated with microparticles and the captured protein was reconstituted in a volume of 200 μL (concentration factor of 17.5). RPMA analysis yielded a concentration of OspA in the microparticle processed urine of 1.65 +/− 0.2 ng/mL. The estimated concentration of OspA in the original volume of urine from Lyme disease infected dog was 94.3 +/− 0.01 pg/mL. These data show the feasibility of the proposed strategy of coupling harvesting microparticles to a quantitative immunoassay for the detection of bacterial proteins in a Lyme disease infected mammal.
4. Discussion
In this study we produced N-isopropylacrylamide (NIPAm) hydrogel microparticles functionalized with novel affinity baits (such as acid black 48, AB48 dye) and we selected the optimal bait for capturing Lyme disease bacterial proteins in urine. NIPAm-AB48 microparticles sequestered and concentrated all the target protein analytes in solution, independent of total protein concentration and solution volume.
In this study, the microparticle preprocessing step was coupled to western blot analysis to perform a qualitative screening for the presence of the bacterial antigen in solution. In addition, a pilot study with a quantitative immunoassay (reverse phase protein microarrays, RPMA) proved that antigens captured by the microparticles could be extracted and remained immuno reactive. Moreover, naturally occurring OspA was detected in the urine from one mammal (dog) known to be infected by B. burgdorferi after microparticles concentration and analysis with RPMA.
A urine antigen test of adequate sensitivity and precision has potential utility in the management of Lyme disease. A Lyme disease diagnostic workup currently includes serological tests for anti B. burgdorferi antibodies [6]. Antibodies specific to B. burgdorferi proteins can take three to four weeks to develop, at which point the disease has already progressed [7]. A direct antigen test for the bacteria, instead of a serologic test, offers a means to detect the infection before the immune response is mounted. The present urine processing method, incorporating microparticles, can increase the sensitivity of B. burgdorferi antigen testing by 100 folds. This biomaterial is suitable for clinical validation in patients longitudinally followed following a documented tick bite. The ability to test individual ticks directly for B. burgdorferi antigen is a corollary application of the capturing hydrogel microparticles, and has extended applications to epidemiology and entomology.
Urine bacterial antigen urinary testing is relevant to population screening for infectious diseases in the field or in underdeveloped geographies. Candidate infectious diseases include airborne (e.g. tuberculosis) or vector borne infections (e.g. Chagas disease, and rocky mountain spotted fever). Because the microparticles function optimally at room temperature and protect proteins from degradation [18], the urine samples can be incubated with the microparticles as soon as they are collected from the patients, preventing antigen degradation during transit from the field collection site to the testing laboratory [17, 18].
5. Conclusions
The results from this study indicate that bait loaded hydrogel microparticles are a biomaterial suitable to concentrate and sequester bacterial proteins, such as Lyme disease B. burgdorferi antigen in urine and thereby increase the sensitivity of infectious disease antigen detection at least 100 fold from a starting volume of 10 mL. Application of this biomaterial to antigen testing has the potential to improve the options for early stage diagnosis of Lyme disease when the infection is most responsive to antibiotic therapy. Clinical validation of this approach to Lyme disease antigen testing is being planned based on these results. The extension of this technology to other infectious diseases is feasible.
Supplementary Material
Figure SI1: SDS PAGE analysis demonstrating molecular size sieving properties of NIPAm/AB48 microparticles. Microparticles were incubated with a solution containing proteins ranging from 6 to 66 kDa and captured only proteins below 40 kDa. IS = initial solution, S = supernatant, and P = microparticle content
Acknowledgements
This work was supported partially by 1) George Mason University, 2) the Italian Istituto Superiore di Sanita' in the framework of the Italy/USA cooperation agreement between the U.S. Department of Health and Human Services, George Mason University, and the Italian Ministry of Public Health, 3) U.S. Department of Energy DE-FC52-04NA2545, 4) NIH, NCI grant 1R21CA137706-01. The funding organizations did not have any role in data collection and analysis, decision to publish, or preparation of the manuscript.
Footnotes
Publisher's Disclaimer: This is a PDF file of an unedited manuscript that has been accepted for publication. As a service to our customers we are providing this early version of the manuscript. The manuscript will undergo copyediting, typesetting, and review of the resulting proof before it is published in its final citable form. Please note that during the production process errors may be discovered which could affect the content, and all legal disclaimers that apply to the journal pertain.
References
- 1.Hubalek Z. Epidemiology of Lyme borreliosis. Curr Probl Dermatol. 2009;37:31–50. doi: 10.1159/000213069. [DOI] [PubMed] [Google Scholar]
- 2.Cameron DJ. An appraisal of “chronic Lyme disease”. N Engl J Med. 2008;358(4):429–430. [PubMed] [Google Scholar]
- 3.Fallon BA, Lipkin RB, Corbera KM, Yu S, Nobler MS, Keilp JG, et al. Regional cerebral blood flow and metabolic rate in persistent Lyme encephalopathy. Arch Gen Psychiatry. 2009;66(5):554–563. doi: 10.1001/archgenpsychiatry.2009.29. [DOI] [PubMed] [Google Scholar]
- 4.Heckler AK, Shmorhun D. Asymptomatic, transient complete heart block in a pediatric patient with Lyme disease. Clin Pediatr (Phila) 2009;49(1):82–85. doi: 10.1177/0009922808330784. [DOI] [PubMed] [Google Scholar]
- 5.Barr WB, Rastogi R, Ravdin L, Hilton E. Relations among indexes of memory disturbance and depression in patients with Lyme borreliosis. Appl Neuropsychol. 1999;6(1):12–18. doi: 10.1207/s15324826an0601_2. [DOI] [PubMed] [Google Scholar]
- 6.Wormser GP, Dattwyler RJ, Shapiro ED, Halperin JJ, Steere AC, Klempner MS, et al. The clinical assessment, treatment, and prevention of Lyme disease, human granulocytic anaplasmosis, and babesiosis: clinical practice guidelines by the Infectious Diseases Society of America. Clin Infect Dis. 2006;43(9):1089–1134. doi: 10.1086/508667. [DOI] [PubMed] [Google Scholar]
- 7.Nau R, Christen HJ, Eiffert H. Lyme disease--current state of knowledge. Dtsch Arztebl Int. 2009;106(5):72–81. doi: 10.3238/arztebl.2009.0072. quiz 82, I. [DOI] [PMC free article] [PubMed] [Google Scholar]
- 8.Coulter P, Lema C, Flayhart D, Linhardt AS, Aucott JN, Auwaerter PG, et al. Two-year evaluation of Borrelia burgdorferi culture and supplemental tests for definitive diagnosis of Lyme disease. J Clin Microbiol. 2005;43(10):5080–5084. doi: 10.1128/JCM.43.10.5080-5084.2005. [DOI] [PMC free article] [PubMed] [Google Scholar]
- 9.Hyde FW, Johnson RC, White TJ, Shelburne CE. Detection of antigens in urine of mice and humans infected with Borrelia burgdorferi, etiologic agent of Lyme disease. J Clin Microbiol. 1989;27(1):58–61. doi: 10.1128/jcm.27.1.58-61.1989. [DOI] [PMC free article] [PubMed] [Google Scholar]
- 10.Harris NS, Stephens BG. Detection of Borrelia burgdorferi antigen in urine from patients with Lyme borreliosis. J Spirochetal Tick-Borne Dis. 1995;2(2`):37–41. [Google Scholar]
- 11.Rauter C, Mueller M, Diterich I, Zeller S, Hassler D, Meergans T, et al. Critical evaluation of urine-based PCR assay for diagnosis of Lyme borreliosis. Clin Diagn Lab Immunol. 2005;12(8):910–917. doi: 10.1128/CDLI.12.8.910-917.2005. [DOI] [PMC free article] [PubMed] [Google Scholar]
- 12.Vojdani A, Hebroni F, Raphael Y, Erde J, Raxlen B. Novel Diagnosis of Lyme Disease: Potential for CAM Intervention. Evid Based Complement Alternat Med. 2009;6(3):283–295. doi: 10.1093/ecam/nem138. [DOI] [PMC free article] [PubMed] [Google Scholar]
- 13.Wu W, Shen J, Banerjee P, Zhou S. Core-shell hybrid nanogels for integration of optical temperature-sensing, targeted tumor cell imaging, and combined chemo-photothermal treatment. Biomaterials. 2010;31(29):7555–7566. doi: 10.1016/j.biomaterials.2010.06.030. [DOI] [PubMed] [Google Scholar]
- 14.Wang C, Javadi A, Ghaffari M, Gong S. A pH-sensitive molecularly imprinted nanospheres/hydrogel composite as a coating for implantable biosensors. Biomaterials. 2010;31(18):4944–4951. doi: 10.1016/j.biomaterials.2010.02.073. [DOI] [PubMed] [Google Scholar]
- 15.Leach JB, Schmidt CE. Characterization of protein release from photocrosslinkable hyaluronic acid-polyethylene glycol hydrogel tissue engineering scaffolds. Biomaterials. 2005;26(2):125–135. doi: 10.1016/j.biomaterials.2004.02.018. [DOI] [PubMed] [Google Scholar]
- 16.Qiu Y, Park K. Environment-sensitive hydrogels for drug delivery. Adv Drug Deliv Rev. 2001;53(3):321–339. doi: 10.1016/s0169-409x(01)00203-4. [DOI] [PubMed] [Google Scholar]
- 17.Longo C, Patanarut A, George T, Bishop B, Zhou W, Fredolini C, et al. Core-shell hydrogel particles harvest, concentrate and preserve labile low abundance biomarkers. PLoS One. 2009;4(3):e4763. doi: 10.1371/journal.pone.0004763. [DOI] [PMC free article] [PubMed] [Google Scholar]
- 18.Luchini A, Geho DH, Bishop B, Tran D, Xia C, Dufour RL, et al. Smart hydrogel particles: biomarker harvesting: one-step affinity purification, size exclusion, and protection against degradation. Nano Lett. 2008;8(1):350–361. doi: 10.1021/nl072174l. [DOI] [PMC free article] [PubMed] [Google Scholar]
- 19.Rainczuk A, Meehan K, Steer DL, Stanton PG, Robertson DM, Stephens AN. An optimized procedure for the capture, fractionation and proteomic analysis of proteins using hydrogel nanoparticles. Proteomics. 2009;10(2):332–336. doi: 10.1002/pmic.200900187. [DOI] [PubMed] [Google Scholar]
- 20.Fredolini C, Meani F, Reeder KA, Rucker S, Patanarut A, Botterell PJ, et al. Concentration and Preservation of Very Low Abundance Biomarkers in Urine, such as Human Growth Hormone (hGH), by Cibacron Blue F3G-A Loaded Hydrogel Particles. Nano Res. 2008;1(6):502–518. doi: 10.1007/s12274-008-8054-z. [DOI] [PMC free article] [PubMed] [Google Scholar]
- 21.Luchini A, Longo C, Espina V, Petricoin EF, Liotta LA. Nanoparticle technology: Addressing the fundamental roadblocks to protein biomarker discovery. J Mater Chem. 2009;19(29):5071–5077. doi: 10.1039/b822264a. [DOI] [PMC free article] [PubMed] [Google Scholar]
- 22.Dorward DW, Schwan TG, Garon CF. Immune capture and detection of Borrelia burgdorferi antigens in urine, blood, or tissues from infected ticks, mice, dogs, and humans. J Clin Microbiol. 1991;29(6):1162–1170. doi: 10.1128/jcm.29.6.1162-1170.1991. [DOI] [PMC free article] [PubMed] [Google Scholar]
- 23.Norman GL, Antig JM, Bigaignon G, Hogrefe WR. Serodiagnosis of Lyme borreliosis by Borrelia burgdorferi sensu stricto, B. garinii, and B. afzelii western blots (immunoblots) J Clin Microbiol. 1996;34(7):1732–1738. doi: 10.1128/jcm.34.7.1732-1738.1996. [DOI] [PMC free article] [PubMed] [Google Scholar]
- 24.Jones CD, Lyon LA. Synthesis and Characterization of Multiresponsive Core-Shell Microgels. Macromolecules. 2000;33(22):8301–8306. [Google Scholar]
- 25.Zhang S, Chen L, Luo Y, Gunawan A, Lawrence DS, Zhang ZY. Acquisition of a potent and selective TC-PTP inhibitor via a stepwise fluorophore-tagged combinatorial synthesis and screening strategy. J Am Chem Soc. 2009;131(36):13072–13079. doi: 10.1021/ja903733z. [DOI] [PMC free article] [PubMed] [Google Scholar]
- 26.Pecora R. Dynamic Light Scattering: Applications of Photon Correlation Spectroscopy. Springer; New York: 1985. [Google Scholar]
- 27.Espina V, Edmiston KH, Heiby M, Pierobon M, Sciro M, Merritt B, et al. A portrait of tissue phosphoprotein stability in the clinical tissue procurement process. Mol Cell Proteomics. 2008;7(10):1998–2018. doi: 10.1074/mcp.M700596-MCP200. [DOI] [PMC free article] [PubMed] [Google Scholar]
- 28.Hatch KL, Maibach HI. Textile dye allergic contact dermatitis prevalence. Contact Dermatitis. 2000;42(4):187–195. doi: 10.1034/j.1600-0536.2000.042004187.x. [DOI] [PubMed] [Google Scholar]
- 29.Hatch KL, Magee PS. A Discriminant Model for Allergic Contact Dermatitis in Anthraquinone Disperse Dyes. Quantitative Structure-Activity Relationships. 1998;17(01):20–26. [Google Scholar]
- 30.Lyon HO, Schulte EK, Prento P, Barer MR, Bene MC. Standardized staining methods: Feulgen-Rossenbeck reaction for desoxyribonucleic acid and periodic acid-Schiff (PAS) procedure. Biotech Histochem. 2002;77(3):121–125. [PubMed] [Google Scholar]
- 31.Noble JE, Bailey MJ. Quantitation of protein. Methods Enzymol. 2009;463:73–95. doi: 10.1016/S0076-6879(09)63008-1. [DOI] [PubMed] [Google Scholar]
- 32.Nakajima N, Ikada Y. Mechanism of amide formation by carbodiimide for bioconjugation in aqueous media. Bioconjug Chem. 1995;6(1):123–130. doi: 10.1021/bc00031a015. [DOI] [PubMed] [Google Scholar]
- 33.Pelton R. Temperature-sensitive aqueous microgels. Adv Colloid Interface Sci. 2000;85(1):1–33. doi: 10.1016/s0001-8686(99)00023-8. [DOI] [PubMed] [Google Scholar]
- 34.Piesman J, Mather TN, Sinsky RJ, Spielman A. Duration of tick attachment and Borrelia burgdorferi transmission. J Clin Microbiol. 1987;25(3):557–558. doi: 10.1128/jcm.25.3.557-558.1987. [DOI] [PMC free article] [PubMed] [Google Scholar]
- 35.De Silva AM, Fikrig E. Growth and migration of Borrelia burgdorferi in Ixodes ticks during blood feeding. Am J Trop Med Hyg. 1995;53(4):397–404. doi: 10.4269/ajtmh.1995.53.397. [DOI] [PubMed] [Google Scholar]
Associated Data
This section collects any data citations, data availability statements, or supplementary materials included in this article.
Supplementary Materials
Figure SI1: SDS PAGE analysis demonstrating molecular size sieving properties of NIPAm/AB48 microparticles. Microparticles were incubated with a solution containing proteins ranging from 6 to 66 kDa and captured only proteins below 40 kDa. IS = initial solution, S = supernatant, and P = microparticle content