Abstract
We describe a new approach that combines several techniques to allow abnormal electrical and calcium activity to be visualized within hypoperfused myocardial tissue. A flexible microcannula was inserted into the left anterior descending artery of Langendorff perfused rat hearts, an air-tight seal between the coronary artery and the cannula was created, and an HPLC pump was used to deliver a specified flowrate through the microcannula. High resolution optical mapping of NADH/calcium, NADH/voltage or calcium/voltage was then conducted using a dual camera system. The ECG was acquired using surface electrodes. This perfusion technique is superior to occluding a vessel by either a tie or a clamp because it allows precise control of the composition and amount of flow to a defined ischemic bed. Another advantage is that flow can be stopped and resumed remotely, without touching the heart. This allows ectopic beats, or other arrhythmogenic activity, such as alternans, to be recorded immediately after changes in flow are imposed. Altogether, the described method provides a powerful new tool to assess how coronary flow rate affects the degree of local ischemia by the ability to record abnormal patterns of electrical activity and associated intracellular calcium transients with high spatiotemporal resolution from epicardial areas as small as 100 × 100 μm.
Keywords: optical mapping, coronary vessels, ischemia-reperfusion
Introduction
Reduced or completely blocked blood flow during the early phase of ischemia elicits profound changes in the metabolism and electrical activity of cardiac myocytes (Vetterlein et al 2003). Such changes are highly heterogeneous and can lead to arrhythmia (Pogwizd and Corr 1987). Steep gradients of metabolic, ionic and neurogenic changes are present at the boundaries between ischemic and normal tissue, and this ‘border zone’ has been identified to be the main culprit behind initiation and maintenance of ischemia-induced arrhythmias (Hearse and Yellon 1981, Arutunyan et al 2002, Buckingham et al 1986). Improved understanding of spatiotemporal progression of these changes is crucial for identifying the specific mechanisms that trigger initial arrhythmogenic events.
To achieve this goal, we developed a new approach and implemented it using excised rat hearts. The method can also be used in the hearts of larger animals, in which smaller coronary vessels could be cannulated. It is also applicable for studies of ischemia-induced changes in other tissues. Each of the steps in the described protocol is relatively simple; however their combination provides a powerful new way to control the flow within an ischemic region and then monitor the resulting physiological changes.
Methods and results
Our specific goal was to isolate and cannulate the left anterior descending artery (LAD) of the rat heart, but our techniques could be applied to other tissues as well. The LAD provides blood flow to a large area of the left ventricle. Identifying this vessel and the other major branches of the left coronary artery (LCA) was a critical first step in implementing our technique.
Identification of the underlying coronary vessel structure
Anatomy atlases commonly show large ventricular coronary arteries and veins as lying parallel to each other, as if they were a vascular bundle. This depiction can be misleading when identifying a specific coronary artery. For example, in rat hearts the LCA and its branches are located within the muscle, under veins that are much closer to the surface. In addition, coronary arteries and veins in the rat are rarely parallel to each other and arteries blend in with surrounding tissue due to their small diameter (<0.5 mm) and thick epithelial exterior. Once an artery has been identified, cannulating it without interrupting flow to its branches is not easy because the branches dive into the tissue at multiple sites. Optimally, each branch in the vicinity of the site of cannulation should be identified to avoid occluding it by the cannulation procedure.
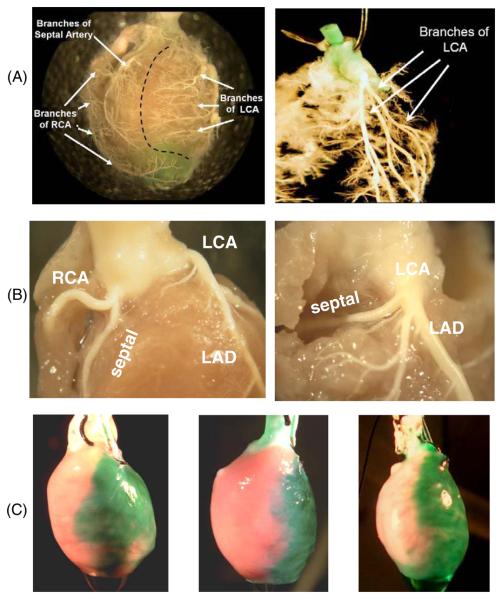
To visualize the morphology of cardiac vasculature we injected polymer (Smooth On Inc, Brush-On 40) into the aorta of rat hearts (n = 10). Hearts were then submerged in a 10% formalin solution overnight. Tissue was then carefully dissected from around the polymer to reveal the vessels. In one series of studies, the hearts were immediately placed in a 2% pepsin solution at 37°C after polymer injection. Vasculature at various tissue depths was revealed as a function of time in the enzyme solution (figure 1(A), left panel). When hearts were allowed to fully digest the result was a cast of the inside of the left ventricle surrounded by a cast of the coronary vessels. Suspending this cast in water after removing the cast of the left ventricle revealed the original shape of the arterial tree. The LCA and all of its major branches for one of these casts are shown in figure 1(A), right panel.
Figure 1.
Coronary vessel structure in the rat. (A) Right and left coronary artery beds. Polymer casts show the main two branches of the coronary circulation. RCA: right coronary artery. LCA: left coronary artery. (B) Branches of the RCA and LCA near the ostium. The LAD is the main branch off the LCA. A case of the septal artery branching from the RCA is shown on the left and a case of the septal artery branching from the LCA is shown on the right. (Panel C) injection of green dye into the microcannula reveals the tissue bed fed by the LAD. Three microcannulated hearts are shown. The anatomies of individual coronary beds are slightly different between hearts and so are the areas of affected epicardial tissue.
In seven hearts the septal artery (the major artery that supplies the interventricular septum) originated from the right coronary artery (RCA), as shown in figure 1(B), left panel. This observation is in agreement with previous studies in rats and rabbits that systematically addressed coronary anatomy (Liu et al 1997, Podesser et al 1997). When the septal artery originated from the RCA its origin was within 2 mm of the ostium and it descended superficially inside the RV along the posterior wall. When the septal artery originated from the LCA its origin was within 3 mm of the ostium and it ran transversely behind the proximal pulmonary trunk before descending (n = 3, figure 1(B), right panel). The location of the septal artery is important because in our technique a microcannula is placed in the proximal region of the LCA. When the septal artery originates from the LCA it must not be occluded during the microcannulation procedure, as this would cause ischemia of the septum, confounding the interpretation of epicardial optical mapping data. Additional images illustrating the anatomy of the rat heart and its coronary arteries can be found on our lab website (www.lab.sarvazyan.com/images).
Step 1. Preparation of the heart
All animal experiments were conducted in accordance with the guidelines of the Institutional Animal Care and Use Committee. Adult Sprague-Dawley rats were injected with sodium heparin (i.p., 500 U kg−1) and anesthetized with sodium pentobarbital (i.p., 45 mg kg−1). The heart was quickly excised, its aorta cannulated and secured with a suture. The aortic cannula was flanged to keep the tie in place. The heart was then transferred to a Langendorff perfusion system, where it was retrograde-perfused with Tyrode's solution (4 ml min−1). The atria were removed and excess tissue was trimmed from the base of the aorta. The heart was then moved to a specially designed rotating polymethylmethacrylate (plexiglass) platform placed under a dissecting scope (figures 2(A), 3(A)). To stop contractions, the perfusion media were switched to a high potassium cardioplegic solution (3 mL min−1) containing 85 mM NaCl, 25 mM KCl, 10 mM MgCl2 and 140 mM glucose. It was supplemented with 10 μg of phenol red and 5 mM HEPES. This step and subsequent procedures were performed at room temperature and all solutions were buffered to maintain a pH of 7.4. The total time from heart excision to retrograde-perfusion with cardioplegic solution was typically 5 min.
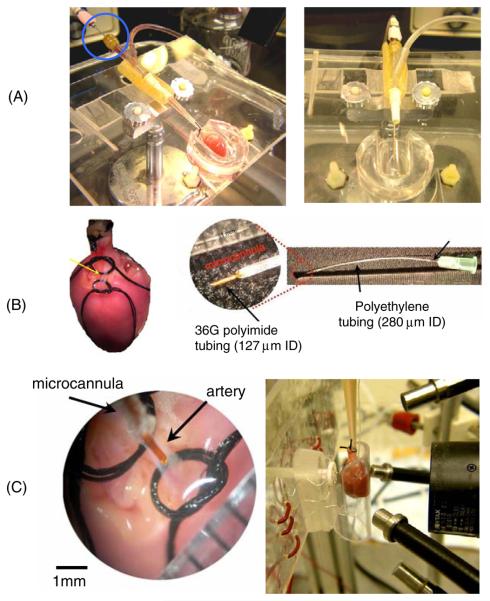
Figure 2.
Images of custom-made devices and critical steps. (A) Plexiglass stage used to immobilize and orient the heart for isolation of coronary vessels. Dye was delivered through the long needle piercing the rubber septum of the ‘Y’ junction (circled) and extending into the flanged lip of the aortic cannula. During the surgery cardioplege solution was delivered to the heart to stop the contractions. (B) The isolated section of the LAD (yellow arrow) between the top (proximal) and bottom (distal) sutures. A close-up of a microcannula is shown at the right. (C) Left: a close-up image of an isolated segment of the coronary artery. Right: a custom-made sleeve with a curved window and a plunger with electrodes for contacting the back of the heart. Four fiber optic light guides are shown, two to excite NADH and two to excite either RH237 or Fluo-4AM. The lens of the optical mapping system is also shown.
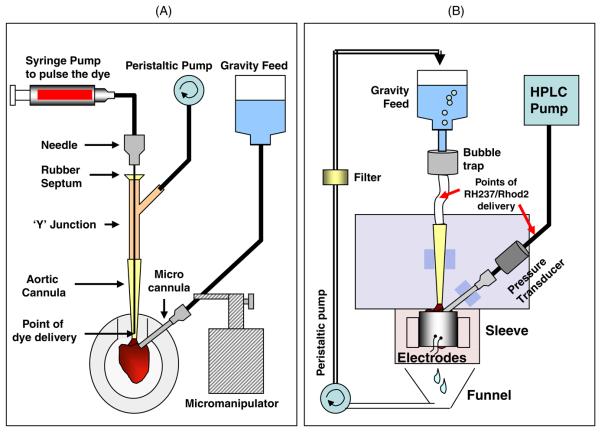
Figure 3.
Main components of the perfusion system. Cartoons that illustrate the main components of the perfusion apparatus. (A) Perfusion system used while cannulating the heart. (B) Perfusion system used while optically mapping the heart. Additional details are provided in the text.
Step 2. Positioning of the heart and visualization of the vessel of interest
The platform was tilted at a 15° angle to allow perfusate to drain into a tray. A custom elastomer mold was made to hold the heart in place. The mold was created by mixing a resin with a hardener (Sylgard 184 silicone, Dow Corning) and adding the mixture to a 60 mm Petri dish. A plastic tube similar in size to the heart (~12 mm) was placed in the Petri dish to create a mold. The aortic cannula was held on the platform by pressing it into a small piece of stiff tubing that was split lengthwise and bolted to the platform. The heart was oriented with the left ventricle facing up and any remaining tissue around the aorta was cut away.
To visualize the LCA and the LAD, the flow of cardioplege solution was briefly interrupted and a 200–600 μL pulse of concentrated phenol red dye was delivered as close to the coronary ostia as possible. This was accomplished by inserting a 90 mm long 20 gauge needle into the end of the aortic cannula through a rubber septum located above a Y junction taken from standard intravenous tubing (figure 2(A)). An infusion pump (Harvard Apparatus, Model 975) was used to pulse the dye (12 cm3 min−1). It was activated by a foot pedal to visualize the LCA while, at the same time, separating tissue from around the LCA. The peristaltic pump that delivered cardioplege solution to the aorta was also controlled by a foot pedal. After the LCA was identified, cardioplege flow was restored and tissue was carefully separated around the artery from the coronary ostium to the LAD. At this point, dye was pulsed repeatedly to fully visualize the branching of the artery. A section of vessel below the septal branch (when present) and just above LAD was chosen and tissue was separated from the vessel to isolate the segment. Two sutures (size 6-0) were loosely tied around this segment using a curved suture needle (size 00), leaving a 1 to 2 mm section of vessel between them (figure 2(B)). The total time to complete step #2 was typically 15 min.
Step 3. Microcannulation
Before microcannulation the integrity of the vessel was ensured with a few final pulses of dye. Retrograde flow of cardioplege was then increased to 4 mL min−1 and a small incision was made in the segment of artery isolated in step 2 using a 33.0 gauge needle. The incision was gently enlarged to accommodate the microcannula, which was selected from two available sizes, depending on the diameter of the isolated segment of artery.
Microcannulae were constructed using a syringe needle, short sections of polyethylene tubing and a short section of small diameter polyimide tubing. The polyimide tubing was used to form a ‘nib’ at the end of a microcannula, as shown in figure 2(B). The nib of a small microcannula was a 5 mm section of 127 μm ID polyimide tube (Small Parts, Inc). This was inserted into a flexible 60 mm section of polyethylene tubing having an ID of 280 μm (PE-10, Clay Adams). This was then fitted over a blunted 32 gauge needle (figure 2(B)). The nib of a large microcannula was a 5 mm section of 142 μm ID polyimide tube (Small Parts, Inc), which was inserted into a 3 mm length of 380 μm ID tubing (PE-20 Clay Adams). This was then inserted into 60 mm section of 860 μm ID polyethylene tubing (PE-90 Clay Adams), which was then fitted over a blunted 19 gauge needle. We have specified the type and size of tubing because we found that other tubing combinations did not work as there is a balance between the nib's rigidity and the flexibility of the polyethylene tubing. To fit the nib into the polyethylene tubing, the receiving end of the tube was stretched with a pair of fine tipped tweezers. Loctite™ superglue gel was used to seal all tubing junctions.
An adjustable arm attached to a micromanipulator was used to position a microcannula above the isolated segment of artery. The microcannula was then inserted into the vessel using small forceps. To prevent air from entering the vessel during the insertion procedure, retrograde-perfusion to the aorta was maintained while cardioplege solution flowed through the microcannula under constant pressure (gravity-feed). The distal suture was then tightened around the microcannula (figure 2(C)). The proximal loop was then tightened to fully occlude the upstream portion of the vessel. That suture was also tied around the microcannula to keep the nib oriented in the same direction as the vessel. It was also tied around the end of the aortic cannula to stabilize and minimize twisting or pivoting of the microcannula.
After all sutures were secured, flow was interrupted and the microcannulation area was dried using a cotton swap and gentle air flow. A drop of super glue was placed on top of the sutures and along the length of the microcannula to keep it oriented in the vessel. Any excess glue was removed and the glue was air-dried. The total time to complete step #3 was typically 10 min.
Step 4. Placement of the heart for imaging
Immediately after microcannulation, the heart was transferred to a specially designed sleeve that was mounted in front of an optical imaging system (figure 2(C), right panel and figure 3(B)). The aortic cannula was connected to a constant pressure (60 mmHg, gravity feed) perfusion system containing Tyrode's solution. The microcannula was attached to a constant flow perfusion system containing Tyrode's solution. In that system an HPLC pump delivered solution at 2 mL min−1. A three-way valve was located before each cannula (aorta and microcannula) so that drugs or fluorescent dye could be delivered to the heart.
In studies where it was important to minimize contractile motion, Blebbistatin (Fedorov et al 2007) (10 μM) was added to the aorta and microcannula solution reservoirs. To image transmembrane potential, the heart was stained by bolus injections (5 ml) of a 20 μM solution of RH237 delivered to each cannula after the heart was positioned for optical mapping. To image intracellular calcium, the heart was stained before the microcannulation procedure by recirculating a 10 μM solution of Fluo-4AM (Molecular Probes) for 30 min. It is possible that loading Fluo-4AM before microcannulation could result in a reduction of intracellular calcium signal-to-noise ratios.
The specially designed sleeve consisted of a clear curved front panel having approximately the same curvature as the surface of the heart. Two electrodes were positioned on the internal surface of the sleeve. A syringe plunger was located on the back of the sleeve and four electrodes were mounted on it (figure 2(C), right panel). The plunger could be extended to contact the surface of the heart and retracted to remove the heart from the sleeve.
Perfusion pressures and flow rate
Microcannulae with smaller nibs were easier to insert into a vessel; however, much higher pressures were required to push solution through them. The nib of the microcannula provided the largest resistance to flow and had the largest pressure drop. Two syringe pumps (Harvard Apparatus, Model 975) and three different peristaltic pumps (Harvard Apparatus, Model 1210, Watson Marlow 101U, Master Flex 77200-62) were unable to generate pressures that would deliver sufficient and stable flow through a microcannula. Our best results were achieved using a high-pressure low-flow piston pump (High Performance Liquid Chromatography Series I, Scientific Systems Inc). This pump delivered solution through all microcannulae at constant flowrates. The flow rate of the pump is adjustable in 0.01 mL increments from 10.00 mL min−1 to 0.01 mL min−1, providing a wide range of physiologically relevant flow rates.
Imaging to record changes in NADH, intracellular calcium and/or electrical activity
Our dual camera optical mapping system is comprised of two CCD cameras (Andor IXON DV860s) fitted with a dual port adapter (Andor CSU Adapter Dual Cam) containing a dichroic mirror (550 nm) and lenses (Cosmicar 6 mm, F/1.0 with +27 close-up lenses). After staining with either RH237 (figure 5(B)) or Fluo-4AM (data not shown), the epicardium was imaged at a spatial resolution of approximately 85 μm (128 × 128 pixels). Illumination was provided from one of two sets of LEDs (LumiLEDs). To excite RH237, one set had a peak wavelength of 530 nm and a spectral half-width of 35 nm (i.e. 530 ± 17.5 nm). To excite Fluo-4AM, the other set had a peak wavelength of 505 nm and a spectral half-width of 30 nm (i.e. 505 ± 15 nm) and light was band-pass filtered (500 ± 10 nm). RH237 fluorescence was long-pass filtered at 680 nm and raw signal-to-noise ratios were typically 8.0 ± 0.7. Fluo-4AM fluorescence was band-pass filtered at 540 ± 40 nm and raw signal-to-noise ratios were typically 5.0 ± 0.5. Endogenous NADH fluorescence was acquired by illuminating the epicardium with ultraviolet light (<360 nm) using a 100 W mercury lamp (Zeiss HBO100 W/2). The emitted light was band-pass filtered at 475 ± 25 nm and raw signal-to-noise ratios were typically 25 ± 2.0. At the end of each experiment green dye was injected into the microcannula to fully reveal the tissue bed perfused by the microcannula (figure 1(C)).
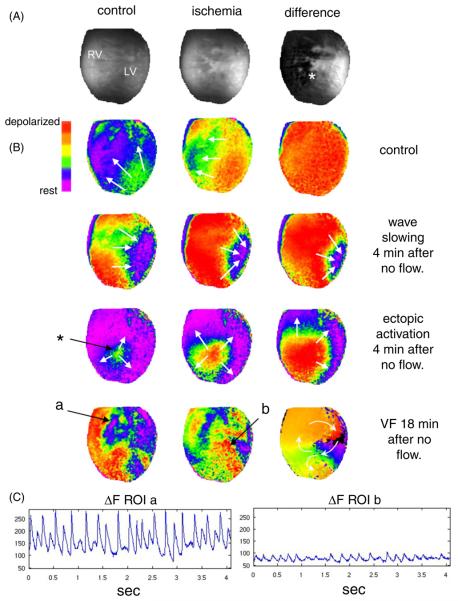
Figure 5.
Microcannulation and dual optical mapping of rat hearts. (A) Images of NADH fluorescence before ischemia (control) and after ischemia was induced by stopping flow to the microcannula. The difference between the control image and the ischemia image is shown on the right. (B) Wavefronts obtained by optical mapping of epicardial transmembrane potential using RH237. Row 1: an activation wavefront during normal microcannula flow (2 mL min−1). Row 2: an activation wavefront after 4 minutes of ischemia (no microcannula flow). Row 3: an ectopic activation wavefront after 4 min of ischemia. Row 4: ventricular fibrillation after 18 min of ischemia. (C) Average RH237 fluorescence (after background subtraction) from a small area in the nonischemic region (a) and in the ischemic region (b).
Example of studies enabled by microcannulation
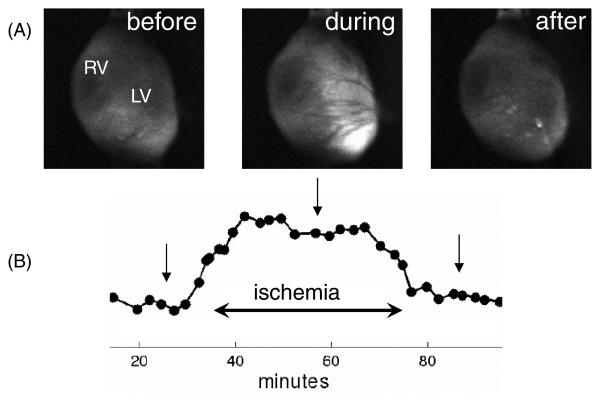
Data from typical optical mapping studies using the microcannulation technique to induce controlled regional ischemia in a rat heart, as described in this paper, are shown in figures 4 and 5. Exemplary NADH data from a typical study are shown in figure 4. Temporal changes of NADH fluorescence before (microcannula flow of 2 mL min−1), during (microcannula flow of 0 mL min−1) and after ischemia (microcannula flow of 2 mL min−1) are shown in figure 4(A). The average level of NADH fluorescence for the LV is plotted in figure 4(B). Average NADH fluorescence typically peaked within 12-15 min of stopping flow to the microcannula and returned to pre-ischemic levels in less than 12 min of resumption of flow to the microcannula.
Figure 4.
Control of local ischemia using microcannulation. (A) Images of NADH fluorescence from the epicardium of the heart before, during and after an ischemic episode caused by limiting flow through the microcannula. (B) Average NADH fluorescence increased and plateaued during a 40 min ischemic episode induced by stopping flow of perfusate to the microcannula. Arrows indicate timing of the snapshots above.
Data from a typical optical mapping study using dual imaging of NADH and RH237 are shown in figure 5. Epicardial fluorescence of NADH during control flow (2 mL min−1) and no flow to the microcannula is shown in figure 5(A). The last image in figure 5(A) shows the rise in NADH fluorescence from control flow to no flow to the microcannula, clearly revealing the epicardial region of acute regional ischemia (white). Corresponding patterns of activation wavefronts, as revealed by the fluorescence of RH237, during control flow and acute regional ischemia are shown in figure 5(B). The first row shows uniform propagation of a typical wavefront during control flow to the microcannula, indicating that the microcannulation procedure itself does not affect epicardial conduction velocity. The second row shows a typical wavefront four minutes after stopping flow to the microcannula. The concave shape of the wavefront within the region of ischemia (white area in the last image in figure 5(A)) reveals a significant reduction in local conduction velocity induced by stopping flow to the microcannula. The third row shows the activation sequence of an early ectopic beat that was recorded four minutes after stopping flow to the microcannula. The site of initial activation of this beat (denoted by the asterisk) was traceable to the boundary of the ischemic region (figure 5(A)). Subsequent ectopic beats caused a fibrillatory-like state within the ischemic area, which spread through the rest of the epicardium. Eighteen minutes after stopping flow to the microcannula, fibrillation was sustained and activation patterns were rapidly changing, as shown in the fourth row of figure 5(B). The last image in this row is an activation time map that illustrates figure-of-eight reentry that was situated within the ischemic area. Average RH237 fluorescence signals from two regions of interest (a: nonischemic, and b: ischemic) during fibrillation (figure 5(B), last row) are shown in figure 5(C). The amplitude of the signal from the ischemic region is much less than that of the signal from the nonischemic region, indicating a significant reduction in the number of cells contributing to local action potentials, but certainly enough to support propagation and reentry within the ischemic tissue (figure 5(B), last row).
Discussion
Inserting a cannula into a major coronary artery may appear to be a straightforward task; however, the actual implementation is not straightforward. Once accomplished, the combination of microcannulation with optical mapping is a very powerful tool, as illustrated in figure 5. In consideration of this, we believe that a detailed description of the main steps leading to our successful implementation of this technique could be helpful for other laboratories. The four challenges included:
Locating the vessel
To identify the coronary segment to be cannulated it was necessary to deliver periodic high concentrations of dye as close as possible to the ostia of the aorta. This prevented a bolus of dye from being diluted before entering the ostium of the LCA, thereby minimizing the amount of dye injected to ensure minimal staining of the surrounding myocardial tissue. Simultaneous separation of the tissue from the artery while viewing the heart under the microscope and manipulating the heart with a pair of tweezers demanded that the main perfusion flow and dye pulses both be controlled by a foot pedal.
Orienting the microcannula
The second challenge was to design a system that would position the cannula along the artery segment to be cannulated. This allowed the cannula to be quickly inserted into the artery after the incision. A clamp held the cannula on a flexible arm attached to a micromanipulator mounted on a moveable stand. This provided both macro and micro adjustments for easy positioning and insertion of the microcannula.
Pump selection
Delivery of solution through the microcannula required a pump that could provide high pressure and a range of selectable flow rates. Based on this, gravity perfusion of the microcannula was eliminated. Initially, we used a syringe pump to push perfusate through the microcannula. However, the pumping mechanism would skip, or simply stop, due to the high pressure drop across the nib, causing fluctuations in the flow rate. With a peristaltic pump, the flow rate was unstable and oscillated drastically. Even worse, if resistance to flow exceeded a threshold then solution would not flow. The HPLC pump was the only pump that would generate the pressure required to maintain a preset flow rate through the microcannula.
Immobilizing the heart for imaging
To obtain reliable optical signals without motion artifacts it is necessary to immobilize the heart (Girouard et al 1996, Qin et al 2003). This also facilitates the placement of multiple electrodes on the epicardium. For mechanical immobolization, we built a custom-made sleeve (figure 2(C)). The challenge was to immobilize the heart against a ‘window’, through which optical signals could be collected, and to do it without restricting perfusion by unnecessarily compressing the epicardium. Our design uses a sleeve with a curved front window and flat plunger in the back. Electrodes are mounted on the front window and multiple electrodes are mounted on the plunger. In other experiments, blebbistatin was used for pharmacological immobilization and has been shown to be a promising alternative to other electromechanical uncouplers (Fedorov et al 2007).
Summary
The described microcannulation technique offers two main advantages over that of clamping or ligating the LAD. First, the flow rate can be adjusted to create conditions of lowflow ischemia or low-flow reperfusion. By imaging NADH fluorescence the degree of ischemia can be monitored within hypoperfused regions. Secondly, the flow rate can be adjusted remotely without mechanically disturbing the heart, allowing the initial sequences of reperfusion tachyarrythmias to be imaged (figure 5(B)). Together, the ability to control the amount of flow and continuously record events from the epicardial surface allows one to address a variety of pathophysiological conditions, including regional ischemia, reperfusion, stunning, preconditioning, low-flow ischemia or local drug application. The developed approach holds a promise of facilitating studies in these directions, thereby contributing to our understanding of the mechanisms behind lethal cardiac arrhythmias.
Acknowledgments
Financial support by the American Heart Association (BGIA#0665377U to MWK) and the NIH (HL076722 to NS) is gratefully acknowledged.
References
- Arutunyan A, Swift LM, Sarvazyan N. Initiation and propagation of ectopic waves: insights from an in vitro model of ischemia-reperfusion injury. Am. J. Physiol. Heart Circ. Physiol. 2002;283:H741–9. doi: 10.1152/ajpheart.00096.2002. [DOI] [PMC free article] [PubMed] [Google Scholar]
- Buckingham TA, Devine JE, Redd RM, Kennedy HL. Reperfusion arrhythmias during coronary reperfusion therapy in man: clinical and angiographic correlations. Chest. 1986;90:346–51. doi: 10.1378/chest.90.3.346. [DOI] [PubMed] [Google Scholar]
- Fedorov VV, et al. Application of blebbistatin as an excitation-contraction uncoupler for electrophysiologic study of rat and rabbit hearts. Heart Rhythm. 2007;4:619–26. doi: 10.1016/j.hrthm.2006.12.047. [DOI] [PubMed] [Google Scholar]
- Girouard SD, Laurita KR, Rosenbaum DS. Unique properties of cardiac action potentials recorded with voltage-sensitive dyes. J. Cardiovasc. Electrophysiol. 1996;7:1024–38. doi: 10.1111/j.1540-8167.1996.tb00478.x. [DOI] [PubMed] [Google Scholar]
- Hearse DJ, Yellon DM. The ‘border zone’ in evolving myocardial infarction: controversy or confusion? Am. J. Cardiol. 1981;47:1321–34. doi: 10.1016/0002-9149(81)90266-6. [DOI] [PubMed] [Google Scholar]
- Liu YH, Yang XP, Nass O, Sabbah HN, Peterson E, Carretero OA. Chronic heart failure induced by coronary artery ligation in Lewis inbred rats. Am. J. Physiol. 1997;272:H722–7. doi: 10.1152/ajpheart.1997.272.2.H722. [DOI] [PubMed] [Google Scholar]
- Podesser B, et al. Epicardial branches of the coronary arteries and their distribution in the rabbit heart: the rabbit heart as a model of regional ischemia. Anat. Rec. 1997;247:521–7. doi: 10.1002/(SICI)1097-0185(199704)247:4<521::AID-AR11>3.0.CO;2-R. [DOI] [PubMed] [Google Scholar]
- Pogwizd SM, Corr PB. Electrophysiologic mechanisms underlying arrhythmias due to reperfusion of ischemic myocardium. Circulation. 1987;76:404–26. doi: 10.1161/01.cir.76.2.404. [DOI] [PubMed] [Google Scholar]
- Qin H, Kay MW, Chattipakorn N, Redden DT, Ideker RE, Rogers JM. Effects of heart isolation, voltage-sensitive dye, and electromechanical uncoupling agents on ventricular fibrillation. Am. J. Physiol. Heart Circ. Physiol. 2003;284:H1818–26. doi: 10.1152/ajpheart.00923.2002. [DOI] [PubMed] [Google Scholar]
- Vetterlein F, et al. Extent of damage in ischemic, nonreperfused, and reperfused myocardium of anesthetized rats. Am. J. Physiol. Heart Circ. Physiol. 2003;285:H755–65. doi: 10.1152/ajpheart.00269.2002. [DOI] [PubMed] [Google Scholar]


