

Abstract
Vaults are naturally occurring ribonucleoprotein particles with an enormous interior volume, large enough to encapsulate hundreds of proteins. They are highly conserved and are present in nearly all eukaryotic cells ranging from 104 to 107 particles per cell. Recombinant vaults can be produced in vitro and engineered to allow cell targeting and protein packaging. These nanometer size particles have many desirable characteristics that may give them advantages for use as a drug delivery vehicles. Using photoactivatable green fluorescent protein (PAGFP) labeled vaults, we demonstrate that the particles rapidly diffuse throughout the cytoplasm following single pixel photoactivation in live cells. Their in vivo movement remained relatively unchanged despite exposure to a variety of cellular stresses, suggesting that vaults are largely unconstrained in the cytoplasm. Fluorescence resonance energy transfer (FRET) was observed from polyethylene glycol (PEG) fused hybrid cells that expressed either CFP or YFP labeled vaults, indicating that vaults can exchange major vault protein (MVP) subunits in vivo. Investigation into the mechanism of this exchange in vitro using recombinant vaults demonstrated that they were capable of rapidly separating at the particle waist and reassembling back into whole vaults, supporting a half vault exchange mechanism. This data suggests a means whereby vaults can functionally interact with their cellular environment and deliver materials packaged within their interior.
Keywords: vault dynamics, half vault exchange, major vault protein, ribonucleoprotein, vault, nanoparticles, drug delivery vehicle
Introduction
The use of nanoparticles as drug delivery systems that can specifically target cancer cells and improve the bioavailability of drugs is an area of research being actively pursued. Their small size enables the enclosed therapeutic agents (e.g., drugs, proteins, or nucleic acids) to be readily delivered to tissues. Several nanoparticles have gained FDA-approval as new therapeutics, including Liposomal doxorubicin and Abraxane.1 The majority of these nanostructures are made of biodegradable polymers, such as hydrogels, micelles/liposomes, and dendrimers.2 However, numerous barriers exist that have limited the effectiveness of these particles including targeting, biocompatibility, cost-effective manufacturing, capacity, stability, and the ability to control the release of encapsulated therapies. Vaults represent a novel drug delivery system that may have the characteristics to overcome these limitations.
Native vaults are barrel-shaped 13 MDa ribonucleoprotein particles with overall dimensions of 72 X 41 X 41 nm3.3, 4 The exterior shell is extremely thin (≤ 2 nm), and is formed from 78 – 96 copies of the major vault protein (MVP).3, 5, 6 The interior volume of vaults has been estimated to be approximately 5 × 10⁴ nm3, large enough to encapsulate hundreds of proteins.7 Naturally occurring vault nanoparticles are formed from multiple copies of three different proteins: MVP,5 vault poly(ADPribose) polymerase (VPARP),8 telomerase-associated protein 1 (TEP1),9 and a small untranslated RNA (vRNA, 86 – 141 bases in length).8 Vaults are highly conserved in nearly all eukaryotic organisms, and present at 104 to 107 particles per cell.10 Despite their cellular abundance, vault function remains elusive although they have been linked to many cellular processes- including the innate immune response, multidrug resistance in cancer cells, multifaceted signaling pathways, and intracellular transport.11
MVP encodes all of the information for vault particle assembly and formation of the vault shell. Using a baculovirus expression system that expresses MVP in Sf9 insect cells, which do not contain endogenous vaults, recombinant vault particles can be purified in large quantities. These recombinant vaults are virtually identical in structure to native vault particles and are stable over a wide range of pH and temperatures.12–14 By modification of the MVP through the addition of peptides onto the N- and/or C- termini these recombinant vaults can be given new functions. For example, the addition of a cysteine rich peptide (CP) to the MVP N-terminus, led to increased stability of the recombinant vault particles.15 Whereas addition of the 55 aa encoding epidermal growth factor (EGF) onto the MVP C-terminus, results in vault particles with EGF located externally at both ends of the particles, allowing them to bind to and activate EGF receptors in A431 cells, indicating that vaults can be targeted to specific cell surface markers.16 A variety of non-vault associated proteins have been packaged inside the recombinant vault particles by fusing the heterologous protein to a 17 kDa domain derived from VPARP.17–20 This packaging domain was identified in a yeast two-hybrid screen where MVP was the bait and the smallest interacting VPARP clone encoded a 162 amino acid sequence found at the C-terminus of the full-length VPARP protein.8, 21 We called this region of VPARP the mINT domain (because it was the minimal region responsible for INTeraction of VPARP with MVP). Numerous proteins have been fused onto the N-terminus of mINT including luciferase, green fluorescence protein (GFP), mCherry fluorescence protein, adenovirus protein VI, and the Chlamydia muridium outer membrane protein (MOMP).17–20 When packaged into recombinant vaults these proteins retain their native properties.17–20 Recombinant vault nanoparticles have thus far been engineered to package large proteins and polymers,16–20, 22, 23 to penetrate the cell membrane,17, 19, 20 to escape from the endosome,17, 20 to be reversibly cross-linked in an attempt to control opening and closing,24 to bind to specific cell surface receptors,16 and are biocompatible.19
The current study was designed to provide a more comprehensive analysis of vault dynamics both as cytoplasmic nanoparticles as well as highly dynamic nanostructures. We initially investigated the in vivo mobility of vaults in mammalian cells. Vaults fused with a photoactivatable green fluorescent protein (PAGFP) rapidly diffuse in the cytoplasm and remained relatively unchanged even when cells were pre-treated under various conditions, suggesting vaults are largely unconstrained cytoplasmic nanoparticles. Fluorescence resonance energy transfer (FRET) analysis of two stable cell lines that express either CFP-MVP or YFP-MVP vaults, show a distinct FRET signal when fused with polyethylene glycol (PEG). This indicates that the CFP-MVP and the YFP-MVP were reassembled into the same vault, consistent with an exchange of their MVP subunits in vivo. Results from three independent sets of in vitro experiments (immuno-pulldown (IP) assays, transmission electron microscopy (TEM), and small-angle X-ray scattering (SAXS) analysis) all support a model where the mechanism of MVP subunit exchange is through half-vaults. This exchange appears to be rapid and suggests a mechanism for vault breathing and a way for the particle to functionally interact with the cellular environment. The information provided here will not only assist researchers in further investigations of vault function but also suggest a means whereby vaults could deliver their contents as emerging drug delivery vehicles.
Results and Discussion
Expression and characterization of fluorescent labeled vaults in mammalian U2OS cells
To examine vault dynamics in living cells, we analyzed a number of transient and stably transfected U2OS cell lines that express rat MVP fused to one of the following green fluorescent protein variants: PAGFP, CFP, or YFP. These tags were attached to either the N- or C- terminus of MVP under the control of the CMV promoter. When a GFP protein was fused to the N-terminus of MVP, vaults assembled with the GFP packaged into the inside of the nanoparticle at the particle waist.3, 25 When GFP was fused to the C-terminus, the vaults still assembled but the additional protein was localized on the outside of the nanoparticle at the top and bottom.16, 26 There was no difference in the observed subcellular localization of fluorescently tagged vaults compared with endogenous vaults, suggesting that the structural integrity of the expressed vaults was not compromised even though each newly formed vault nanoparticle contained an additional 80 extra fluorescent tags at the waist or 40 extra fluorescent tags at each end of the vault. Furthermore, cell fractionation indicated that the vast majority of MVP was assembled into nanoparticles that pelleted at 100,000 ×g as expected (Fig. 1).
Figure 1. Characterization of vaults produced from MVP fused at the N-terminus (N) or C-terminus (C) with PAGFP, expressed in U2OS cells.
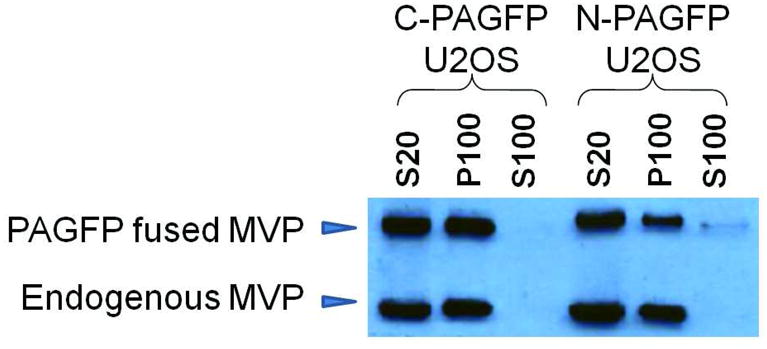
A western blot of subcellular fractions derived from transiently transfected U2OS cells. S20: low speed (20,000 ×g) supernatant; S100: high-speed (100,000 ×g) supernatant; P100: high-speed (100,000 ×g) pellet. Arrowheads indicate endogenous MVP (lower bands) and N- or C- terminal PAGFP fused MVP (upper bands). Note, the reduced intensity of the bands seen in the N-PAGFP P100 sample was due to a variation in sample loading.
PAGFP labeled vaults are evenly distributed in U2OS cytoplasm
To examine vault movements in live cells, a field of cells expressing the PAGFP vaults was photoactivated. As seen in Fig. 2 (top), photoactivation of a broad field with a 405 nm laser dramatically increased the fluorescence under 488 nm excitation in PAGFP-vault-expressing U2OS cells. Two significant features were observed from these photoactivated cells. First, U2OS cells expressing PAGFP vaults showed punctate fluorescence that was homogeneously distributed throughout the cytoplasm, consistent with previous observations,25–27 and provided further support that PAGFP-MVP’s were assembled into vault nanoparticles as demonstrated by sub-cellular fractionation in Fig. 1. Second, as previously seen, vaults were completely excluded from the nucleus.25–27
Figure 2. Photoactivation and imaging of PAGFP vaults in vivo.

(Top) U2OS cells (DIC, A) expressing PAGFP vaults were imaged with a 488 nm laser before (B) and after (C) irradiation of the field with a 405-nm laser. One cell on the lower left corner was not photoactivated because it did not express the PAGFP vaults. (Middle) A time lapse of a U2OS cell expressing PAGFP vaults was imaged before (0 s), and ~0.1 s, 15 s, 30 s, and 60 s after a single pixel 405 nm laser photoactivation. (Bottom) U2OS cells (DIC, left) expressing PAGFP vaults were imaged 20 min after irradiation (right) by 405 nm laser at the indicated region. Scale bars in all figures represent 20 μm.
To study vault movement following photoactivation, a single pixel was photoactivated with a 405 nm laser (100% power), followed by time lapse imaging over a period of 1 minute (total of 36 frames/min) (Fig. 2, middle). The images showed a fast rate of fluorescent PAGFP vaults movement throughout the cytoplasm of U2OS cells. In addition, there were no apparent stationary fluorescent puncta observed, suggesting that the intracellular PAGFP vaults were not stably associated with immobile cellular elements. When a single cell within a cluster of U2OS cells with membrane contacts was selectively irradiated in a small region of one cell, the photoactivated vaults from that region rapidly diffused throughout the whole cytoplasm within 60 sec (Fig. 2, bottom). These photoactivated PAGFP vaults remained within the original cell and no elevated fluorescence was detected in adjacent cells even after 20 minutes, demonstrating that there was no vault trafficking across cell membranes.
Vault movements were examined under different cellular conditions by measuring fluorescent recovery after photobleaching (FRAP). Cells expressing PAGFP were initially photoactivated and then photobleached in a 2 μm swath across the cells. The photobleached region was completely replaced by neighboring photoactivated fluorescent vaults in less than 1 s (data not shown), consistent with previous observations.25–27 The recovery kinetics of vaults under optimal conditions was best fitted by an effective diffusion coefficient of approximately 3.7 μm2/s. This value is slightly higher than the value that was previously reported to be 2 μm2/s in SW1573 cells.26 This discrepancy was most likely caused by differences in cytoarchitecture and physical properties of these two cell types.28 We also re-analyzed the data from Fig.2 middle panel (time-lapse after photoactivation) to extract a diffusion rate (see methods). The effective diffusion rate we calculated was 4.86 μm2/sec, a value that fit well with the value extracted from the FRAP data.
The FRAP experiments were repeated under different conditions of cellular stress and the results summarized in Fig. 3. Regardless of how the cells were treated prior to the measurements (serum starvation, microtubule modification, ATP depletion, or oxidative stress), the recovery rates of the fluorescent labeled vaults were unchanged. Similar results were observed when PAGFP was fused to either the N- or C- terminus of MVP subunits (Fig. 3). We concluded that there were no appreciable interactions between vaults and cytoskeletal elements based on the effective diffusion rates of PAGFP vaults in vivo. However, this conclusion was not entirely consistent with numerous studies of vault cellular distribution that have shown co-localization of vaults with various cytoskeletal elements.25–27, 29, 30 This discrepancy could be due to differences in cell type or may reflect the transient nature of vault interaction with these cellular elements.
Figure 3. Effective diffusion rates of PAGFP vaults in U2OS cells under various conditions.

U2OS cells expressing PAGFP-MVP were treated under the indicated conditions as described in Materials and Methods. The entire field was first irradiated with 100 % 405 nm laser power multiple times to insure the maximal photoactivation of PAGFP vaults. FRAP experiments were then performed by bleaching a strip of cytoplasm (2 μm across the whole cell) by a short bleach pulse (~ 0.2 s) at 100 % 488nm laser power and the reappearance of fluorescent particles was monitored at 0.2 s intervals. The parameter t1/2 (the time required for the bleach spot to recover half of its initial intensity) was best fitted with Leica software. The effective diffusion constant D was calculated from the following equation: where w is the width of the swath (2 μm). P-values were calculated using the TTEST function found in Microsoft Excel 2007. The only significant differences worth noting were those seen at the lower temperature (22 °C), likely due to increased viscosity at lower temperatures resulting in lowered overall diffusion rates.
FRET indicated that vaults exchange their MVP subunits IN VIVO
Previous studies have observed that when GFP is fused to MVP and expressed in mammalian cells it appears to be incorporated into all of the pre-existing vault nanoparticles in the transfected cell within 24 h.25 This suggested that vault components may equilibrate or that particles were constantly being repaired or turned over rapidly. However, endogenous vault turnover is slow and appears to occur with cell division.31 In order to further investigate whether vaults can exchange MVP subunits in live cells, CFP or YFP was engineered onto the N-terminus of MVP, resulting in the expression of recombinant vaults with either CFP or YFP assembled along the vault waist. Three different stable cell lines were produced; one expressed only the CFP-vaults, the second only the YFP-vaults and the third expressed both the CFP- and YFP-labeled vaults. Negative controls showed that neither CFP vaults nor YFP vaults alone generated FRET signals (data not shown). Cells expressing both CFP and YFP labeled vaults exhibited approximately 40% FRET efficiency, indicating that both CFP and YFP tags were assembled in the same vault as FRET can only occur when the distance between the chromophores are less than ~ 9 nm (Fig. 4C). The remaining “60%” is energy that the donor emits (i.e. fluorescently, without passing it to an acceptor). To study whether vaults exchanged their subunits in vivo, we co-cultured mixtures of the CFP-MVP-only and YFP-MVP-only cell lines. These mixtures did not display FRET signals. However, when neighboring cells were fused with PEG, resulting in the mixing of both of their cellular contents (including their fluorescent vaults), FRET (~45% efficiency) was observed 2–4 hr after fusion (Fig. 4A & B). The efficiency of FRET signal detection is similar in fused cells and cells expressing both CFP- and YFP-vaults (Fig. 4C).
Figure 4. Analysis of PEG-fused U2OS cells expressing tagged vaults.

(A) A schematic representation of the FRET experimental design. CFP (the cyan cell) or YFP (the yellow cell) was engineered onto the N-terminus of MVP, resulting in the expression of recombinant vaults with CFP or YFP assembled along the vault waist. The two cells were then fused by PEG (2–4 h), resulting in a mixing of the cellular contents of neighboring cells including their fluorescent vaults. (B) An illustration of FRET calculation on a hybrid U2OS cell (identified by the presence of multiple nuclei). Intensities of YFP and CFP emission were captured simultaneously using the MetaFluor software. YFP was gradually bleached by exciting the field of view at the excitation wavelength for YFP. Then as shown by the traces, CFP and YFP emission wavelengths were simultaneously recorded. As the YFP (donor) emission decreases the CFP (acceptor) emission increases – a characteristic of FRET. (C) Summary of FRET efficiency from various CFP/YFP expressing U2OS cells and of various PEG fusions of CFP or YFP expressing U2OS cells. Cells expressing CFP or YFP vaults alone exhibited no FRET (Data not shown).
The time required before observing FRET was considerably less than the time required for new MVP protein to be synthesized and assembled into vaults, thus new protein synthesis could not account for these signals. Based on the crystal and cryoEM structures of vaults, the N-terminal CFP and YFP tags need to co-exist in the same vault in order to be close enough to produce a FRET signal, indicating that vaults exchanged their MVP subunits in vivo. However, this type of analysis does not differentiate between the mechanism of vault subunit exchange which could result from half-vault exchange or exchange of single or multiple MVP subunits, because the distance between the N-terminus of vaults can either be 0.8 nm (two opposing MVPs from two opposing half vaults) or 2.8 nm (two side-by-side MVPs of the same half vault), both are well within the required 9 nm distance for FRET.6
Previous studies have shown that fully assembled recombinant vaults are able to package exogenously added proteins into the particle lumen, including the naturally-occurring vault content proteins, VPARP and TEP1, and heterologous INT fusion proteins.16–20, 22, 23, 32 Two models were proposed to explain packaging of INT-tagged proteins into vaults. In one model MVP subunits or groups of MVPs (vault petals) could transiently open at the particle waist without significantly altering the particle structure. Support for this model was derived from TEM freeze-etch images of vaults that demonstrated an 8-fold vault petal sub-structure and the observation of partially-opened vaults observed in cryoEM.5, 7 In the second model, vaults were hypothesized to separate transiently at the particle waist into two half vaults allowing contents to enter the inside of the particle prior to their re-assembly. Support for this model included the observation of vault halves in TEM and cryoEM preparations and the generation of half vaults at low pH.24 The second model implies a major change in particle structure (the half vault) and further suggests that the re-assembled vault need not be composed from the original separated particle. Both models could explain the subunit exchange indicated by the FRET data. In order to distinguish between these mechanisms of subunit exchange we carried out three types of in vitro experiments: first we analyzed vaults in solution by small-angle X-ray scattering (SAXS), next we used transmission electron microscopy (TEM), and finally we used immuno-pulldown (IP) assays.
Small-angle X-ray scattering indicates the presence of half vaults in solution
Additional structural information about the dynamic nature of vaults in solution was obtained using SAXS. A semi-log plot of scattered intensity (I) vs. the wavevector (q) showed the form factor of an ensemble of vaults in solution (Fig. 5, Inset, solid black line). Intensity at lower q arose from correlated density at larger distances (r) within the molecule and vice versa. The relevant q-range shown in Fig. 5, inset (0.005 – 0.06 Å−1) represented information from length scales 1 μm to 10 nm. For easier representation, the scattering curve using its Fourier inverted form, P(r), which represented the radially averaged distribution of electron density correlations at a separation of r within the object was presented (Fig. 5).
Figure 5. The distance distribution, P(r), of CP-MVP vaults from experiment (— line), computed full-vault (- - - line) and half-vault (···· line) from its crystal structure (Tanaka, et al., 2009), and regression fit from computed full- and half-vault crystal structure (— line).

Inset: The scattering profiles of vaults from experiment, computed full-vault and half-vault from its crystal structure, and regression fit from computed full- and half-vault crystal structure.
We first compared the experimental I vs. q curve with the ideal scattering profiles expected for rigid full (Fig. 5, Inset, dashed line) and half vaults (Fig. 5, Inset, dotted line), computed from recent x-ray crystal structure data.6 The computed curves differed most significantly from each other at q < 0.02 Å−1 due to additional intensity from longer correlated distances when two halves were brought together. This was also reflected in the P(r) plot (Fig. 5) where the normalized probability was much higher at smaller r for half vaults and was dominated by correlations between the two halves for the full-vault. Since vaults in solution are bound to be more dynamic than those in a crystal, it is not surprising that neither a purely full nor half vault structure can explain the experimental scattering pattern. The fact that the experimental I vs. q plot lies between those of the computed full and half vault curves suggests that the reality in solution is neither purely rigid half vaults nor full vaults, but an intermediate state. To best estimate what relative ratio of rigid full and half vault structures could reproduce the experimental curve, we performed multiple regression analyses with an emphasis on quality of fit in the q-range that can distinguish between full and half vault structures, i.e. 0.05 – 0.01 Å−1. The best regression fit was obtained when 46% of the protein mass in solution exists as full vaults and the other 54% as half vaults; that is shown in both plots in Fig. 5 as a solid red line. An intrinsic statistical error of 3% was expected from the regression method. We have similarly fit experimental curves from ten samples with the same concentration of vaults, but at temperatures from 5 to 45 °C. The relative ratio was found to be insensitive to temperature, and on average 49 ± 4% of the protein mass exists as full vaults. We note, however, that the population labeled half vaults does not need to be completely free half vaults in solution. Any dynamic fluctuations between the halves that destroys the regular correlations between halves would result in average scattering data indicative of half vaults. Indeed, TEM results do not reveal the presence of a significant population of free half vaults, which suggested that the SAXS analysis was best explained by a dynamic fluctuation between the two halves of an intact vault.
Although the regression analysis reproduced the I vs. q curves in the q-range of interest, such an interpretation was still limited in scope. This was illustrated by comparing the P(r) curve of the regression fit with the experimental one. Similar to the P(r) for an ellipsoidal shell, we expected the maximum at ~35 nm for the ideal full vault to represent the diameter of the short axis of the shell (i.e. this would represent correlations in the waist region of the vault). Although the overall shape of the experimental curve was recovered, the fitted curve overestimated the correlation at 30 – 35 nm and under-estimates them at longer distances. These data, combined with the fact that even a linear combination of full and half vault structures could not reproduce the experimental curve, indicated that vault structures in solution depart significantly from the x-ray crystal structures.6, 15 The P(r) curves suggest that vaults in solution may be floppy along the waist and this floppiness may add a tail at longer distances that cannot be captured by fitting to crystallographic data for full-vaults in the solid state. Alternatively, correlations between halves of dynamically fluctuating vaults may add probability at longer distances that is not well captured in fits based on crystallographic data.
To determine the possible geometries in solution that can explain the experimental scattering curves, we performed Monte-Carlo reconstruction of relative bead-geometries consistent with the experimental scattering curve. Fig. 6 shows three shape reconstructions for the experimental scattering curve in Fig. 5. The most probable geometry computed from 50 reconstructions (see Methods) was represented by a blue surface and a sample bead structure was super-imposed on the blue surface to show the extent of convergence among reconstructions. A yellow surface created from the X-ray PDB structure was also superimposed for comparison. 6 Panel “A” shows a reconstruction without any symmetry restrictions. This indicates that the shape of vaults in solution loosely resembles a full-vault structure, but is seemingly smaller and has holes along the waist and the heads. The holes at the waist indicate a lack of correlations in this area; a fact that likely arises from the presence of some isolated half vaults and from fluctuations between halves in partly associated vaults.
Figure 6. DAMMIN shape reconstructions of the experimental CP-MVP vaults with different symmetry restrictions.

(A) no symmetry imposed, (B) a C8 symmetry, (C) a C82 symmetry. The blue region represents more than 50% chance of having a bead in them among 50 reconstructed structures. The red beads represent one of the 50 reconstructions, and the black dots correspond to the range of shapes created by superposition of all 50 reconstructions. The yellow envelop is the computed vault structure from X-ray structure overlapping the shape reconstructions.
To test how the reconstructed shape may deviate from geometries that are known from X-ray and cryo-EM data, we computed symmetry-restricted shapes that are still consistent with the experimental curve. 3,6,7,15 The blue surface in panel B shows that enforcing C8 symmetry on the reconstructed shape leads to a half-vault like structure which is consistent in dimensions with the X-ray data, but much floppier and frayed out along the waist. In theory, a full-vault structure, if dominant should be recovered when C8 symmetry is imposed, which we see is not the case in panel B. This result perhaps indicates that fluctuations of the vaults destroy the C8 symmetry on the full vault scale, but the symmetry is preserved within each half vault. To select full-vault like geometries consistent with the experimental curve, we next imposed C82 symmetry. The most probable geometry (blue surface) in panel C indicates that a perfect full-vault-like structure cannot be recovered from the experimental data. When such geometry is imposed, the reconstructed shapes are similar to the unconstrained surface with reduced density around the waist and at the caps.
The above results show that the geometry that best describes the published vault structure was obtained when C8 symmetry was imposed, a geometry that is closer to a half- than a full-vault. The SAXS reconstruction therefore suggests that over 50% of the dynamic species in a vault solution resembles the geometry of a half vault or full vaults with fluctuations at the waist. It should also be pointed out that the experimental conditions used for the SAXS measurements were different from the conditions expected in the cytosol which are often estimated to be 5–10 times the viscosity of water.33, 34 At fixed temperature, the time taken by a particle to diffuse a certain length is directly proportional to the viscosity of the medium. Therefore we expect the higher cytosol viscosity to lengthen the diffusion times of vaults and slow down the rate of exchange and fluctuation by a factor of 5–10.
Visualization of half-vault exchange by TEM
While SAXS allowed us to look at the freedom of full and half vaults in an ensemble averaged manner, it did not allow us to distinguish between half vaults that are fully isolated in solution and those that are merely fluctuating with a partner. To distinguish between these two possibilities, we turned to TEM. TEM has been a valuable tool to study the morphology of vaults since their discovery in 1986. Previously we observed that when purified cpMVPvsvg vaults were incubated with anti-VSV antibodies, the vault nanoparticles were linked together end to end with occasional branching observed to form polymer-like structures (see also Fig. 7A).16 This arrangement indicated that the C-terminal VSVG tags from adjacent vaults linked together by anti-VSV antibodies, resulting in the formation of these branched aggregates. These results also suggested a simple assay to visualize half-vault exchange by mixing cpMVPvsvg vaults with an excess of vaults without the C-terminal tag. We reasoned that if the subunit exchange was through exchange of half vaults, the end-to-end vault linkage might be limited to two vault particles, and long end-to-end lines would not form. Whereas if individual MVP subunits were exchanged between vaults then the C-terminal tags would be present in more of the vault particles and thus lines of vaults would be observed. The architecture of purified cpMVPvsvg vaults alone (Fig. 7A) and in the presence of 5× cpMVP vaults (Fig. 7B) was dramatically modified following the addition of the anti-VSV antibodies. A significant portion of the mixed vaults were observed to form pairs or dimer-like structures (Fig. 7B). These results imply that dimers were formed from half-cpMVPvsvg vaults and half-cpMVP-vaults. Such structures would have only one end with the VSVG tags and thus these ends would interact with anti-VSV antibodies while the other end would be left unbound, resulting in the formation of vault dimers.
Figure 7. Visualization of antibody-vault aggregates using TEM.

Purified cpMVPvsvg vaults, in the absence (A) or the presence (B) of 5-fold excess cpMVP vaults, were incubated with α-VSV antibody. Vaults from the resulting mixtures were applied to carbon-coated copper grids, stained with uranyl acetate, and visualized by TEM.
We consistently observed more side-by-side than end-to-end vault dimers in this experiment. In order to form end-to-end vault dimers, antibodies would have to bind these two vaults symmetrically and rigidly along the long axis of the two vaults. This would require that the VSV epitopes be oriented along this axis. However, these peptides may be oriented differently or they might be flexible. If they are flexible, the binding of these VSV tags by antibodies may not be rigid enough to hold two vault dimers in place in a linear fashion.
Immunoprecipitation supports a half-vault exchange mechanism
As modeled in the cryoEM structure, the VSV tag, fused to the C-terminus of MVP, is located at the caps of the vault and extends outside of the nanoparticle at the caps.16 The specificity and the external accessibility of this 11 amino acid C-terminal epitope tag was further demonstrated using a pull-down assay with an anti-VSV monoclonal antibody bound to beads.16, 18
MVP subunit exchange was analyzed by incubating pre-cleared crude extracts containing C-terminal VSVG tagged vaults (cpMVPvsvg) with similar extracts containing N-terminal T7 tagged vaults (HisT7MVP). Following incubation, the cpMVPvsvg vaults were pulled down using anti-VSV monoclonal antibody and protein G beads. The identity of the proteins attached to the beads was determined by fractionation on SDS-PAGE followed by immunoblotting with either an anti-VSV antibody or an anti-T7 monoclonal antibody (Fig. 8). As expected the cpMVPvsvg vault precipitation was dependent on the presence of the anti-VSV antibody and protein G bead (Fig. 8A, lane 1). In addition, no vaults were detected in the precipitate from precleared extracts of HisT7MVP incubated with the anti-VSV antibody and protein G beads (Fig. 8A, lane 2), confirming that the C-terminal vsvg tag was required to mediate this interaction. When the cpMVPvsvg vaults were mixed with the untagged (HisT7MVP) nanoparticles at two different ratios (1:1 and 1:2.5), we found the presence of both species in the precipitates (Fig. 8A, lane 3 and 4). More HisT7MVP was seen in the pull down from the 1:2.5 mix, suggesting the exchange of MVP subunits was proportional to the amount of HisT7MVP vaults present in the mixture. Previous studies have shown that MVP in crude cell extracts are pre-assembled into vault nanoparticles and that the equilibrium lies in favor of assembly (Fig. 1).12 Therefore these data suggested that the MVP subunits of these preformed vaults were capable of being exchanged.
Figure 8. Western blot analysis of vaults pulled down by α-VSV beads.

(A) Vaults pulled down by α-VSV beads from S20 extracts. Lane 1 and 2 are from bead affinity test of S20 extracts of cpMVPvsvg or HisT7MVP. Lane 3 and 4 are from bead affinity test of cpMVPvsvg and HisT7MVP extracts mixed at 1:1 and 1:2.5. (B) Vaults pulled down by α-VSV beads from purified proteins. Lane 1 and 2 are from bead affinity test of purified cpMVPvsvg or HisT7MVP, respectively. Lane 3 and 4 are from bead affinity test of purified cpMVPvsvg and HisT7MVP mixed at 1:1 and 1:2.5. Lane 5 and 6 are from bead affinity test of cpMVPvsvg and HisT7MVP, supplemented with S20 from sf9 cells (containing no vaults), mixed at 1:1 and 1:2.5 ratios. The immunoblots were probed with either α-VSV (upper bands) or α-MVP (lower bands) antibodies.
To determine whether accessory factors were required or could enhance the exchange rate of MVP subunits we utilized mixtures of purified vaults. Both cpMVPvsvg and HisT7MVP vaults were purified from baculovirus infected Sf9 cells. As seen in the lysates analyzed above, only vaults containing the vsvg epitope tag were pulled down by the antibody-bead assay (Fig. 8B, lanes 1 and 2). When the purified vaults were mixed together in the absence (Fig. 8B, lanes 3 and 4) and the presence of pre-cleared uninfected Sf9 cell lysate (Fig. 8B, lane 5 and 6), no difference in the protein composition of the immunoprecipitates was observed (Fig. 8B, lanes 3–6), indicating that endogenous assembly factors do not appear to affect the exchange of vault MVP subunits.
We next investigated whether the vault exchange phenomenon was saturable. We carried out a series of pull down experiments where the vault mixtures contained increasing ratios of HisT7MVP to cpMVPvsvg purified vaults (Fig. 9). We reasoned that if half vaults were exchanged, the maximum amount of HisT7MVP would be determined by the amount of cpMVPvsvg in the binding assay. Whereas, if individual subunits were exchanged, then the maximum amount of HisT7MVP pulled down would depend on the amount added and not saturate until a vast excess of HisT7MVP was present. As seen in Fig. 9, the amount of HisT7MVP vaults bound to the beads increased proportionally to the amount of HisT7MVP vaults added, but did not exceed the amount of cpMVPvsvg in the pull downs (Fig. 9A lanes 7, 9, 11, 13 compare cpMVPvsvg to HisT7MVP). When the amount of each vault species bound to the beads was quantitated by densitometry, comparing to known concentrations of vaults in the western blots, the presence of HisT7MVP saturated at ~0.8:1 (Fig. 9B). Repeat experiments using the 10:1 ratio indicate saturation occurs at 0.8 ± 0.12:1. This ratio was close to the expected result (1:1) if a half vault – half vault exchange was occurring (Fig. 9C).
Figure 9. Analysis of vaults pulled down by α-VSV beads from mixtures with increasing ratios of purified HisT7MVP to purified cpMVPvsvg.
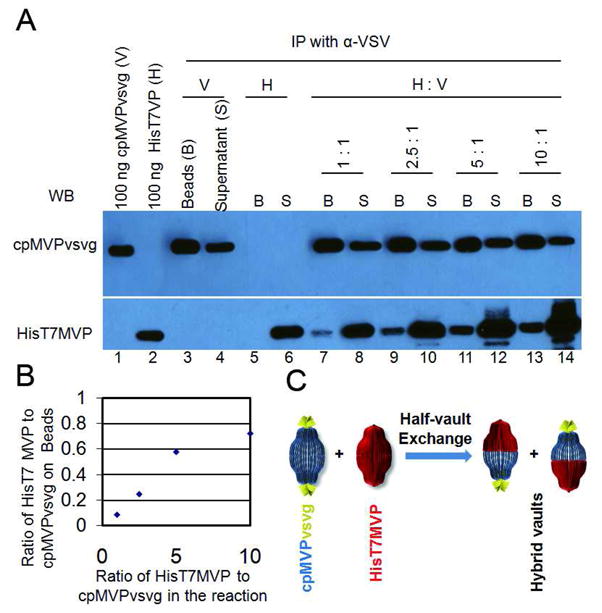
(A) Vaults pulled down by α-VSV beads. Lane 1 and 2 are standards of purified cpMVPvsvg or HisT7MVP with known concentrations. Lane 3 and 5 are vaults pulled down by α-VSV beads from purified cpMVPvsvg and HisT7MVP, respectively. Lane 4 and 6 are vaults left in the supernatants in the bead affinity test. Lane 7, 9, 11, and 13 are vaults pulled down by α-VSV beads from cpMVPvsvg and HisT7MVP mixtures at ratios indicated above. Lane 8, 10, 12, and 14 are vaults left in the supernatants in the bead affinity test. The immunoblots were probed with either α-VSV (upper bands) or α-MVP (lower bands) antibodies. (B) Quantifications of HisT7MVP (H)/cpMVPvsvg (V) ratios. Values of Y axis at each ratio (lane 7, 9, 11, and 13) were calculated based on densitometry analysis comparing to known standards (lane 1 and 2). Values of X axis at each ratio were calculated based on the amount of protein added to each reaction mixture. (C) Illustration of the half-vault exchange model, supported by the α-VSV beads pull-down assay.
All three of the in vitro experiments described above support the model of vaults separating at the waist and rapidly reassembling back into whole hybrid vaults.
Conclusions
This is the first study that systematically investigates the mechanism of vault dynamics. Here we demonstrate that vaults are largely unconstrained cytoplasmic nanoparticles in live cells. Their in vivo movements remain relatively unchanged regardless of modifications to their cellular environment. These vault nanoparticles appear to interact with each other by rapidly exchanging their MVP subunits in vivo. Three independent sets of in vitro experiments (SAXS, TEM, and antibody pulldowns) all support a model whereby MVP subunit exchange occurs through half-vaults. This exchange suggests a means where by vaults “breathe” and functionally interact with the cellular environment. It also presents a mechanism for vault particles to deliver their contents to the cellular environment. VPARP, TEP1 and vRNA are found in cells in both vault-associated and free forms and up-regulation of MVP leads to increased numbers of vaults in cells and increased levels of VPARP and TEP1 in drug resistant cancer cells, suggesting that these proteins are stabilized by their assembly into vaults.10, 35, 36 The vault dynamics described here suggests that a constant exchange into and out of the particles is occurring among vault associated components in vivo and implies that more transiently-associated cell components may likewise be entering and exiting the particle. Understanding the vault’s intrinsic dynamics is important for the development and design of this nanoparticle as a targetable, delivery vehicle.
Materials and Methods
Fluorescent vault production
The cDNAs encoding a FRET pair of fluorescent proteins, cyan fluorescent protein (CFP-C-1) and yellow fluorescent protein (YFP-C-1), were generously provided by Dr. Scott John. A cDNA encoding the photoactivable green fluorescent protein (PAGFP) was generously provided by Dr. Jennifer Lippincott-Schwartz.37 The fluorescent proteins were fused to either the N-terminus or the C-terminus of rat MVP and subsequently all constructs were subcloned into the mammalian expression vector pCR3 containing the CMV promoter to drive the expression of fluorescent labeled vaults in U2OS cells.
PCR3-N-PAGFP-rMVP: The PAGFP cDNA was amplified by polymerase chain reaction (PCR) from plasmid PAGFPC-C1 using two primers 5’-CCG,CTA,GCG,CTA,CCG,GTC,GCC,ACC-3’ and 5’-GCC,CCC,ATG,GCC,TTG,TAC,AGC,TCG,TCC,ATG,CCG,AG-3’. The PCR product, containing Nco I restriction sites on both the NH2- and the COOH- terminals of the PAGFP cDNA, was then digested and ligated into the Nco I linearized, phosphatase treated plasmid pBlueScript-SK-rMVP with the PAGFP cDNA fused immediately on the NH2- side of the rMVP gene. The complete N-PAGFP-rMVP gene was then subcloned using the flanking EcoR I sites into the PCR3 vector.
PCR3-CFP-rMVP and PCR3-YFP-rMVP were constructed using the same procedure as PCR3-N-PAGFP-rMVP except the CFP and YFP genes were amplified from plasmids CFP-C-1 and YFP-C-1.
PCR3-C-rMVP-PAGFP: The PAGFP cDNA was amplified by PCR from PAGFPC-C1 using two primers 5’-TGA,TGG,TCA,GCC,GCC,AGC,ACA,GAA,GAT,GGT,GAG,CAA,GGG,CGA,GGA,GCT,GT-3’ and 5’-GGG,GTC,TAG,ATT,ACT,TGT,ACA,GCT,CGT,CCA,TGC,CGA,G-3’. The partial COOH- terminal rMVP cDNA was amplified by PCR from pBlueScript-SK-rMVP using two primers 5’-GCC,TCT,GTC,ACC,TTT,CAT,GAC-3’ and 5’-ACA,GCT,CCT,CGC,CCT,TGC,TCA,CCA,TCT,TCT,GTG,CTG,GCG,GCT,GAC,CAT,CA-3’. The two PCR products, with a small overlapping section, served as templates for the second round of PCR with two outside primers 5’-GCC,TCT,GTC,ACC,TTT,CAT,GAC-3’ and 5’-GGG,GTC,TAG,ATT,ACT,TGT,ACA,GCT,CGT,CCA,TGC,CGA,G-3’. The newly synthesized PCR product, digested by XhoI and XbaI, was the first piece of the targeted pCR3-C-rMVP-pAGFP plasmid. The second piece was the partial NH2- terminal rMVP gene digested by EcoRI and XhoI from the plasmid pBlueScript-SK-rMVP. The last piece was the vector PCR3 digested by EcoRI and XbaI. The three pieces were then ligated together to generate plasmid pCR3-C-rMVP-PAGFP.
pCR3-dual-(N-CFP-rMVP/N-YFP-rMVP): N-YFP-rMVP was cut off from the plasmid pCR3-N-YFP-rMVP by XbaI and BspHI, followed by Klenow treatment to fill in 5’ overhangs to form blunt ends. Meanwhile, plasmid pCR3-N-CFP-rMVP was cut open by EcoRV, followed by CIP treatment to prevent from self-ligation. The two digested pieces were then ligated to form the mammalian dual (CFP/YFP) plasmid. All final constructs were confirmed by sequencing.
All of the above plasmids (0.4 μg of DNA) were transiently transfected into U2OS cells (1 × 10⁵ cells) using the Effectene Transfection kit (Qiagen) according to the manufactures protocol for 24 hours. For stable transfections, transiently transfected U2OS cells were passaged into the DMEM selective medium containing 500 μg/mL geneticin (Gibco) until colonies appeared. Subcellular fractionation of the expressed recombinant vaults was then carried out according to a previously described procedure and analyzed by Western.25
Photoactivation of PAGFP vaults and the subsequent kinetic study by FRAP
Live cell photoactivation experiments were performed using a Leica TCS SP2 AOBS confocal microscope (Leica Microsystems Inc., Exton, PA) equipped with a 405 nm diode laser (Coherent Inc., Santa Clara, CA) and a 488nm Argon laser for excitation. The cell culture medium was replaced with fresh phenol red-free medium, and the cells were maintained at 37°C in a humidified temperature-controlled chamber containing 5% CO2 on the microscope stage. Images were acquired with a 63× oil-immersion objective (HCX PL APO, NA 1.40) and analyzed with the Leica software. Scanning was performed at a line frequency of 200 Hz, averaged 2 to 4 times at an image resolution of 512 × 512 (pixel dwell time: 9.7 μs/pixel) or 256 × 256 pixels (pixel dwell time: 19.5 μs/pixel) using 20% 488 nm laser power. Photoactivation was achieved using 100% 405 nm laser power and a 100 ms activation pulse. Images were further processed with Microsoft Paint 6.0 (Redmond, WA).
An effective diffusion rate was calculated from the PAGFP photoactivation data by carrying out a special occupation measurement similar to FRAP taking the entire cell as the region of recovery. Each frame was transformed into binary mode (black or white pixels). A threshold was normalized and then the number of pixels lighting up over time was determined. We used the following parameters for the analysis of 30 frames prior to saturation: 1.63 s/frame, 0.233 μm2/pixel, where w is the surface area of the cell (= 175.07 μm2). The data was graphically fit and t1/2 was determined to be 9 second.
FRAP of N- or C- terminal labeled PAGFP vaults was carried out on the same Leica TCS SP2 AOBS confocal microscope equipped with a thermostatted stage. The whole field of view was first irradiated with 100 % 405 nm laser power multiple times to ensure the maximal photoactivation of PAGFP vaults. FRAP experiments were then performed by bleaching a strip of cytoplasm (2 μm across the whole cell) by a short bleach pulse (~ 0.2 s) at 100 % 488 nm laser power and monitoring the reappearance of fluorescent particles at 0.2-s intervals. The parameter t1/2 (the time required for the bleach spot to recover half of its initial intensity) was best fitted with Leica software. The effective diffusion constant D was calculated from the following equation: where w is the width of the swath area (2 μm).
The same photoactivation/FRAP procedure was repeated for all treated U2OS cells (Without serum, incubated in the absence of serum overnight at 37 °C, 5% CO2; +Paclitaxel, incubated with 50 μM paclitaxel in complete DMEM for 30 min at 37 °C, 5% CO2; +Antimycin A, incubated with 1 μM antimycin A in complete DMEM for 30 min at 37 °C, 5% CO2; +H2O2, incubated with 1 mM H2O2 in complete DMEM for 30 min at 22 °C, 5% CO2)
FRET analysis of MVP subunits exchange IN VIVO
Stably transfected CFP-rMVP/U2OS cells and YFP-rMVP/U2OS cells were trypsinized, mixed at 1:1 ratio, and incubated in glass bottom microwell dishes (MatTek) with complete DMEM (Gibco DMEM high glucose containing 10% Fetal bovine serum, 100 μg/mL streptomycin, and 100 U/mL penicillin.) without phenol red. Thoroughly aspirate all media from the dish when cells reached 100% confluency, and added 1 mL 50% (w/v) PEG 1500 dissolved in 75 mM Hepes, pH 8.0 (Roche) to dish; rock gently to cover all cells for 1 min. After aspirating the PEG solution, wash cells with 3 X 2 mL warm (37°C) serum free DMEM media, then incubate them in complete DMEM without phenol red for 2–4 hr prior to FRET measurements.
FRET measurements were performed by simultaneously monitoring CFP and YFP emissions of the sample when excited at the wavelengths for CFP (royal blue LED). Images (16-bit) were acquired using a Nikon Eclipse TE300 microscope fitted with a 60× (NA 1.49) oil-immersion lens (Nikon) and equipped with the following filters/dichroic sets (nm): 1) CFP cube: excitation 436/20b (band pass), emission 480/40b, dichroic 455 (long pass; DCLP); 2) YFP cube: excitation 500/20b, emission 535/30b, DCLP 515, and FRET cube: excitation 436/20b, EM 535/30b, DCLP 455 (Chroma Technology, Rockingham, VT). Light emitting diodes (LEDs; Lumileds, San Jose, CA) were used as light sources: one emitting at 455 ± 20 nm (royal blue) and the other emitting at 505 ± 15 nm (cyan). YFP and CFP images were acquired simultaneously using the Dual View (Optical Insights, Tucson, AZ) image splitter equipped with a 505-nm long-pass dichroic filter to separate the CFP and YFP signals. LEDs and camera exposure were controlled in real time by MetaFluor Imaging 6.1 software (Molecular Devices, Sunnyvale, CA). Images and the intensities of YFP and CFP emission were captured online using the MetaFluor Imaging software with a Cascade 512B digital camera (Photometrics, Tucson, AZ).
The small angle x-ray scattering (SAXS)
SAXS measurements were performed at the Stanford Synchrotron Radiation Laboratory (beamline 4–2). On the basis of concentration series data, the vault concentration of 1.5 mg/mL was chosen for the SAXS measurement to eliminate inter particle interference (i.e., structure factor effects). For the measurement, 25 mu;L of the vault sample was injected in a quartz capillary at 25 °C. Scattered X-rays were collected (λ = 1.38 Å, 20 scans of 30 s each) on a MarCCD detector as 512 × 512 pixel images with a sample-to-detector distance at 2.5m. The images were radially averaged to obtain one-dimensional scattering curves.
The collected data were analyzed using the ATSAS package (EMBL, Hamburg, Germany). PRIMUS and GNOM were used to generate the distance distribution function -- P(r).38, 39 The resulting GNOM output file was fed into DAMMIN to generate bead-model shape reconstructions which satisfy the experimental scattering curve and any symmetry restrictions if imposed.40 For each trial, fifty such reconstructions using different initial random seeds were computed, aligned and averaged using DAMAVER.38 The most probable molecular volume was generated using DAMFILT by removal of beads least likely to be in more than one reconstructed structure.38 Fifty percent of the total beads arising from the superposition of all 50 structures were removed to generate the final filtered shape. The filtered bead structure was next converted to a molecular surface by convolution with a Gaussian kernel using the pdb2vol tool in Situs.41
The expected SAXS scattering curves for half and full vaults were calculated from the 3.5 Å x-ray crystal structure published by Tanaka et al.6 Both full and half vault structures were constructed by merging the published PDB structures (2ZUO, 2ZV4, and 2ZV5). Corresponding scattering curves were then computed using CRYSOL.42 Multiple regression analyses to fit relative ratios of computed full and half vault scattering curves to experimental data were conducted using MATLAB (The MathWorks, Inc. Natick, MA). Molecular representations were rendered using VMD.43
TEM
Purified cpMVPvsvg vaults at 0.02 mg/mL, in the presence or the absence of 0.1 mg/mL cpMVP vaults, were incubated on ice for 1 hr. Followed by the addition of α-VSV antibody to a final concentration of 0.05 mg/ml and incubated on ice for an additional hour. Vaults from the resulting mixtures were then applied to carbon grids, stained with uranyl acetate, and visualized by transmission electron microscopy on a JEM1200-EX microscope in the CNSI Electron Imaging Center for NanoMachines (EICN) as previously described.23
Immuno-pulldown assays
cpMVPvsvg and HisT7MVP vaults were prepared both as purified proteins and whole cell lysates according to a procedure previously described.23 To clear the lysates of non-specific background binding Protein G agarose beads (15 μL) were incubated with 250 μL cpMVPvsvg and HisT7MVP clear lysates at 4ºC for 10 min. After the G beads were pelleted at 20,000 g for 5 min, the resulting pre-cleared lysates, with an estimated protein concentration of 0.1 μg/μL, were used in all subsequent experiments. In all assays, the protein G beads and the α-VSV monoclonal antibody (Sigma) were added to final concentrations of 10 μg and 1 μg per 100 μL assay, respectively. Purified cpMVPvsvg and HisT7MVP vaults were added to final concentrations of 5 μg and 5× μg (where x = 0, 1, 2.5 , 5, or 10; depending on the individual assay) per 100 μL assay, respectively. After the assembled reaction was rocked at 4 or 25°C in a buffer containing 50 mM Tris pH 7.4, 75 mM NaCl, 0.5 mM MgCl2, and 1% W/V Triton X-100 for various amount of time, the protein G beads were washed in 3 X 0.5 mL lysis buffer and resuspended in 50 or 100 μL SDS loading buffer for further analysis. Samples were separated on a 6% SDS-PAGE, Western blotted to Hybond-C membrane (Amersham), and probed with either α-VSV or α-T7 monoclonal antibodies.
Acknowledgments
This work was supported by the UC Discovery Grant Program in collaboration with our corporate sponsor, Abraxis Biosciences, Inc (Award# BIO07-10671) and by the Mather’s Charitable Foundation (Grant# 04095186). Confocal laser scanning microscopy was performed at the California NanoSystems Institute (CNSI) Advanced Light Microscopy/Spectroscopy Shared Resource Facility at UCLA, supported with funding from an NIH-NCRR shared resource grant (CJX1-44385-WS-29646) and a NSF Major Research Instrumentation grant (CHE-0722519). The SAXS work was supported by the U.S. National Science Foundation through a Nano-Science Interdisciplinary Research Team (NIRT) Grant (LHR, HGM, and SHT, MCB-0210690), an NSF IGERT Grant (BCN, DGE-0114443, and by the California NanoSystems Institute. AG was supported by grant CHE 0714411 from the National Science Foundation. SAXS shape reconstructions and regression analyses were conducted on the Hoffman2 Campus Computing Cluster available through the UCLA Academic Technology Services. We gratefully thank Dr. Marc Niebuhr for technical assistance at the X-ray beamline. Portions of this research were carried out at the Stanford Synchrotron Radiation Laboratory, a national user facility operated by Stanford University on behalf of the U.S. Department of Energy, Office of Basic Energy Sciences. The SSRL Structural Molecular Biology Program is supported by the Department of Energy, Office of Biological and Environmental Research, and by the National Institutes of Health, National Center for Research Resources, Biomedical Technology Program.
References
- 1.Wang M, Thanou M. Targeting Nanoparticles to Cancer. Pharmacol Res. 2010;62:90–99. doi: 10.1016/j.phrs.2010.03.005. [DOI] [PubMed] [Google Scholar]
- 2.Singh R, Lillard JW., Jr Nanoparticle-Based Targeted Drug Delivery. Exp Mol Pathol. 2009;86:215–223. doi: 10.1016/j.yexmp.2008.12.004. [DOI] [PMC free article] [PubMed] [Google Scholar]
- 3.Mikyas Y, Makabi M, Raval-Fernandes S, Harrington L, Kickhoefer VA, Rome LH, Stewart PL. Cryoelectron Microscopy Imaging of Recombinant and Tissue Derived Vaults: Localization of the MVP N Termini and VPARP. J Mol Biol. 2004;344:91–105. doi: 10.1016/j.jmb.2004.09.021. [DOI] [PubMed] [Google Scholar]
- 4.Kedersha NL, Rome LH. Isolation and Characterization of a Novel Ribonucleoprotein Particle: Large Structures Contain a Single Species of Small RNA. J Cell Biol. 1986;103:699–709. doi: 10.1083/jcb.103.3.699. [DOI] [PMC free article] [PubMed] [Google Scholar]
- 5.Kedersha NL, Heuser JE, Chugani DC, Rome LH. Vaults. III. Vault Ribonucleoprotein Particles Open into Flower-Like Structures with Octagonal Symmetry. J Cell Biol. 1991;112:225–235. doi: 10.1083/jcb.112.2.225. [DOI] [PMC free article] [PubMed] [Google Scholar]
- 6.Tanaka H, Kato K, Yamashita E, Sumizawa T, Zhou Y, Yao M, Iwasaki K, Yoshimura M, Tsukihara T. The Structure of Rat Liver Vault at 3.5 Angstrom Resolution. Science. 2009;323:384–388. doi: 10.1126/science.1164975. [DOI] [PubMed] [Google Scholar]
- 7.Kong LB, Siva AC, Rome LH, Stewart PL. Structure of the Vault, a Ubiquitous Celular Component. Structure. 1999;7:371–379. doi: 10.1016/s0969-2126(99)80050-1. [DOI] [PubMed] [Google Scholar]
- 8.Kickhoefer VA, Siva AC, Kedersha NL, Inman EM, Ruland C, Streuli M, Rome LH. The 193-kD Vault Protein, VPARP, Is a Novel Poly(ADP-ribose) Polymerase. J Cell Biol. 1999;146:917–928. doi: 10.1083/jcb.146.5.917. [DOI] [PMC free article] [PubMed] [Google Scholar]
- 9.Kickhoefer VA, Stephen AG, Harrington L, Robinson MO, Rome LH. Vaults and Telomerase Share a Common Subunit, TEP1. J Biol Chem. 1999;274:32712–32717. doi: 10.1074/jbc.274.46.32712. [DOI] [PubMed] [Google Scholar]
- 10.Suprenant KA. Vault Ribonucleoprotein Particles: Sarcophagi, Gondolas, or Safety Deposit Boxes? Biochemistry. 2002;41:14447–14454. doi: 10.1021/bi026747e. [DOI] [PubMed] [Google Scholar]
- 11.Berger W, Steiner E, Grusch M, Elbling L, Micksche M. Vaults and the Major Vault Protein: Novel Roles in Signal Pathway Regulation and Immunity. Cell Mol Life Sci. 2009;66:43–61. doi: 10.1007/s00018-008-8364-z. [DOI] [PMC free article] [PubMed] [Google Scholar]
- 12.Stephen AG, Raval-Fernandes S, Huynh T, Torres M, Kickhoefer VA, Rome LH. Assembly of Vault-Like Particles in Insect Cells Expressing Only the Major Vault Protein. J Biol Chem. 2001;276:23217–23220. doi: 10.1074/jbc.C100226200. [DOI] [PubMed] [Google Scholar]
- 13.Esfandiary R, Kickhoefer VA, Rome LH, Joshi SB, Middaugh CR. Structural Stability of Vault Particles. J Pharm Sci. 2009;98:1376–1386. doi: 10.1002/jps.21508. [DOI] [PubMed] [Google Scholar]
- 14.Goldsmith LE, Yu M, Rome LH, Monbouquette HG. Vault Nanocapsule Dissociation into Halves Triggered at Low pH. Biochemistry. 2007;46:2865–2875. doi: 10.1021/bi0606243. [DOI] [PubMed] [Google Scholar]
- 15.Anderson DH, Kickhoefer VA, Sievers SA, Rome LH, Eisenberg D. Draft crystal Structure of the Vault Shell at 9-Angstrom Resolution. PLoS Biol. 2007;5:2661–2670. doi: 10.1371/journal.pbio.0050318. [DOI] [PMC free article] [PubMed] [Google Scholar]
- 16.Kickhoefer VA, Han M, Raval-Fernandes S, Poderycki MJ, Moniz RJ, Vaccari D, Silvestry M, Stewart PL, Kelly KA, Rome LH. Targeting Vault Nanoparticles to Specific Cell Surface Receptors. ACS Nano. 2009;3:27–36. doi: 10.1021/nn800638x. [DOI] [PMC free article] [PubMed] [Google Scholar]
- 17.Lai CY, Wiethoff CM, Kickhoefer VA, Rome LH, Nemerow GR. Vault Nanoparticles Containing an Adenovirus-Derived Membrane Lytic Protein Facilitate Toxin and Gene Transfer. ACS Nano. 2009;3:691–699. doi: 10.1021/nn8008504. [DOI] [PMC free article] [PubMed] [Google Scholar]
- 18.Goldsmith LE, Pupols M, Kickhoefer VA, Rome LH, Monbouquette HG. Utilization of a Protein “Shuttle” to Load Vault Nanocapsules with Gold Probes and Proteins. ACS Nano. 2009;3:3175–3183. doi: 10.1021/nn900555d. [DOI] [PubMed] [Google Scholar]
- 19.Champion CI, Kickhoefer VA, Liu G, Moniz RJ, Freed AS, Bergmann LL, Vaccari D, Raval-Fernandes S, Chan AM, Rome LH, et al. A Vault Nanoparticle Vaccine Induces Protective Mucosal Immunity. PLoS One. 2009;4:e5409. doi: 10.1371/journal.pone.0005409. [DOI] [PMC free article] [PubMed] [Google Scholar]
- 20.Kickhoefer VA, Garcia Y, Mikyas Y, Johansson E, Zhou JC, Raval-Fernandes S, Minoofar P, Zink JI, Dunn B, Stewart PL, et al. Engineering of Vault Nanocapsules with Enzymatic and Fluorescent Properties. Proc Natl Acad Sci U S A. 2005;102:4348–4352. doi: 10.1073/pnas.0500929102. [DOI] [PMC free article] [PubMed] [Google Scholar]
- 21.van Zon A, Mossink MH, Schoester M, Scheffer GL, Scheper RJ, Sonneveld P, Wiemer EA. Structural Domains of Vault Proteins: a Role for the Coiled Coil Domain in Vault Assembly. Biochem Biophys Res Commun. 2002;291:535–541. doi: 10.1006/bbrc.2002.6472. [DOI] [PubMed] [Google Scholar]
- 22.Ng BC, Yu M, Gopal A, Rome LH, Monbouquette HG, Tolbert SH. Encapsulation of Semiconducting Polymers in Vault Protein Cages. Nano Lett. 2008;8:3503–3509. doi: 10.1021/nl080537r. [DOI] [PMC free article] [PubMed] [Google Scholar]
- 23.Poderycki MJ, Kickhoefer VA, Kaddis CS, Raval-Fernandes S, Johansson E, Zink JI, Loo JA, Rome LH. The Vault Exterior Shell Is a Dynamic Structure That Allows Incorporation of Vault-associated Proteins into Its Interior. Biochemistry. 2006;45:12184–12193. doi: 10.1021/bi0610552. [DOI] [PMC free article] [PubMed] [Google Scholar]
- 24.Yu M, Ng BC, Rome LH, Tolbert SH, Monbouquette HG. Reversible pH Lability of Cross-linked Vault Nanocapsules. Nano Lett. 2008;8:3510–3515. doi: 10.1021/nl080536z. [DOI] [PMC free article] [PubMed] [Google Scholar]
- 25.Slesina M, Inman EM, Moore AE, Goldhaber JI, Rome LH, Volknandt W. Movement of Vault Particles Visualized by GFP-Tagged Major Vault Protein. Cell Tissue Res. 2006;324:403–410. doi: 10.1007/s00441-006-0158-8. [DOI] [PubMed] [Google Scholar]
- 26.van Zon A, Mossink MH, Schoester M, Houtsmuller AB, Scheffer GL, Scheper RJ, Sonneveld P, Wiemer EA. The Formation of Vault-Tubes: a Dynamic Interaction Between Vaults and Vault PARP. J Cell Sci. 2003;116:4391–4400. doi: 10.1242/jcs.00749. [DOI] [PubMed] [Google Scholar]
- 27.van Zon A, Mossink MH, Houtsmuller AB, Schoester M, Scheffer GL, Scheper RJ, Sonneveld P, Wiemer EA. Vault Mobility Depends in Part on Microtubules and Vaults Can Be Recruited to the Nuclear Envelope. Exp Cell Res. 2006;312:245–255. doi: 10.1016/j.yexcr.2005.10.016. [DOI] [PubMed] [Google Scholar]
- 28.Jacobson K, Wojcieszyn J. The Translational Mobility of Substances within the Cytoplasmic Matrix. Proc Natl Acad Sci U S A. 1984;81:6747–6751. doi: 10.1073/pnas.81.21.6747. [DOI] [PMC free article] [PubMed] [Google Scholar]
- 29.Slesina M, Inman EM, Rome LH, Volknandt W. Nuclear Localization of the Major Vault Protein in U373 Cells. Cell Tissue Res. 2005;321:97–104. doi: 10.1007/s00441-005-1086-8. [DOI] [PubMed] [Google Scholar]
- 30.van Zon A, Mossink MH, Scheper RJ, Sonneveld P, Wiemer EA. The Vault Complex. Cell Mol Life Sci. 2003;60:1828–1837. doi: 10.1007/s00018-003-3030-y. [DOI] [PMC free article] [PubMed] [Google Scholar]
- 31.Zheng CL, Sumizawa T, Che XF, Tsuyama S, Furukawa T, Haraguchi M, Gao H, Gotanda T, Jueng HC, Murata F, et al. Characterization of MVP and VPARP Assembly into Vault Ribonucleoprotein Complexes. Biochem Biophys Res Commun. 2005;326:100–107. doi: 10.1016/j.bbrc.2004.11.006. [DOI] [PubMed] [Google Scholar]
- 32.Kickhoefer VA, Liu Y, Kong LB, Snow BE, Stewart PL, Harrington L, Rome LH. The Telomerase/Vault-Associated Protein TEP1 Is Required for Vault RNA Stability and Its Association with the Vault Particle. J Cell Biol. 2001;152:157–164. doi: 10.1083/jcb.152.1.157. [DOI] [PMC free article] [PubMed] [Google Scholar]
- 33.Luby-Phelps K, Castle PE, Taylor DL, Lanni F. Hindered Diffusion of Inert Tracer Particles in the Cytoplasm of Mouse 3T3 Cells. Proc Natl Acad Sci U S A. 1987;84:4910–4913. doi: 10.1073/pnas.84.14.4910. [DOI] [PMC free article] [PubMed] [Google Scholar]
- 34.Fung YC. Mechanical Properties of Living Tissues. 2. Springer; 1993. Biomechanics. [Google Scholar]
- 35.Siva AC, Raval-Fernandes S, Stephen AG, LaFemina MJ, Scheper RJ, Kickhoefer VA, Rome LH. Up-Regulation of Vaults May Be Necessary But Not Sufficient for Multidrug Resistance. Int J Cancer. 2001;92:195–202. doi: 10.1002/1097-0215(200102)9999:9999<::aid-ijc1168>3.0.co;2-7. [DOI] [PubMed] [Google Scholar]
- 36.Silva P, West CM, Slevin N, Valentine H, Ryder WD, Hampson L, Bibi R, Sloan P, Thakker N, Homer J, Hampson I. Tumor Expression of Major Vault Protein Is an Adverse Prognostic Factor for Radiotherapy Outcome in Oropharyngeal Carcinoma. Int J Radiat Oncol, Biol Phys. 2007;69:133–140. doi: 10.1016/j.ijrobp.2007.02.025. [DOI] [PubMed] [Google Scholar]
- 37.Patterson GH, Lippincott-Schwartz J. A Photoactivatable GFP for Selective Photolabeling of Proteins and Cells. Science. 2002;297:1873–1877. doi: 10.1126/science.1074952. [DOI] [PubMed] [Google Scholar]
- 38.Konarev PV, Volkov VV, Sokolova AV, Koch MHJ, Svergun DI. PRIMUS: a Windows PC-Based System for Small-Angle Scattering Data Analysis. J Appl Crystallogr. 2003;36:1277–1282. [Google Scholar]
- 39.Svergun D. Determination of the Regularization Parameter in Indirect-Transform Methods Using Perceptual Criteria. J Appl Crystallogr. 1992;25:495–503. [Google Scholar]
- 40.Svergun DI. Restoring Low Resolution Structure of Biological Macromolecules from Solution Scattering Using Simulated Annealing. Biophys J. 1999;76:2879–2886. doi: 10.1016/S0006-3495(99)77443-6. [DOI] [PMC free article] [PubMed] [Google Scholar]
- 41.Wriggers W, Milligan RA, McCammon JA. Situs: A Package for Docking Crystal Structures into Low- Resolution Maps from Electron Microscopy. J Struct Biol. 1999;125:185–195. doi: 10.1006/jsbi.1998.4080. [DOI] [PubMed] [Google Scholar]
- 42.Svergun D, Barberato C, KOCH MHJ. CRYSOL : A Program to Evaluate X-Ray Solution Scattering of Biological Macromolecules from Atomic Coordinates. J Appl Crystallogr. 1995;28:768–773. [Google Scholar]
- 43.Humphrey W, Dalke A, Schulten K. VMD: Visual Molecular Dynamics. J Mol Graphics. 1996;14:33–38. doi: 10.1016/0263-7855(96)00018-5. [DOI] [PubMed] [Google Scholar]