

Abstract
Although human evolution is characterized by a vast increase in brain size, it is not clear whether or not certain regions of the brain are enlarged disproportionately in humans, or how this enlargement relates to differences in overall neural morphology. The aim of this study is to determine whether or not there are specific suites of features that distinguish the morphology of the human brain from that of apes. The study sample consists of whole brain, in vivo magnetic resonance images (MRIs) of anatomically modern humans (Homo sapiens sapiens) and five ape species (gibbons, orangutans, gorillas, chimpanzees, bonobos). Twenty-nine 3D landmarks, including surface and internal features of the brain were located on 3D MRI reconstructions of each individual using MEASURE software. Landmark coordinate data were scaled for differences in size and analyzed using Euclidean Distance Matrix Analysis (EDMA) to statistically compare the brains of each non-human ape species to the human sample. Results of analyses show both a pattern of brain morphology that is consistently different between all apes and humans, as well as patterns that differ among species. Further, both the consistent and species-specific patterns include cortical and subcortical features. The pattern that remains consistent across species indicates a morphological reorganization of 1) relationships between cortical and subcortical frontal structures, 2) expansion of the temporal lobe and location of the amygdala, and 3) expansion of the anterior parietal region. Additionally, results demonstrate that, although there is a pattern of morphology that uniquely defines the human brain, there are also patterns that uniquely differentiate human morphology from the morphology of each non-human ape species, indicating that reorganization of neural morphology occurred at the evolutionary divergence of each of these groups.
Keywords: brain evolution, morphology, neuroanatomy, human evolution
Introduction
The human brain is many times larger than would be expected for a primate of similar body size (Falk, 1980; Martin, 1990). Investigations of fossil hominin cranial capacities have shown that brain size increased gradually between 3.0–1.8 Ma (Falk et al., 2000), and then expanded rapidly from 600-150 ka (Ruff et al., 1997). In addition to this rapid expansion in size, it has been hypothesized that the human brain shows significant reorganization relative to non-human primates, and that the consequences of reorganization over evolutionary history are associated with species-specific shifts in connectivity between regions (Holloway, 1966; Deacon, 1997). The brain is a heterogeneous structure in which distinct regions operate as a series of circuits, with any change in function of a specific region associated with a gain, a loss, or a redirection of circuitry in that area (Deacon, 1990; Harvey and Krebs, 1990; Aboitiz, 1996). Deacon’s (1990) displacement hypothesis states that changes in the amount of connectivity within a system result in correlated reorganization of the circuitry, and it is the scope and breadth of this overall reorganization of circuitry that is uniquely human (Deacon, 1990). Changes in circuitry are reflected in the spatial relationships between neuroanatomical structures. A study of the morphology of the entire brain in primates, including both cortical surface and subcortical regions, is critical to the definition of interspecific morphological differences, and specifically, to the determination of the characters unique to the human brain. The goal of this study, therefore, is to examine whole brain patterns of morphology in humans as compared to the other extant apes.
Brain size is an important character in distinguishing fossil species, but it is likely that brain size, however measured, is only one indicator of important distinctions in human brain evolution. No measure of overall size, or sizes of individual structures alone, can adequately explain the complexities of the human brain (Pirlot and Stephan, 1970; Holloway, 1972; Pirlot, 1987; Harvey and Krebs, 1990; Healy and Rowe, 2007). Two brains may be of similar size, and yet the relationships between the component structures may be altered (Holloway, 1983, 2002a; Mesulam, 2000). Several previous studies of brain morphology in hominoids have described localized changes in spatial relationships of neural components. For example, Holloway (1992) described the tradeoff of human primary visual cortex and the posterior parietal association cortex as evidence of the reorganization of the human brain relative to the chimpanzee brain. Falk et al. (2000) concluded that the orbitofrontal region in humans is reorganized as compared to Gorilla and Pan. Armstrong and others (Zilles et al., 1988; Armstrong, 1995) concluded that the prefrontal cortex is significantly reorganized in humans relative to the other hominoids based on degree of cortical convolution.
Previous studies have provided important information about evolutionary changes in size and morphological organization of focal areas of the brain, however, they have been limited by a number of factors. Among these factors is the isolation of the cerebral cortex, or other regions of the brain for study, with little or no reference to the remaining components of the organ (i.e., subcortical structures). Therefore, this study is designed to determine patterns of morphology that are unique to the human brain by comparing spatial relationships among brain components in humans as compared to five extant hominoid primate species. If the patterns of morphological association among various parts of the brain (both surface and subcortical) differ between human and non-human primates, it would suggest that humans have developed a reorganization of circuitry. Following this logic, demonstrated reorganization may form the basis for significant changes in function.
Research design and methods
Study sample
The study sample includes in vivo magnetic resonance images (MRIs) of 63 adult individuals of six hominoid species including humans, bonobos, chimpanzees, gorillas, orangutans, and gibbons (Table 1). The human MRI data were acquired by GE Signa 1.5T using a spoiled gradient recall echo in a steady state (GRASS) sequence at the Johns Hopkins Medical Institutions, Baltimore, MD; informed consent was obtained for all subjects following approved IRB protocols. The non-human hominoid image data were acquired with a 1.5T Phillips NT scanner using a T1-weighted gradient echo at Yerkes Regional Primate Center, Emory University, Atlanta, GA, following approved IACUC protocols. MRI scanning parameters are described in Table 1.
Table 1.
Study sample and magnetic resonance imaging parameters.
| Species | Age (yrs) |
Females (N) |
Males (N) |
Matrix size* |
Field of view (mm) |
Slice thickness (mm) |
Slice interval (mm) |
|---|---|---|---|---|---|---|---|
| Homo sapiens | 19–50 | 26 | 19 | 256 × 256 | 240 | 1.5 | Contiguous |
| Pan paniscus | 8–28 | 2 | 2 | 256 × 256 | 180–200 | 1.2 | 0.6 |
| Pan troglodytes | 8–39 | 3 | 3 | 256 × 256 | 160–200 | 1.2 | 0.6 |
| Gorilla gorilla | 8–13.5 | 1 | 1 | 256 × 256 | 180 | 1.2 | 0.6 |
| Pongo pygmaeus | 8.5–18.5 | 1 | 2 | 256 × 256 | 180 | 1.2 | 0.6 |
| Hylobates lar | 5.5–26 | 1 | 2 | 256 × 256 | 140–180 | 1.2 | 0.6 |
Matrix size is the number of pixels per MR slice.
Data collection
Brain measures included three-dimensional coordinates of neuroanatomical landmarks collected from the MRIs using MEASURE, a software program written for a PC platform (Barta et al., 1997). This software allows visualization of MR image data in three orthogonal planes and in a 3D reconstruction. Prior to reconstruction, all non-neural tissue is manually stripped from each image slice following a previously described protocol (Aylward et al., 1997; Buchanan et al., 1998), which is briefly summarized here. An automated algorithm defines a volume of interest based on gray-white contrast. Any non-neural components that are included in this volume (e.g., dura, blood vessels, cranial nerves) may then be erased manually. A 3D reconstruction of the remaining brain tissue is then rendered from the stripped slice data, which can be manipulated in virtual space and viewed from any direction.
A total of twenty-nine neuroanatomical landmarks (i.e., consistently identifiable loci on the brain) defined for study were located on structures on the cortical surface, as well as on subcortical forebrain, midbrain, and hindbrain derivatives (Figure 1, Table 2). Using MEASURE, landmarks can be placed on any of the three planar views or directly on the reconstruction. The value of these data and their repeatability and precision have been previously validated (Aldridge et al., 2000; Aldridge, 2004), and are briefly presented. Twenty individuals were chosen at random from the human sample (10 male, 10 female) and all 29 landmarks were collected from each of the 20 individuals ten times. For every individual, mean X, Y, and Z coordinates, along with linear deviations from these mean coordinates, were calculated for each landmark using data from the 10 landmark trials. A measure of precision for each landmark across individuals was calculated as the mean of the mean individual deviation values. The mean deviation across all landmarks was 1.97 mm. Landmarks located on different regions of the brain displayed differing degrees of error: landmarks located on the midline consistently demonstrated a low degree of error (<1.0 mm), while landmarks farther from the midline seemed to show relatively higher degrees of error. In fact, landmarks located at the terminations or intersections of cortical sulci were associated with a higher degree of error (e.g., 2.93 mm for left inferior frontal sulcus) as compared to those located on subcortical structures (e.g., 1.10 mm for the left head of the caudate nucleus). These results indicate that strictly defined neuroanatomical landmarks can be recorded with acceptable levels of precision and repeatability.
Figure 1.
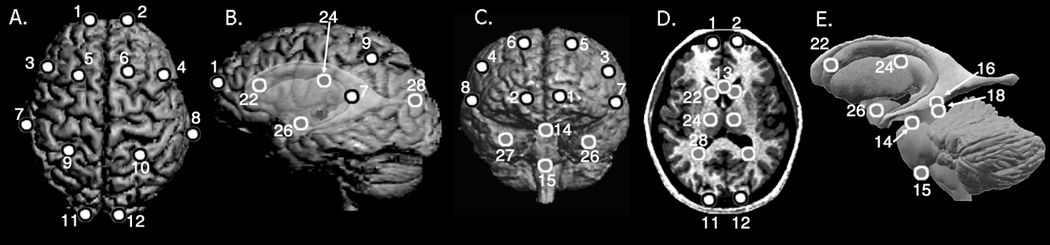
Landmarks illustrated on 3D reconstructions of an MRI of a human brain. A) superior cerebral surface; B) left lateral surface with ghosted subcortical structures; C) anterior surface; D) axial slice; and E) a model of subcortical structures. Landmarks are defined in Table 2. Landmarks 20 and 21 are not illustrated because of difficulty visualizing them in the included reconstructions. Landmarks 23, 25, and 29 are marked with gray dots (D), though not labeled in order to retain visualization of these structures (their contralateral counterparts are labeled); similarly, the landmarks 17 and 19 not in the plane of view in this figure, though their contralateral counterparts are labeled (16 and 18, respectively).
Table 2.
Three-dimensional landmark data collected for each individual. When two numbers are listed, landmarks occur bilaterally (i.e., left, right). Landmark locations are illustrated in Figure 1.
| Landmark definition | |
|---|---|
| 1, 2 | Frontal pole |
| 3, 4 | Posterior termination of the inferior frontal sulcus |
| 5, 6 | Posterior termination of the superior frontal sulcus |
| 7, 8 | Posterior termination of the Sylvian fissure |
| 9, 10 | Intersection of intraparietal and postcentral sulci |
| 11, 12 | Occipital pole |
| 13 | Midline of the genu of the corpus callosum |
| 14 | Midline of the most superior aspect of the pons |
| 15 | Midline of the most inferior aspect of the pons |
| 16, 17 | Centroid of the superior colliculus |
| 18, 19 | Centroid of the inferior colliculus |
| 20 | Junction of the cerebral aqueduct and the 4th ventricle |
| 21 | Posterior-most aspect of the 4th ventricle |
| 22, 23 | Centroid of the head of the caudate nucleus |
| 24, 25 | Centroid of the thalamus |
| 26, 27 | Centroid of the amygdala |
| 28, 29 | Posterior horn of the lateral ventricle |
For this study, three dimensional coordinates of each landmark were recorded twice for each individual, and the X, Y, and Z coordinates of the two trials for each landmark were averaged to minimize intra-observer error.
Data analysis
The landmark coordinate data collected in MEASURE were analyzed using Euclidean Distance Matrix Analysis, or EDMA (Lele and Richtsmeier, 2001). EDMA is a linear distance-based morphometric method that does not rely on registration or fitting criteria (Lele, 1993; Lele and Richtsmeier, 2001). In brief, linear distances are calculated between all possible pairs of landmarks, and these linear distances are compared across samples as ratios. EDMA represents the form of each individual as a form matrix (FM), which is comprised of the set of all possible linear distances between landmarks. EDMA allows for scaling of linear distances, both within each individual and across samples. The form matrix (FM) for each individual was scaled in these cases such that each linear distance is divided by the geometric mean of all linear distances within that individual’s FM. Thus, each individual’s data were scaled by a unique scaling factor. Average FMs are compared as ratios of like linear distances for each sample. This set of ratios of corresponding linear distances is called a form difference matrix (FDM). If a ratio in an FDM is equal to 1, then the forms being compared do not differ for that discrete linear distance. If the ratio is larger than one, the linear distance is greater in the form used as the numerator in the ratio. Likewise, if the ratio is smaller than one, the linear distance is greater in the form used as the denominator. Patterns of differences in suites of linear distances summarize spatial relationships among structures, which may serve as a proxy for organization of circuitry (Hofman, 1989; Deacon, 1990).
Seven sets of comparisons were made: 1) humans vs. all non-human apes (including gibbons); 2) humans vs. non-human great apes; 3) humans vs. bonobos; 4) humans vs. chimpanzees; 5) humans vs. gorillas; 6) humans vs. orangutans; and 7) humans vs. gibbons. As described above, each individual was scaled for size differences based on the geometric mean of all linear distances between landmarks. The geometric mean was chosen as a surrogate for size following Darroch and Mosimann (1985), Falsetti et al. (1993), and Jungers et al. (1995). Males and females were analyzed separately to control for effects of sexual dimorphism.
In each set of comparisons, the null hypothesis of similarity in shape was tested for six regional subsets of landmarks (defined in Table 3) in order to determine whether or not specific neuroanatomical regions differed significantly between the comparative groups (reported as p-values in Table 4). These landmark subsets were designed to reflect specific anatomical regions and regions with origins from each of the vesicles of the embryological neural tube. Differences in overall shape of regions defined by these subsets are estimated to test the null hypotheses of similarity in shape: the null hypothesis is that the mean forms being compared are the same (i.e., the ratios of all linear distances are equal to a constant) for the linear distances in a given subset. A non-parametric bootstrapping algorithm is used to test for statistically significant overall form differences between samples (Lele, 1991). The procedure for statistically comparing two forms is simple. For example, one has two hypothetical samples, A and B, of sample sizes 10 and 8, respectively. First, FDMs are calculated for the two samples. The test statistic (Tobs) is then calculated, where Tobs is equal to the maximum element of the FDM to the minimum element of the FDM (Tobs =max /min). To obtain a null distribution of T, one sample is chosen as a reference sample; in this case, sample A is chosen as the reference sample, as it has the greater sample size. Ten individuals are chosen randomly and with replacement from sample A and called A1. Eight individuals are then chosen randomly and with replacement, again from sample A, and called B1. A T-value is then calculated for this bootstrapped sample. This procedure is repeated 10,000 times, resulting in a distribution of 10,000 T-values. If the value of Tobs lies in the upper α% of the distribution, the null hypothesis is rejected. In this study, null hypothesis testing for overall similarity in form is performed with α = 0.05 and 10,000 resamples. For a certain number of comparisons, one of the samples includes a single individual (see Table 1); in these cases, the nonparametric test essentially determines whether or not the lone individual could be drawn from a distribution created using the other sample (i.e., the human sample).
Table 3.
Landmark subsets used in tests of null hypothesis of similarity in shape.
| Landmark subset | Number of landmarks in subset |
Landmarks included in subset* |
|---|---|---|
| Frontal | 9 | 1, 2, 3, 4, 5, 6, 13, 22, 23 |
| Cortical surface | 12 | 1, 2, 3, 4, 5, 6, 7, 8, 9, 10, 11, 12 |
| Parieto-temporal | 8 | 7, 8, 9, 10, 24, 25, 26, 27 |
| Hindbrain | 4 | 14, 15, 20, 21 |
| Internal forebrain | 9 | 13, 22, 23, 24, 25, 26, 27, 28, 29 |
| Parieto-occipital | 8 | 9, 10, 11, 12, 24, 25, 28, 29 |
Landmarks whose definitions are presented in Table 2 and illustrated in Figure 1.
Table 4.
Results of null hypothesis testing for differences in form between humans and all other groups for six landmark subsets.
| Landmark subset | All apes | Great apes |
Bonobos | Chimpanzees | Gorillas | Orangutans | Gibbons | |
|---|---|---|---|---|---|---|---|---|
| Frontal | Males | 0.041* | 0.243 | 0.284 | 0.072 | 0.001** | 0.068 | 0.030* |
| Females | 0.006* | 0.116 | 0.027* | 0.225 | 0.009* | 0.091 | 0.021* | |
| Cortical surface |
Males | 0.002** | 0.004** | 0.017* | 0.064 | 0.001* | 0.267 | 0.001** |
| Females | 0.002** | 0.001** | 0.001** | 0.012* | 0.018* | 0.007* | 0.004** | |
| Hindbrain | Males | 0.012* | 0.086 | 0.934 | 0.355 | 0.043* | 0.064 | 0.001** |
| Females | 0.058 | 0.003** | 0.015* | 0.002** | 0.006* | 0.001** | 0.251 | |
| Internal forebrain |
Males | 0.001** | 0.002** | 0.014* | 0.012* | 0.111 | 0.190 | 0.005* |
| Females | 0.004** | 0.006* | 0.041* | 0.019* | 0.244 | 0.003** | 0.061 | |
| Parieto- temporal |
Males | 0.006* | 0.017* | 0.021* | 0.203 | 0.797 | 0.360 | 0.020* |
| Females | 0.007* | 0.004** | 0.047* | 0.150 | 0.035* | 0.178 | 0.007* | |
| Parieto- occipital |
Males | 0.190 | 0.184 | 0.141 | 0.560 | 0.780 | 0.683 | 0.077 |
| Females | 0.024* | 0.190 | 0.248 | 0.146 | 0.706 | 0.045* | 0.082 | |
Each column represents comparisons between humans and the groups listed in the first row.
indicates significant differences (p ≤ 0.05);
indicates significant differences after Bonferroni corrections for multiple comparisons (p < 0.0042).
In order to correct for multiple comparisons, protected probabilities are presented, following Leigh and Jungers (1994). As there are six landmark subsets that are tested for both males and females, the appropriate critical value is equal to 0.05/12 = 0.0042. The means for adjusting alpha values when performing multiple comparisons has recently come under scrutiny (e.g., Perneger, 1998; Nakagawa, 2004). The more detailed the investigation, the less likelihood of finding a statistical difference due to substantial reductions in power with the reduction in alpha. However, as stated by Garcia (2004), some reasonable control of alpha inflation is required with large numbers of comparisons. Therefore, p-values are assessed for significance in two ways, both at 0.05 and 0.0042 (Table 5).
Table 5.
Groups of significantly different linear distances in humans.
| Brain region | Linear distance |
Apes/Great apes |
Bonobos | Chimpanzees | Gorillas | Orangutans | Gibbons |
|---|---|---|---|---|---|---|---|
| Significantly smaller in humans | |||||||
| Amygdalae | 26–27 | 0.79 | 0.78 | 0.89 | • 0.91 | 0.74 | 0.70 |
| 14–26 | 0.83 | 0.82 | 0.86 | • 0.94 | 0.80 | 0.77 | |
| 14–27 | 0.83 | 0.84 | 0.87 | • 0.93 | 0.80 | 0.74 | |
| 15–26 | 0.80 | 0.82 | 0.81 | 0.83 | 0.75 | 0.78 | |
| 15–27 | 0.81 | 0.85 | 0.80 | 0.81 | 0.77 | 0.78 | |
| 22–26 | 0.83 | 0.83 | 0.81 | 0.82 | • 0.91 | 0.77 | |
| 23–27 | 0.80 | 0.79 | 0.79 | 0.85 | 0.83 | 0.76 | |
| 24–26 | 0.84 | • 0.92 | 0.82 | 0.89 | 0.79 | 0.79 | |
| 25–27 | 0.82 | 0.88 | 0.81 | 0.87 | 0.74 | 0.81 | |
| Fronto- parietal region |
3–7 | • 0.94 | 0.90 | • 0.94 | • 0.92 | • 0.97 | • 1.02 |
| 4–8 | 0.80 | 0.78 | 0.80 | 0.76 | 0.81 | 0.83 | |
| 5–9 | • 0.90 | 0.80 | • 0.89 | • 1.00 | 0.78 | • 1.15 | |
| 6–10 | • 0.87 | 0.74 | 0.82 | ⋆ 1.27 | • 0.98 | 1.16 | |
| 3–9 | 0.81 | 0.72 | 0.85 | 0.82 | • 0.84 | 0.83 | |
| 4–10 | 0.88 | 0.81 | 0.88 | 0.88 | 0.86 | • 0.99 | |
| Occipital region |
11–12 | 0.81 | 0.85 | • 0.91 | 0.88 | • 0.80 | 0.62 |
| 28–29 | 0.80 | 0.70 | 0.82 | 0.87 | 0.88 | 0.82 | |
| 11–28 | 0.82 | 0.68 | • 1.10 | • 1.00 | • 0.91 | 0.65 | |
| 12–29 | • 0.93 | 0.78 | • 1.05 | ⋆ 1.18 | • 0.90 | • 0.95 | |
| 11–29 | 0.87 | 0.77 | • 0.96 | • 1.09 | 0.86 | 0.84 | |
| 12–28 | 0.81 | 0.72 | • 0.98 | 0.90 | 0.87 | 0.68 | |
| Significantly greater in humans | |||||||
| Frontal region |
1–2 | 1.35 | 1.18 | 1.27 | 2.29 | 1.30 | 1.74 |
| 1–3 | 1.14 | 1.15 | 1.15 | 1.12 | 1.24 | • 1.05 | |
| 2–4 | 1.17 | 1.22 | 1.19 | 1.11 | 1.23 | • 1.07 | |
| 1–4 | 1.19 | 1.21 | 1.19 | 1.23 | 1.21 | 1.14 | |
| 2–3 | 1.15 | 1.13 | 1.16 | 1.18 | 1.20 | 1.10 | |
| 1–13 | 1.11 | 1.16 | • 1.06 | 1.15 | 1.12 | • 1.07 | |
| 2–13 | 1.10 | 1.14 | • 1.06 | 1.11 | 1.13 | • 1.06 | |
| 1–22 | 1.13 | 1.12 | 1.12 | 1.15 | 1.21 | • 1.08 | |
| 2–23 | 1.12 | 1.10 | 1.15 | 1.13 | 1.21 | • 1.05 | |
| 1–5 | 1.17 | 1.23 | 1.21 | • 1.04 | 1.21 | • 1.04 | |
| 2–6 | 1.20 | 1.31 | 1.33 | • 0.97 | 1.11 | • 1.07 | |
| 1–6 | 1.21 | 1.33 | 1.29 | • 1.03 | 1.13 | 1.11 | |
| 2–5 | 1.16 | 1.22 | 1.20 | • 1.06 | 1.21 | • 1.06 | |
| Intraparietal sulcus |
9–10 | 1.14 | 1.23 | 1.11 | • 1.09 | • 0.97 | 1.25 |
| 9–28 | 1.12 | 1.19 | • 1.03 | • 0.97 | • 0.98 | 1.38 | |
| 10–29 | • 1.05 | 1.12 | • 1.02 | • 0.92 | • 1.07 | • 1.06 | |
The first column refers to the anatomical region spanned by the linear distances between landmarks listed in Column 2. Values within the remainder of the cells indicate the ratio with respect to that specific linear distance, with the human sample as the numerator. The column entitled, “Apes/Great apes” collapses the human vs. all other apes and human vs. other great apes comparisons into a single column, as the average ratios were the same in the two comparisons.
indicates ratios that are not significantly different.
indicates ratios that are significantly greater in humans for a particular comparison, when the remainder of the comparisons for that ratio are significantly smaller.
Additionally, ratios of like linear distances in an FDM alone do not provide a statistical evaluation of the difference; therefore, a non-parametric bootstrapping algorithm calculates confidence intervals for each discrete linear distance to test for significant localized form differences (Lele and Richtsmeier, 1995). The null hypothesis of this test is that the discrete linear distance is similar in the two samples.
Following the above example, samples A and B are of sample sizes 10 and 8, respectively. From sample A, 10 individuals are chosen randomly and with replacement; from sample B, 8 individuals are chosen randomly and with replacement. An FDM is obtained as described above using these bootstrapped samples, and the process is repeated 10,000 times, resulting in 10,000 FDMs composed of 10,000 ratios for each discrete linear distance between landmarks. For each linear distance, the lowest and the highest α/2% of the ratios are removed: the lowest and highest remaining ratios constitute the upper and lower limits of the confidence interval. If this interval includes 1, the null hypothesis cannot be rejected and the linear distance is not considered significantly different in the two samples. If the interval does not include 1, the null hypothesis is rejected, and the linear distance is considered to be significantly different. Confidence interval testing was performed in this study with α = 0.10 (two-tailed) and 10,000 resamples were performed.
This test of empirical differences in shape between samples is based on marginal confidence intervals of bootstrap estimates of linear distances between unique pairs of landmarks. Bonferroni-type corrections are not needed for these marginal confidence intervals because this approach does not conduct multiple tests of linear distance differences using the same data. Instead, with each bootstrapping step, all measures are estimated for an individual and tested in a high-dimensional space where each dimension represents a unique linear distance. The low-dimensional projection of these results for each linear distance is reported (for details, see Lele and Richtsmeier, 1995, 2001).
In this study, individual linear distances were considered significantly different if the calculated two-tailed 90% confidence interval did not include 1.0 and the mean forms differed by 10% or more. The combination of an overall test for statistical differences in shape, and confidence intervals for differences in specific linear distances, enables evaluation of gross differences in shape, as well as the localization of differences to specific neural regions.
Finally, a Principal Coordinates Analysis (PCOORD) application of EDMA was performed on the scaled data for all individuals and all landmarks (Richtsmeier et al., 1998; Lele and Richtsmeier, 2001). This procedure is a form of clustering analysis, which finds groups of forms with similar shapes and identifies linear distances that are influential in forming the defined clusters. Using PCOORD, all individuals are analyzed simultaneously. This procedure examines the distribution of individuals in multidimensional morphological space. Unlike the form difference analyses described above, PCOORD compares individuals rather than samples. The first step in this analysis is a calculation of dissimilarity between all possible pairs of individuals, expressed as a single number . This results in a matrix of dissimilarity measures. Second, an eigenanalysis is applied to this dissimilarity matrix, yielding an eigenvector coefficient for each individual. These coefficients are projected into form space defined by the principal coordinates analysis, resulting in an ordination of the individuals. Orthogonal axes are then fitted through this space such that the first axis accounts for the majority of the variation, the second axis accounts for the second-largest amount of variation, and so on. These axes are referred to as the first principal axis, the second principal axis, etc. The position of individuals along these axes is defined in terms of the linear distances between landmarks most highly correlated with these axes; therefore, individuals that cluster along a particular axis are similar in terms of the linear distances correlated with that axis. This analysis was performed to determine whether or not individuals clustered on the basis of brain morphology, to identify the metrics that contributed to determination of the clusters, and to explore the nature of the clusters in order to formulate hypotheses about the pattern of hominin brain evolution.
Results
Results of null hypothesis testing for each set of comparisons for both sexes are reported as p-values in Table 4. Since differences in the results of analyses were not marked between males and females (and there were more males than females), results for males are discussed and illustrated in detail. In the few instances where results for males and females are discordant, both results are discussed.
Comparisons 1 and 2: humans vs. all non-human apes; humans vs. other great apes
Tests were performed to compare humans to great apes and to compare humans to all apes (including gibbons). The p-values for tests of the null hypothesis of similarity in shape indicate significant differences between humans and all other apes for five of the six landmark subsets in males; the parieto-occipital subset does not differ significantly (p ≤ 0.05; Table 4). In contrast, three of the six subsets differ significantly in comparisons of humans and great apes (cortical surface, internal forebrain, and parieto-temporal), and the hindbrain subset neared significance (p = 0.086) in males. In females, the cortical surface, parieto-temporal, hindbrain, and internal forebrain subsets differ significantly in comparisons of both apes and great apes with the human sample; the frontal and parieto-occipital subsets do not significantly differ.
Interestingly, confidence interval testing produces identical patterns of significant differences (p ≤ 0.10) for specific linear distances whether or not gibbons are included in the analyses, and identical patterns of differences in comparisons of landmark subsets in male samples and female samples. Significant differences between humans and apes are observed in the frontal and parietal cortex and underlying subcortical structures (Figure 2, SOM Figure 1). Humans display frontal regions that are expanded anteroposteriorly and mediolaterally as compared to apes, specifically between the frontal poles, frontal sulci, and caudate nuclei. The parietal cortex also differs substantially, showing distinct differences in the placement of the terminations of the intraparietal sulci relative to other cortical landmarks. Further, a mediolateral constriction is evident between structures located below the cortex in the parietal and occipital regions in humans, specifically between the right and left thalami. The amygdalae are placed more inferiorly and laterally in apes as compared to humans. Finally, the distance between the occipital poles is greater in apes as compared to humans.
Figure 2. Results of comparisons between humans and ape species.
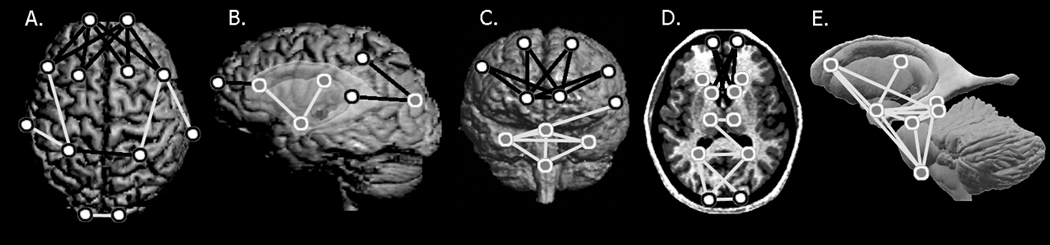
Statistically significant differences between humans and non-human apes are illustrated on a human individual chosen from the study sample; this individual is not meant to represent a mean form. A) superior cerebral surface; B) left lateral surface with ghosted subcortical structures; C) anterior surface; D) axial slice; and E) a model of subcortical structures. Landmarks are defined in Table 2. White dots rimmed in black indicate landmarks located on the cortical surface; subcortical landmarks are represented by gray dots rimmed in white. Lines illustrated here indicate linear distances that are both significantly different by confidence interval testing and at least 10% greater (black), or 10% smaller (white) in humans.
Comparison 3: humans vs. bonobos
Of the six landmark subsets, three differ significantly between the male humans and male bonobos (p ≤ 0.05; Table 4), including cortical surface, internal forebrain, and parieto-temporal. In females, five of the six subsets differ significantly, but, in contrast to the males, the hindbrain and frontal subsets differ significantly. Despite the regional difference in the results of null-hypothesis testing, the linear distances that differ significantly between humans and bonobos are similar in pattern and magnitude in both sexes.
Significant differences between humans and bonobos are observed in the frontal and parietal cortex, and in underlying subcortical structures (Figure 3, SOM Figure 2). Humans exhibit a mediolaterally and anteroposteriorly expanded frontal region relative to bonobos, specifically between the frontal poles, frontal sulci, and caudate nuclei. The parietal region in humans also differs, showing distinct anterolateral displacements of the terminations of the intraparietal sulci. Mediolaterally-oriented linear distances between subcortical structures in the parieto-occipital region are shorter in humans relative to bonobos, particularly between the thalamic nuclei and posterior horns of the lateral ventricles. In contrast, anteroposteriorly-oriented linear distances that extend from the genu of the corpus callosum, caudate nuclei, and thalami, to the posterior horns of the lateral ventricles, are longer in humans relative to bonobos, indicating a posterior displacement of the posterior lateral ventricles in humans. The amygdalae are located more inferiorly and laterally in bonobos as compared to humans. Finally, the distance between the occipital poles is greater in bonobos as compared to humans.
Figure 3. Results of comparisons between humans and each ape species.
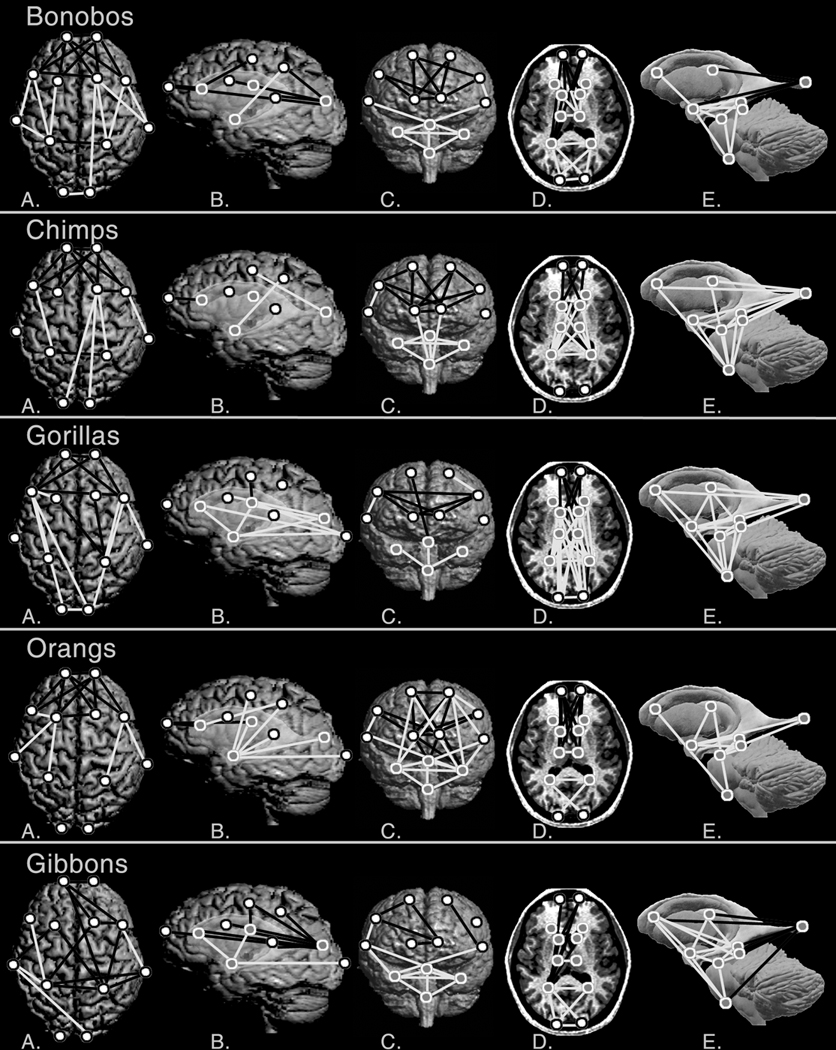
A) superior cerebral surface; B) left lateral surface with ghosted subcortical structures; C) anterior surface; D) axial slice; and E) a model of subcortical structures. Landmarks are defined in Table 2. Symbols and line colors are as in Figure 2.
Comparison 4: humans vs. chimpanzees
Only one of the six landmark subsets, the internal forebrain subset, differs significantly between male humans and male chimpanzees (p ≤ 0.05; Table 4), although the frontal and cortical surface subsets trend toward significance (p ≤ 0.10). Among the females, the cortical surface, hindbrain, and internal forebrain subsets differ significantly. Despite the differences in the results of null hypothesis testing for specific subsets, the linear distances that differ significantly between humans and chimpanzees are similar in pattern in both sexes, differing only in magnitude.
Regardless of the limited differences in the overall shape of particular regions, numerous individual linear distances differ significantly between humans and chimpanzees. Significant differences are observed in the frontal and parietal cortex, and in parietal and temporal subcortical structures (Figure 3, SOM Figure 2). Humans demonstrate relatively longer distances between landmarks located in the frontal poles, frontal sulci, and caudate nuclei, resulting in an anteroposteriorly and mediolaterally expanded frontal region. Chimpanzees present an anteroposteriorly expanded parietal region as compared to humans, particularly on the right side, as evidenced by displacements of the intraparietal sulci, the right Sylvian fissure, and occipital poles. The anteroposterior expansion of this region in the chimpanzee brain is also evident subcortically, as evidenced by increased distances between the genu of the corpus callosum, caudate nuclei, thalami, and the posterior lateral ventricles. In contrast, humans show mediolaterally expanded parietal cortices as characterized by the increased distance between the terminations of the intraparietal sulci. Finally, the amygdalae are located more inferiorly and laterally in chimpanzees as compared to humans.
Comparison 5: humans vs. gorillas
At least three of the six landmark subsets (the frontal, cortical surface, and hindbrain) differ significantly between male humans and male gorillas (p ≤ 0.05; Table 4), while the internal forebrain and parieto-occipital subsets do not differ significantly. One subset differs significantly in females but not in males (the parieto-temporal). Despite the differences in the results of null-hypothesis testing for the parieto-temporal subset, the linear distances that differ significantly between humans and gorillas are similar in pattern in both sexes, differing only in magnitude.
Humans have a mediolaterally- and anteroposteriorly expanded frontal region as compared to gorillas, evident in the relationship between the frontal poles and the frontal sulci (Figure 3, SOM Figure 2). In contrast, the parieto-occipital region is anteroposteriorly truncated in humans as compared to gorillas, evident in both the cortex and subcortical structures. These differences are evident in the cortex in relationships between the frontal sulci, the intraparietal sulci, and the occipital poles. Subcortically, the truncation of the parieto-occipital region is evident in the relationships of the caudate nuclei, thalami, posterior lateral ventricles, and the occipital poles.
Comparison 6: humans vs. orangutans
None of the six landmark subsets differs significantly between the male humans and the male orangutans (p ≤ 0.05; Table 4), although the frontal and hindbrain subsets trend toward significance (p ≤ 0.10). Four subsets (hindbrain, cortical surface, internal forebrain, and parieto-occipital) differ significantly in females, and the frontal subset trends toward significance (p ≤ 0.10). Despite the differences in the results of null-hypothesis testing for these subsets, the linear distances that differ significantly between humans and orangutans are similar in pattern in both sexes, differing only in magnitude.
Humans again demonstrate an anteroposteriorly and mediolaterally expanded frontal region as compared to orangutans, seen in the expansion of the spatial relationships of the frontal poles, frontal sulci, genu of the corpus callosum, and the caudate nuclei (Figure 3, SOM Figure 2). Humans have a superoinferiorly shortened parieto-temporal region relative to orangutans, as seen by the relationship of superiorly located cortical landmarks (frontal and intraparietal sulci) to subcortical structures in the parietal and temporal regions (amygdalae). Humans also present an anteroposteriorly truncated posterior frontal/anterior parietal region (note relationships between frontal sulci, intraparietal sulci, and Sylvian fissures), and a mediolaterally constricted occipital region (relationships between the posterior lateral ventricles and occipital poles) compared to Pongo.
Comparison 7: humans vs. gibbons
The shapes of those regions defined by five of the six landmark subsets differ significantly between male humans and gibbons, with the parieto-occipital subset trending toward significance (Table 4). Three subsets differ significantly in females, the frontal, cortical surface, and parieto-temporal subsets, and the internal forebrain and parieto-occipital subsets trend toward significance. Despite the differences in the results of null-hypothesis testing for these two subsets, the linear distances that differ significantly between humans and gibbons are similar in pattern in both sexes, differing only in magnitude.
Humans again have a mediolaterally expanded frontal region compared to gibbons, as seen in the relationships between contralateral frontal sulci and frontal poles (Figure 3, SOM Figure 2). In contrast, the occipital region is constricted mediolaterally in humans relative to gibbons, evident in the relationships between the occipital poles and the posterior lateral ventricles. The amygdalae are located more inferiorly and laterally in gibbons as compared to humans. Finally, the posterior frontal/anterior parietal cortex is expanded anteroposteriorly and mediolaterally in humans compared to gibbons, seen in the relationships between the intraparietal sulci, the Sylvian fissures, and their relationships to the frontal sulci.
Summary of differences between non-human apes and humans
Inspection of the results of comparing humans to each of the other ape species in turn reveals a common pattern of characteristics that are unique to humans. The suite of characters that distinguish humans from non-human apes includes features in multiple regions of the brain (Table 5). This common pattern includes differences in the frontal, parietal, temporal, and occipital regions; these differences are found both cortically and subcortically, including both larger and smaller linear distances in humans as compared to other apes. First, there is an anteroposterior expansion of the frontal region, both cortically and subcortically, in humans relative to other apes: the cortical manifestation of the expansion is particularly evident in the dorsolateral aspect. Second, there is an anteroposterior truncation of the posterior frontal/anterior parietal region, and a subcortical mediolateral constriction in the parieto-occipital and temporal regions in humans. These commonalities point to a uniquely human pattern of brain morphology, reflecting changes in the relationships of one region to another; in effect, a reorganization of brain morphology.
These characteristics are a subset of those determined to be significantly different when the ape species are pooled in comparison to humans. The rule defined for significance in this study required that the ratio lie outside of the 90% confidence interval and that the ratio differed by at least 10%. In the pooled comparisons, species that differ substantially from humans raise the magnitude of the average difference. For example, the linear distance between landmarks 9 and 10 differs significantly between humans and the rest of the apes as a group, yet it does not differ significantly between humans and orangutans, and though it is statistically significantly different, it does not meet the 10% threshold in comparisons between humans and gorillas. Thus, both sets of analyses are important to understanding varying aspects of differences between humans and other ape species.
Principal coordinates analysis
A principal coordinates analysis that included information from all landmarks was performed using individuals from all six species (Figure 4a, SOM Figure 3). Males and females were analyzed separately, and, in both analyses, the data were scaled as described above. Human brain morphology only clusters separately from that of other ape species along the first principal axis. Position along the first axis is strongly negatively correlated with mediolaterally-oriented linear distances that span the frontal region, specifically connecting the caudate nuclei and inferior frontal sulci with the frontal poles (Figure 4b, SOM Figure 3). First axis position is strongly positively correlated with linear distances that join the amygdalae with structures located on the medial aspect of the brainstem, as well as linear distances joining the amygdalae with the ipsilateral caudate nuclei and thalami, and with the contralateral Sylvian fissures. This indicates that humans have mediolaterally broader frontal regions subcortically, and that the position of the temporal poles (amygdalae) differs relative to other apes.
Figure 4. Results of Principal Coordinates Analysis.

A) Plot of each individual’s scores on the first two principal coordinate axes in analysis of male individuals (results of analysis of female individuals produced results not markedly different from that of the males). B) Illustration of linear distances showing high correlations with scores on Axis 1. Lines illustrated here indicate linear distances showing correlation values of >0.70 (white) and <−0.70 (black).
Discussion
This study describes a pattern of brain morphology that is uniquely human among the apes, and finds that it is not isolated to a single region or to cortical features alone, but involves many parts of the brain, both internal and external. Further, some patterns of neural morphology are consistently different between all non-human apes and humans, while others uniquely distinguish humans from a given ape species. This indicates that human brain evolution has not been limited to simple scaling of ape brain morphologies, either overall or in specific regions, but has involved substantial shifts in morphology, with each region changing in unique ways. These results support the assertions by Hofman (1989), who stated that the differential growth of certain regions of the brain over the course of human evolution has been associated with changes in overall geometry. This is precisely what is described in this study. In fact, recent studies show that functionally-linked brain structures evolve size changes together (Barton and Harvey, 2000; de Winter and Oxnard, 2001), showing the clearly integrated nature of brain structure, growth, and evolution. This suggests that although brain morphology has evolved in a coordinated and concerted manner, the various anatomical and functional regions of the brain have changed their morphologies in distinct patterns.
A great number of studies of human brain evolution have focused on the frontal lobe and, specifically, the prefrontal region, as this has been thought of as the seat of many executive functions viewed as uniquely human. Though it is clear that the absolute size of the frontal lobe as a whole is larger in humans than in other hominoids (e.g., Deacon, 1990; Semendeferi et al., 1997), its relative size has been found to be similar to that expected for an ape brain of human size (e.g., Holloway, 1964, 1968; Semendeferi et al., 1997; Schoenemann, 2006). When the prefrontal region is assessed alone, however, results have been mixed (e.g., Blinkov and Glezer, 1968; Uylings and van Eden, 1990; Deacon, 1997; Semendeferi et al., 1997, 2001; Passingham, 2002; Schenker et al., 2005; Schoenemann et al., 2005; Sherwood et al., 2005), potentially as a result of differences in how data sets were scaled, as well as differences in definitions of what comprises the “frontal lobe” or “prefrontal region” both within a species as well as across multiple species (Semendeferi et al., 1997, 2002).
This study defined cortex anterior to the central sulcus as frontal cortex, and cortex anterior to the precentral sulcus as prefrontal cortex, with landmarks located at the intersections of the precentral sulcus with the inferior and superior frontal sulci demarcating this boundary. Results of the present study indicate that overall morphology of the prefrontal region differs markedly in humans as compared to other apes. Specifically, the present study describes differences evident in the dorsolateral region, both cortically and subcortically (see Figures 2 and 3), suggesting reorganization of both the surface and subcortical components of this region. This reorganization is evident particularly in the relationships among structures within the prefrontal cortex, as opposed to between prefrontal structures and those in other regions of the brain. These results complement and add to those of Bruner and Holloway (2010), who described a spatial reallocation of frontal cortex volume, particularly as increased frontal width.
Language is a uniquely human cognitive function. Recent molecular studies have discovered that a mutation of the FOXP2 gene results in language deficits (Enard et al., 2002; Lai et al., 2003). This gene is expressed in the frontal cortex and basal ganglia during development and in adulthood (Lai et al., 2003; Takahashi et al., 2003). This study has demonstrated a uniquely human pattern of morphology in the relationships between the frontal cortex and basal ganglia, suggesting that these changes in organization reflect language function. It is possible that the structural influence of FOXP2 is observed in the morphological differences in the prefrontal cortex and basal ganglia between humans and other apes in the present study.
Importantly, the magnitude of the linear distances that differed significantly among humans and apes in the parietal, occipital, and temporal regions is equal to the magnitude of the linear distances in the frontal region in distinguishing humans from other ape species. Though the frontal lobe has clearly undergone evolutionary change, this change has not occurred alone. The finding of multi-focal changes in morphology supports the findings of previous studies, such as those of Rilling et al. (2007), who found that differences in neural activity between humans and chimpanzees are seen in numerous cortical areas. Thus, both morphology and activity have changed in humans at multiple locations as compared to other apes. This suggests a reorganization of structure and connectivity.
The results described here include an anteroposterior truncation of the posterior frontal/anterior parietal region in humans. This complements results of previous studies that described expansion of the parietal region in humans as compared to other apes, as estimated from the position of the lunate sulcus (Holloway, 1984; Falk, 1989). While the present study uses unique boundaries of the parietal region, our findings are congruent with others. The most posterior aspect of the parietal region that is assessed in the present study is described by the intersection of the intraparietal sulcus with the postcentral sulcus rather than with the lunate sulcus. Position of the lunate sulcus was not used in this study; the lunate sulcus is not consistently present in humans, and there is a high degree of variability in humans when it is present (Connolly, 1950; Allen et al., 2006). Further, it is possible that this sulcus does not always delineate functionally homologous areas in humans and apes (Allen et al., 2006). However, despite differences in measures of the parietal region, interpretations of evolutionary changes for this region are not necessarily in conflict, and are actually quite similar. The anterior aspect of the intraparietal sulcus may be located more anteriorly in humans, while its posterior aspect relating to the position of the lunate sulcus may also be located more posteriorly. Though this hypothesis remains to be tested, it has important implications for differences in function that may be associated with changes in both anterior and posterior parietal structures. For example, Peeters et al. (2009) found in a fMRI study that a portion of the anterior intraparietal region was activated during tool use, where it was inactive in rhesus macaques.
Recently, the temporal lobe has received increased attention in studies relating to human brain evolution (e.g., Rilling and Seligman, 2002). Analyses of the volume of the temporal lobe are not in agreement as to whether or not it is different in humans (e.g., Semendeferi and Damasio, 2000; Rilling and Seligman, 2002; Schenker et al., 2005; Schoenemann et al., 2005; Sherwood et al., 2005). This study identified differences in the location of the amygdalae, located within the temporal poles (Figures 2 and 3). Differences in the position of the amygdalae are equally influential in distinguishing the overall morphology of the human brain from that of non-human apes. Barger et al. (2007) found that various nuclei of the amygdala are larger in humans, and suggested changes in interconnected areas of the cortex. Rilling et al. (2008) described modified connections of the temporal lobe with the left frontal cortex. Considered together, this may indicate an expansion of the temporal lobe and increased importance of the amygdala in humans and human brain evolution.
In addition to patterns of morphology distinguishing apes as a group separate from humans, there are also characteristics that uniquely distinguish each of the non-human hominoid species from humans that are not part of the overall hominoid pattern. For example, chimpanzees and gorillas differ substantially from humans in the subcortical parietal regions, while orangutans show greater differences from humans in the superoinferior location of the temporal poles, as indicated by the locations of the orangutan amygdalae. Gorillas show a distinctive anteroposterior elongation of non-frontal cerebral structures relative to humans. These species-specific differences indicate the development of unique patterns of neural morphology relative to humans. As neural tissue is evolutionarily and metabolically expensive (Aiello and Wheeler, 1995; Schoenemann et al., 2005), these species distinctions in patterns of morphology reflect changes in development of the overall structure in the divergent evolution of the species. However, the evolutionary processes responsible for the morphologies distinguishing humans from other ape species cannot be determined from these analyses.
The uniquely human pattern of brain morphology described here may serve as the basis for mental and cognitive disorders observed only in humans. Landmark-based analyses similar to those employed in this study have discovered changes in the brain associated with mental disorders (e.g., DeQuardo et al., 1999; Hennessy et al., 2005). Schizophrenia has been described as a disease of association areas of the cerebral cortex, including frontal, parietal, and temporal regions (Pearlson et al., 1996; Ross and Pearlson, 1996). Each of these areas is morphologically distinct in humans, perhaps providing a substrate for the biological processes responsible for mental illnesses. Additionally, similar methods are being employed in studies of human variation (e.g., gender differences) (Ozdemir et al., 2007) and craniofacial disorders such as cleft palate (Weinberg et al., 2009).
Potential limitations of this study
Sample size is an important component to the validity of any study. Though sample sizes were adequate for statistical testing of the null hypothesis, the numbers of nonhuman primate individuals included in this study were small. Small sample size reduces the chances that the true population characteristics are being represented (Sherwood et al., 2004). Unfortunately, this problem is beyond control for this particular analysis as these are the only in vivo MRI data available for study. For a certain number of these comparisons, one of the samples includes a single individual (see Table 1). In these cases, our nonparametric test essentially determines whether or not the lone individual could be drawn from a distribution created using the other sample (i.e., the human sample). Increased sample size would change the range of variation in the small samples, potentially altering statistically significant differences, however, this remains to be tested.
This study demarcated cortical surface boundaries on the basis of sulcal morphology. Although sulcal morphology may not always coincide with cytoarchitectonic boundaries (Schenker et al., 2010), surface structural features are used to describe evolutionary patterns of change in fossil species via endocast analysis. Additionally, although it has not been possible to mark cytoarchitectonic boundaries in vivo, there have been a few studies that have managed to accomplish this successfully. For example, previous studies have found that the lunate sulcus defines the boundary of the primary visual cortex in hominoids (Holloway et al., 2003; de Sousa et al., 2010). Therefore, the use of surface features is the best option available for in vivo study, and is relevant to endocast analyses.
Conclusions
Neural morphology is reflective of the relative connectivity between structures and is intimately related to functionality (Deacon, 1990; Aboitiz, 1996). Changes in morphology may be associated with differences in specific functions (Deacon, 1990; Aboitiz, 1996; Holloway, 2002b; Healy and Rowe, 2007). Each of the unique patterns of morphology quantified here may reflect different evolutionary processes (i.e., selection pressures, adaptation, etc.) involved in the phylogenetic divergence of humans from apes. Given that the distinguishing features of each group are not localized to a single region, or to the cortex alone, the evolution of the brain in humans is not accomplished by isolated change in any specific structure, but rather by multiple changes in various regions of the brain occurring perhaps sequentially or in tandem. Further, regardless of similarities and differences in the relative sizes of brain regions (Gannon et al., 1998; Semendeferi and Damasio, 2000; Clark et al., 2001; Semendeferi et al., 2002; Schoenemann et al., 2005), distinct patterns of internal and external morphology distinguish the human brain from the brains of non-human apes.
Results of this study also indicate that, although there is a pattern of morphology that uniquely defines the human brain, there are also patterns that uniquely differentiate each non-human ape species. The differences in morphology described here may be reflective of selection for patterns of growth within and/or between component brain structures (Holloway, 1979). This suggests that the overall enlargement observed in the human brain may be a secondary consequence (Deacon, 1988) or a correlated adjustment of this reorganization (Hofman, 1989). While change in structure may not always equate to change in function (Rilling and Insel, 1999), the identification of unique patterns of neural morphology and the localization of these differences to particular structures defined by this study, provide working hypotheses pertaining to potential functional differences among ape species.
For example, both morphology and activity have changed in humans at multiple locations as compared to other apes, suggesting a concomitant reorganization of structure and connectivity. Additionally, the uniquely human pattern of morphology in the relationships between the frontal cortex and basal ganglia may reflect the structural influence of FOXP2, and consequently, language function. Another hypothesis is that the evolution of the parietal lobe may be characterized by changes in both the intraparietal sulcus and the lunate sulcus, implying that differences in function may be associated with changes in both anterior and posterior parietal structures. This study also points to an expansion of the temporal lobe, and increased importance of the amygdala in humans and human brain evolution. Finally, the species-specific differences described here indicate the development of unique patterns of neural morphology relative to humans. As neural tissue is evolutionarily and metabolically expensive (Aiello and Wheeler, 1995; Schoenemann et al., 2005), these species distinctions in patterns of morphology reflect changes in development of the overall structure in the divergent evolution of the species, potentially as a result of selection for patterns of growth within and/or between component brain structures. Testing these hypotheses may lead to the identification of environmental, developmental, and phylogenetic factors that have contributed to making the human brain unique.
Supplementary Material
Statistically significant differences between humans and non-human apes are illustrated on a human individual chosen from the study sample; this individual is not meant to represent a mean form. A) superior cerebral surface; B) left lateral surface with ghosted subcortical structures; C) anterior surface; D) axial slice; and E) a model of subcortical structures. Landmarks are defined in Table 2. White dots rimmed in black indicate landmarks located on the cortical surface; subcortical landmarks are represented by gray dots rimmed in white. Lines illustrated here indicate linear distances that are both significantly different by confidence interval testing and at least 10% greater (red), or 10% smaller (blue) in humans.
A) superior cerebral surface; B) left lateral surface with ghosted subcortical structures; C) anterior surface; D) axial slice; and E) a model of subcortical structures. Landmarks are defined in Table 2. Symbols and line colors are as in Figure 2.
A) Plot of each individual’s scores on the first two principal coordinate axes in analysis of male individuals (results of analysis of female individuals produced results not markedly different from that of the males). B) Illustration of linear distances showing high correlations with scores on Axis 1. Lines illustrated here indicate linear distances showing correlation values of >0.70 (blue) and <−0.70 (red).
Acknowledgements
This research was supported in part by NIH grants MH 60504 and P60 DE13078, and by the University of Missouri Department of Pathology & Anatomical Sciences. I am profoundly grateful for the generosity of those who shared their MRI data for this project. Drs. James Rilling and Thomas Insel and the Yerkes Regional Primate Center provided the non-human MRI data. Drs. Godfrey Pearlson and Patrick Barta provided the human MRIs from the Aging, Brain Imaging and Cognition (ABC) study, MEASURE software, and great advice. Anonymous reviewers, an Associate Editor, and Editor Dr. Steve Leigh supplied suggestions that greatly improved this paper. Dr. Joan Richtsmeier provided invaluable insight and discussion. Drs. Mark Mooney, David Weishampel, and Ralph Holloway provided helpful comments on a previous version of this manuscript.
Footnotes
Publisher's Disclaimer: This is a PDF file of an unedited manuscript that has been accepted for publication. As a service to our customers we are providing this early version of the manuscript. The manuscript will undergo copyediting, typesetting, and review of the resulting proof before it is published in its final citable form. Please note that during the production process errors may be discovered which could affect the content, and all legal disclaimers that apply to the journal pertain.
References
- Aboitiz F. Does bigger mean better? Evolutionary determinants of brain size and structure. Brain Behav. Evol. 1996;47:225–245. doi: 10.1159/000113243. [DOI] [PubMed] [Google Scholar]
- Aiello LC, Wheeler P. The expensive-tissue hypothesis: the brain and the digestive system in human and primate evolution. Curr. Anthropol. 1995;36:199–221. [Google Scholar]
- Aldridge K. Ph.D. Dissertation. The Johns Hopkins University; 2004. Organization of the human brain: development, variability and evolution. [Google Scholar]
- Aldridge K, Barta P, Pearlson G, Richtsmeier J. Brain morphology, MRI data, and landmark-based analyses of form. Am. J. Phys. Anthropol. Suppl. 2000;30:94. [Google Scholar]
- Allen J, Bruss J, Damasio H. Looking for the lunate sulcus: a magnetic resonance imaging study in modern humans. Anat. Rec. A Discov. Mol. Cell. Evol. Biol. 2006;288:867–876. doi: 10.1002/ar.a.20362. [DOI] [PubMed] [Google Scholar]
- Armstrong E. The ontogeny of human gyrification. Cereb. Cortex. 1995;1:56–63. doi: 10.1093/cercor/5.1.56. [DOI] [PubMed] [Google Scholar]
- Aylward E, Augustine A, Li Q, Barta P, Pearlson G. Measurement of frontal lobe volume on magnetic resonance imaging scans. Psychiatr. Res. 1997;75:23–30. doi: 10.1016/s0925-4927(97)00026-7. [DOI] [PubMed] [Google Scholar]
- Barger N, Stafanacci L, Semendeferi K. A comparative volumetric analysis of the amygadaloid complex and basolateral division in the human and ape brain. Am. J. Phys. Anthropol. 2007;134:392–403. doi: 10.1002/ajpa.20684. [DOI] [PubMed] [Google Scholar]
- Barta P, Dhingra L, Royall R, Schwartz E. Improving stereological estimates for the volume of structures identified in three-dimensional arrays of spatial data. J. Neurosci. Meth. 1997;75:111–118. doi: 10.1016/s0165-0270(97)00049-6. [DOI] [PubMed] [Google Scholar]
- Barton RA, Harvey PH. Mosaic evolution of brain structure in mammals. Nature. 2000;405:1055–1058. doi: 10.1038/35016580. [DOI] [PubMed] [Google Scholar]
- Blinkov S, Glezer I. The human brain in figures and tables. New York: Plenum Press; 1968. [Google Scholar]
- Bruner E, Holloway RL. A bivariate approach to the widening of the frontal lobes in the genus Homo. J. Hum. Evol. 2010;58:138–146. doi: 10.1016/j.jhevol.2009.10.005. [DOI] [PubMed] [Google Scholar]
- Buchanan R, Vladar K, Barta P, Pearlson G. Structural evaluation of the prefrontal cortex in schizophrenia. Am. J. Psychiatr. 1998;155:1049–1055. doi: 10.1176/ajp.155.8.1049. [DOI] [PubMed] [Google Scholar]
- Clark D, Mitra P, Wang S-H. Scalable architecture in mammalian brains. Nature. 2001;411:189–193. doi: 10.1038/35075564. [DOI] [PubMed] [Google Scholar]
- Connolly CJ. External morphology of the primate brain. Springfield, Illinois: C.C. Thomas; 1950. [Google Scholar]
- Darroch J, Mosimann J. Canonical and principal components of shape. Biometrika. 1985;72:241–252. [Google Scholar]
- de Winter W, Oxnard C. Evolutionary radiations and convergences in the structural organization of mammalian brains. Nature. 2001;409:710–714. doi: 10.1038/35055547. [DOI] [PubMed] [Google Scholar]
- Deacon T. Human brain evolution: II. Embryology and Brain Allometry. In: Jerison H, Jerison I, editors. Intelligence and Evolutionary Biology. Berlin: Springer-Verlag; 1988. pp. 363–382. [Google Scholar]
- de Sousa AA, Sherwood CC, Mohlberg H, Amunts K, Schleicher A, MacLeod CE, Hof PR, Frahm H, Zilles K. Hominoid visual brain structure volumes and the position of the lunate sulcus. J. Hum. Evol. 2010;58:281–292. doi: 10.1016/j.jhevol.2009.11.011. [DOI] [PubMed] [Google Scholar]
- Deacon TW. Rethinking mammalian brain evolution. Am. Zool. 1990;30:629–705. [Google Scholar]
- Deacon TW. What makes the human brain different? Ann. Rev. Anthropol. 1997;26:337–357. [Google Scholar]
- deQuardo JR, Keshavan MS, Bookstein FL, Bagwell WW, Green WDK, Sweeney JA, Haas GL, Tandon R, Schooler NR, Pettegrew JW. Landmark-based morphometric analysis of first-episode schizophrenia. Biol. Psychiatr. 1999;45:1321–1328. doi: 10.1016/s0006-3223(98)00181-4. [DOI] [PubMed] [Google Scholar]
- Enard W, Przeworski M, Fisher SE, Lai CS, Wiebe V, Kitano T, Monaco AP, Paabo S. Molecular evolution of FOXP2, a gene involved in speech and language. Nature. 2002;418:869–872. doi: 10.1038/nature01025. [DOI] [PubMed] [Google Scholar]
- Falk D. A reanalysis of the South African australopithecine natural endocasts. Am. J. Phys. Anthropol. 1980;53:525–539. doi: 10.1002/ajpa.1330530409. [DOI] [PubMed] [Google Scholar]
- Falk D. Ape-like endocast of "ape-man". Taung. Am. J. Phys. Anthropol. 1989;80:335–339. doi: 10.1002/ajpa.1330800307. [DOI] [PubMed] [Google Scholar]
- Falk D, Redmond JC, Jr, Guyer J, Conroy C, Recheis W, Weber GW, Seidler H. Early hominid brain evolution: a new look at old endocasts. J. Hum. Evol. 2000;38:695–717. doi: 10.1006/jhev.1999.0378. [DOI] [PubMed] [Google Scholar]
- Falsetti A, Jungers W, Cole TM. Morphometrics of the callitrichid forelimb: a case study in size and shape. Intl. J. Primatol. 1993;14:551–572. [Google Scholar]
- Gannon PJ, Holloway RL, Broadfield DC, Braun AR. Asymmetry of chimpanzee planum temporale: humanlike pattern of Wernicke's brain language area homolog. Science. 1998;279:220–222. doi: 10.1126/science.279.5348.220. [DOI] [PubMed] [Google Scholar]
- Garcia L. Escaping the Bonferroni iron claw in ecological studies. OIKOS. 2004;105:657–663. [Google Scholar]
- Harvey PH, Krebs JR. Comparing brains. Science. 1990;249:140–146. doi: 10.1126/science.2196673. [DOI] [PubMed] [Google Scholar]
- Healy S, Rowe C. A critique of comparative studies of brain size. Proc. Biol. Sci. 2007;274:453–464. doi: 10.1098/rspb.2006.3748. [DOI] [PMC free article] [PubMed] [Google Scholar]
- Hennessy RJ, McLearie S, Kinsella A, Waddington JL. Facial surface analysis by 3D laser scanning and geometric morphometrics in relation to sexual dimorphism in cerebral-craniofacial morphogenesis and cognitive function. J. Anat. 2005;207:283–295. doi: 10.1111/j.1469-7580.2005.00444.x. [DOI] [PMC free article] [PubMed] [Google Scholar]
- Hofman MA. On the evolution and geometry of the brain in mammals. Prog. Neurobiol. 1989;32:137–158. doi: 10.1016/0301-0082(89)90013-0. [DOI] [PubMed] [Google Scholar]
- Holloway RL. Some aspects of quantitative relations in the primate brain. Ph.D. Dissertation, University of California; Berkeley: 1964. [Google Scholar]
- Holloway RL. Cranial capacity, neural reorganization, and hominid evolution: A search for more suitable parameters. Am. Anthropol. 1966;68:103–121. [Google Scholar]
- Holloway RL. The evolution of the primate brain: some aspects of quantitative relations. Brain Res. 1968;7:121–172. doi: 10.1016/0006-8993(68)90094-2. [DOI] [PubMed] [Google Scholar]
- Holloway RL. Australopithecine endocasts, brain evolution in the Hominoidea, and a model of hominid evolution. In: Tuttle R, editor. The Functional and Evolutionary Biology of Primates. New York: Aldine Atherton; 1972. pp. 185–204. [Google Scholar]
- Holloway RL. Brain size, allometry, and reorganization: toward a synthesis. In: Hahn ME, Jensen C, Dudek BC, editors. Development and evolution of brain size: behavioral implications. New York: Academic Press; 1979. pp. 59–88. [Google Scholar]
- Holloway RL. Human brain evolution: a search for units, models and synthesis. Can. J. Anthropol. 1983;3:215–230. [Google Scholar]
- Holloway RL. The Taung endocast and the lunate sulcus: a rejection of the hypothesis of its anterior position. Am. J. Phys. Anthropol. 1984;64:285–287. doi: 10.1002/ajpa.1330640310. [DOI] [PubMed] [Google Scholar]
- Holloway RL. The failure of the gyrification index (GI) to account for volumetric reorganization in the evolution of the human brain. J. Hum. Evol. 1992;22:163–170. [Google Scholar]
- Holloway RL. Brief communication: How much larger is the relative volume of area 10 of the prefrontal cortex in humans? Am. J. Phys. Anthropol. 2002a;118:399–401. doi: 10.1002/ajpa.10090. [DOI] [PubMed] [Google Scholar]
- Holloway RL. Brief communication: how much larger is the relative volume of area 10 of the prefrontal cortex in humans? Am. J. Phys. Anthropol. 2002b;118:399–401. doi: 10.1002/ajpa.10090. [DOI] [PubMed] [Google Scholar]
- Jungers WL, Falsetti AB, Wall CE. Shape, relative size, and size-adjustments in morphometrics. Yrbk. Phys Anthropol. 1995;38:137–161. [Google Scholar]
- Holloway RL, Broadfield DC, Yuan MS. Morphology and histology of chimpanzee primary visual striate cortex indicate that brain reorganization predated brain expansion in early hominid evolution. Anat. Rec. A Discov. Mol. Cell. Evol. Biol. 2003;273:594–602. doi: 10.1002/ar.a.10071. [DOI] [PubMed] [Google Scholar]
- Lai CS, Gerrelli D, Monaco AP, Fisher SE, Copp AJ. FOXP2 expression during brain development coincides with adult sites of pathology in a severe speech and language disorder. Brain. 2003;126:2455–2462. doi: 10.1093/brain/awg247. [DOI] [PubMed] [Google Scholar]
- Leigh S, Jungers WL. Brief communication: a re-evaluation of subspecific variation and canine dimorphism in woolly spider monkeys (Brachyteles arachnoides) Am. J. Phys. Anthropol. 1994;95:435–442. doi: 10.1002/ajpa.1330950407. [DOI] [PubMed] [Google Scholar]
- Lele S. Some comments on coordinate-free and scale-invariant methods in morphometrics. Am. J. Phys. Anthropol. 1991;85:407–417. doi: 10.1002/ajpa.1330850405. [DOI] [PubMed] [Google Scholar]
- Lele S. Euclidean Distance Matrix Analysis (EDMA): estimation of mean form and mean form difference. Math. Geol. 1993;25:573–602. [Google Scholar]
- Lele S, Richtsmeier JT. Euclidean distance matrix analysis: confidence intervals for form and growth differences. Am. J. Phys. Anthropol. 1995;98:73–86. doi: 10.1002/ajpa.1330980107. [DOI] [PubMed] [Google Scholar]
- Lele S, Richtsmeier JT. An invariant approach to the statistical analysis of shapes. London: Chapman and Hall-CRC Press; 2001. [Google Scholar]
- Martin RD. Primate Origins and Evolution. Princeton: Princeton University Press; 1990. [Google Scholar]
- Mesulam M. Brain, mind, and the evolution of connectivity. Brain Cogn. 2000;42:4–6. doi: 10.1006/brcg.1999.1145. [DOI] [PubMed] [Google Scholar]
- Nakagawa S. A farewell to Bonferroni: the problems of low statistical power and publication bias. Behav. Ecol. 2004;15:1044–1045. [Google Scholar]
- Ozdemir ST, Ercan I, Sevinc O, Guney I, Ocakoglu G, Aslan E, Barut C. Statistical shape analysis of differences in the shape of the corpus callosum between genders. Anat. Rec. 2007;290:825–830. doi: 10.1002/ar.20558. [DOI] [PubMed] [Google Scholar]
- Passingham R. The frontal cortex: does size matter? Nat. Neurosci. 2002;5:190–192. doi: 10.1038/nn0302-190. [DOI] [PubMed] [Google Scholar]
- Pearlson G, Petty R, Ross C, Tien A. Schizophrenia: a disease of heteromodal association cortex? Neuropsychopharmacology. 1996;14:1–17. doi: 10.1016/S0893-133X(96)80054-6. [DOI] [PubMed] [Google Scholar]
- Peeters R, Simone L, Nellisen K, Fabbri-Destro M, Vanduffel W, Rizzolatti G, Orban GA. The representation of tool use in humans and monkeys: common and uniquely human features. J. Neurosci. 2009;29:11523–11539. doi: 10.1523/JNEUROSCI.2040-09.2009. [DOI] [PMC free article] [PubMed] [Google Scholar]
- Perneger T. What's wrong with Bonferroni adjustments. BMJ. 1998;316:1236–1238. doi: 10.1136/bmj.316.7139.1236. [DOI] [PMC free article] [PubMed] [Google Scholar]
- Pirlot P. Contemporary brain morphology in ecological and ethological perspectives. J. Hirnforsch. 1987;28:145–211. [PubMed] [Google Scholar]
- Pirlot P, Stephan H. Encephalization in Chiroptera. Can. J. Zool. 1970;48:433–444. [Google Scholar]
- Richtsmeier J, Cole T, Krovitz G, Valeri C, Lele S. Preoperative morphology and development in sagittal synostosis. J. Cranio. Genet. Dev. Biol. 1998;18:64–78. [PubMed] [Google Scholar]
- Rilling J, Seligman R. A quantitative morphometric comparative analysis of the primate temporal lobe. J. Hum. Evol. 2002;42:505–533. doi: 10.1006/jhev.2001.0537. [DOI] [PubMed] [Google Scholar]
- Rilling JK, Insel TR. Differential expansion of neural projection systems in primate brain evolution. NeuroReport. 1999;10:1453–1459. doi: 10.1097/00001756-199905140-00012. [DOI] [PubMed] [Google Scholar]
- Rilling JK, Barks S, Parr L, Preuss T, Faber T, Pagnoni G, Bremner J, Votaw J. A comparison of resting-state brain activity in humans and chimpanzees. Proc. Natl. Acad. Sci. U. S. A. 2007;104:17146–17151. doi: 10.1073/pnas.0705132104. [DOI] [PMC free article] [PubMed] [Google Scholar]
- Rilling JK, Glasser M, Preuss T, Ma X, Zhao T, Hu X, Behrens T. The evolution of the arcuate fasciculus revealed with comparative DTI. Nat. Neurosci. 2008;11:426–428. doi: 10.1038/nn2072. [DOI] [PubMed] [Google Scholar]
- Ross C, Pearlson G. Schizophrenia, the heteromodal association neocortex and development: potential for a neurogenetic approach. Trends Neurosci. 1996;19:171–176. doi: 10.1016/s0166-2236(96)10022-9. [DOI] [PubMed] [Google Scholar]
- Ruff CB, Trinkaus E, Holliday TW. Body mass and encephalization in Pleistocene Homo. Nature. 1997;387:173–176. doi: 10.1038/387173a0. [DOI] [PubMed] [Google Scholar]
- Schenker N, Desgouttes A, Semendeferi K. Neural connectivity and cortical substrates of cognition in hominoids. J. Hum. Evol. 2005;49:547–569. doi: 10.1016/j.jhevol.2005.06.004. [DOI] [PubMed] [Google Scholar]
- Schenker NM, Hopkins WD, Spocter MA, Garrison AR, Stimpson CD, Erwin JM, Hof PR, Sherwood CC. Broca’s area homologue in chimpanzees (Pan troglodytes): probabilistic mapping, asymmetry, and comparison to humans. Cereb. Cortex. 2010;20:730–742. doi: 10.1093/cercor/bhp138. [DOI] [PMC free article] [PubMed] [Google Scholar]
- Schoenemann PT. Evolution of the size and functional areas of the human brain. Ann. Rev. Anthropol. 2006;35:379–406. [Google Scholar]
- Schoenemann PT, Sheehan M, Glotzer L. Prefrontal white matter volume is disproportionately larger in humans than in other primates. Nat. Neurosci. 2005;8:242–252. doi: 10.1038/nn1394. [DOI] [PubMed] [Google Scholar]
- Semendeferi K, Damasio H. The brain and its main anatomical subdivisions in living hominoids using magnetic resonance imaging. J. Hum. Evol. 2000;38:317–332. doi: 10.1006/jhev.1999.0381. [DOI] [PubMed] [Google Scholar]
- Semendeferi K, Armstrong E, Schleicher A, Zilles K, Van Hoesen GW. Prefrontal cortex in humans and apes: a comparative study of area 10. Am. J. Phys. Anthropol. 2001;114:224–241. doi: 10.1002/1096-8644(200103)114:3<224::AID-AJPA1022>3.0.CO;2-I. [DOI] [PubMed] [Google Scholar]
- Semendeferi K, Damasio H, Frank R, Van Hoesen GW. The evolution of the frontal lobes: a volumetric analysis based on three-dimensional reconstructions of magnetic resonance scans of human and ape brains. J. Hum. Evol. 1997;32:375–388. doi: 10.1006/jhev.1996.0099. [DOI] [PubMed] [Google Scholar]
- Semendeferi K, Lu A, Schenker N, Damasio H. Humans and great apes share a large frontal cortex. Nat. Neurosci. 2002;5:272–276. doi: 10.1038/nn814. [DOI] [PubMed] [Google Scholar]
- Sherwood CC, Cranfield MR, Mehlman PT, Lilly AA, Garbe JA, Whittier CA, Nutter FB, Rein TR, Bruner HJ, Holloway RL, Tang CY, Naidich TP, Delman BN, Steklis HD, Erwin JM, Hof PR. Brain structure variation in great apes, with attention to the mountain gorilla (Gorilla beringei beringei) Am. J. Primatol. 2004;63:149–164. doi: 10.1002/ajp.20048. [DOI] [PubMed] [Google Scholar]
- Sherwood C, Holloway RL, Semendeferi K, Hof PR. Is prefrontal white matter enlargement a human evolutionary specialization? Nat. Neurosci. 2005;8:537–538. doi: 10.1038/nn0505-537. [DOI] [PubMed] [Google Scholar]
- Takahashi K, Liu FC, Hirokawa K, Takahashi H. Expression of Foxp2, a gene involved in speech and language, in the developing and adult striatum. J. Neurosci. Res. 2003;73:61–72. doi: 10.1002/jnr.10638. [DOI] [PubMed] [Google Scholar]
- Uylings H, van Eden C. Qualitative and quantitative comparison of the prefrontal cortex in rat and in primates, including humans. Prog. Brain. Res. 1990;85:31–62. doi: 10.1016/s0079-6123(08)62675-8. [DOI] [PubMed] [Google Scholar]
- Weinberg SM, Andreasen NC, Nopoulos P. Three-dimensional morphometric analysis of brain shape in nonsyndromic orofacial clefting. J. Anat. 2009;214:926–936. doi: 10.1111/j.1469-7580.2009.01084.x. [DOI] [PMC free article] [PubMed] [Google Scholar]
- Zilles K, Armstrong E, Schleicher A, Kretschmann HJ. The human pattern of gyrification in the cerebral cortex. Anat. Embryol. (Berl) 1988;179:173–179. doi: 10.1007/BF00304699. [DOI] [PubMed] [Google Scholar]
Associated Data
This section collects any data citations, data availability statements, or supplementary materials included in this article.
Supplementary Materials
Statistically significant differences between humans and non-human apes are illustrated on a human individual chosen from the study sample; this individual is not meant to represent a mean form. A) superior cerebral surface; B) left lateral surface with ghosted subcortical structures; C) anterior surface; D) axial slice; and E) a model of subcortical structures. Landmarks are defined in Table 2. White dots rimmed in black indicate landmarks located on the cortical surface; subcortical landmarks are represented by gray dots rimmed in white. Lines illustrated here indicate linear distances that are both significantly different by confidence interval testing and at least 10% greater (red), or 10% smaller (blue) in humans.
A) superior cerebral surface; B) left lateral surface with ghosted subcortical structures; C) anterior surface; D) axial slice; and E) a model of subcortical structures. Landmarks are defined in Table 2. Symbols and line colors are as in Figure 2.
A) Plot of each individual’s scores on the first two principal coordinate axes in analysis of male individuals (results of analysis of female individuals produced results not markedly different from that of the males). B) Illustration of linear distances showing high correlations with scores on Axis 1. Lines illustrated here indicate linear distances showing correlation values of >0.70 (blue) and <−0.70 (red).