

Abstract
Understanding the coordination of multiple parts in a complex system such as the brain is a fundamental challenge. We present a theoretical model of cortical coordination dynamics that shows how brain areas may cooperate (integration) and at the same time retain their functional specificity (segregation). This model expresses a range of desirable properties that the brain is known to exhibit, including self-organization, multi-functionality, metastability and switching. Empirically, the model motivates a thorough investigation of collective phase relationships among brain oscillations in neurophysiological data. The most serious obstacle to interpreting coupled oscillations as genuine evidence of inter-areal coordination in the brain stems from volume conduction of electrical fields. Spurious coupling due to volume conduction gives rise to zero-lag (inphase) and antiphase synchronization whose magnitude and persistence obscure the subtle expression of real synchrony. Through forward modeling and the help of a novel colorimetric method, we show how true synchronization can be deciphered from continuous EEG patterns. Developing empirical efforts along the lines of continuous EEG analysis constitutes a major response to the challenge of understanding how different brain areas work together. Key predictions of cortical coordination dynamics can now be tested thereby revealing the essential modus operandi of the intact living brain.
Keywords: Synchronization, Relative phase, Coordination dynamics, EEG, Alpha
1. Introduction
1.1. Understanding complexity: the theoretical framework of coordination dynamics
The brain is a complex system, formed by a variety of functional entities connected at several levels: individual neurons at the microscale, cortical columns at the mesoscale, specialized nuclei and areas at the macroscale (Bressler and Tognoli, 2006; Kelso, 1995; Buzsáki, 2006). Because of connectivity patterns, local processing is constrained both horizontally (from functional entities at the same level of description) and vertically (from functional entities at higher levels of description). At every moment, interconnected brain areas generate dynamical behaviors that must accommodate both their local (intrinsic) properties and the mutual influence they exert on each other (Kelso and Tognoli, 2007). Such connectivity creates the conditions for the brain to express complexity (Tononi et al., 1994) and self-organization (Kelso, 1995).
Understanding the function of a complex organ like the brain goes beyond understanding the parts alone: how the parts are coordinated also matters. The empirically based theoretical framework of coordination dynamics seeks to describe functional linkages between brain areas and to explain the integrative mechanisms responsible for coordinating local processes into a functional whole (Kelso, 1995). Coordination dynamics proposes that dynamic coupling between the parts of the brain and between the brain and the world are used to express perception, cognition, consciousness and behavior (Kelso, 1995; Kelso and Tognoli, 2007, see also Hebb, 1949; von der Malsburg, 1981; Varela et al., 2001). A plus of coordination dynamics is that it has been able to: (a) identify key coordination or collective variables for complex coordination patterns at several levels of analysis; and (b) explain in mathematical terms how patterns of collective behavior emerge in a self-organized fashion from the non-linear coupling among interacting components (see Kelso, 1995; Schöner and Kelso, 1988; Jirsa et al., 1998 for reviews).
1.2. Assessing coupled cortical areas: whole brain approaches
To understand self-organizing processes in the brain, coordination between distant brain areas needs to be studied systematically. At the present time, EEG and MEG are the only methods available for recording from the whole brain that offer sufficient temporal resolution for this purpose (see Srinivasan et al., 2007 for a comparison of both methods). However, it was quickly realized that inter-areal coordination could not be directly read from interactions between the raw signals registered by these neurophysiological techniques (Section 3). In effect, the activity of well-defined parts of cortex does not yield well-defined patterns at their respective sensors: the latter spread and displace source signals rendering it necessary to use reconstruction methods. Many laboratories turned to tackling the problem of cortical source estimation (the inverse problem) as a preamble to unbiased studies of cortical coherence. The complementary path of predictive forward modeling defines cortical sources a priori and models their transformation in terms of signals that are expected to appear in scalp recordings. Typical signatures of those patterns can then guide interpretation. Here we use a theoretical model of brain coordination dynamics and a forward approach to characterize the properties of EEG signals during: (1) episodes of stationary coupling between brain oscillations; (2) transient patterns of phase synchrony between neural populations which we propose to be characteristic of metastable brain dynamics; and (3) abrupt phase transitions (`switches') between successive cortical patterns (Sections 4-5). We show how to identify real synchronization in the brain and at the same time avoid misinterpretation of patterns that falsely appear on the scalp as phase-locked or quasi phase-locked episodes.
2. Generalized model of brain coordination dynamics
2.1. Collective behavior: multistability, phase transitions and metastability
Based upon many empirical studies of sensorimotor coordination (e.g., Meyer-Lindenberg et al., 2002; Kelso et al., 1992; Kelso et al., 1998), we introduced a theoretical model of brain dynamics composed of non-linearly coupled non-linear oscillators (Kelso, 1995; Fig. 1) that has since been derived from neurophysiological facts regarding short- and long-range connectivity in the cortex (Jirsa et al., 1998; Fuchs et al., 2000). In this simple, but generative model, different kinds of cortical interactions (e.g., multiple stable states, instability, state transitions, metastability) are observed depending upon the system's parameters. The brain is hypothesized to operate dynamically across these different regimes producing a broad range of observable behavior (for reviews, Kelso, 1995; Kelso and Tognoli, 2007; Bressler and Kelso, 2001). In our model, dynamically stable states are reached when a key order parameter or collective variable (the relative phase between local oscillations) ceases to change over time, i.e. when brain areas engage in a synchronous assembly. In the multistable and monostable regimes (Fig. 1A, red and blue), brain dynamics is defined as the formation and dissolution of attractors that bind local oscillations into phase-locked states. These two regimes may be viewed as corresponding to those hypothesized in theories of transiently synchronized neural cell assemblies (Hebb, 1949; Varela et al., 2001). For synchronization to occur, certain conditions must be met: the parts being coordinated have to share similar intrinsic properties and/or the coupling between the parts must be sufficiently strong.
Fig. 1.
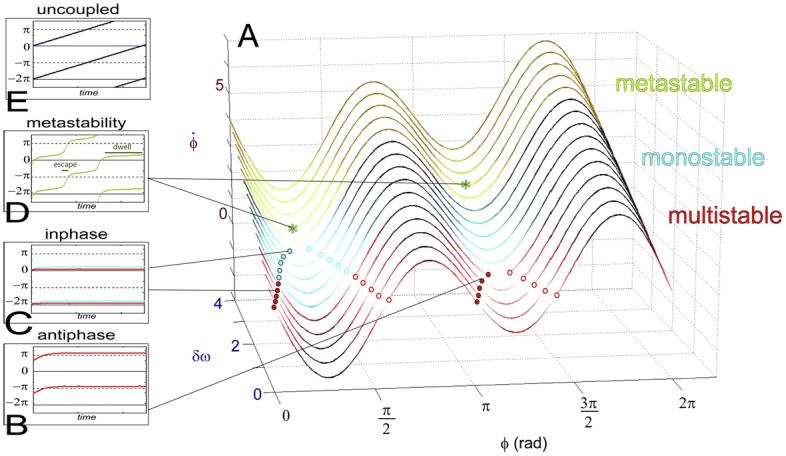
A simple theoretical model of brain coordination dynamics exhibits multistability, adaptive phase shifts, critical phase transitions and metastability. Each source element is capable of intrinsic oscillation. The key collective variable that characterizes the coordination between source elements is the relative phase. (A) Shows the flows of the relative phase (ϕ) for varying parameter values of δω (difference between each element's intrinsic oscillatory frequency) and for fixed coupling values. Boxes show the corresponding phase behavior as a function of time. Flow lines passing through define the fixed points of the coordination dynamics (places where the rate of change of the relative phase is null). Stable fixed points (attractors) are shown as filled circles; unstable fixed points (repellers) as open circles. Red flow lines are multistable: depending on initial conditions, trajectories of the relative phase are attracted near antiphase (B) or inphase (C, red). When the pair of fixed points near antiphase collides and disappears, a bifurcation occurs to the monostable regime in which the relative phase is exclusively attracted near inphase (C, blue). Green flow lines (A) belong to the metastable regime. All the fixed points have disappeared and only “remnants” remain. Coordinative tendencies emerge with successive dwellings near inphase and antiphase (D). For reference, relative phase of uncoupled sources is shown in (E). One can readily see that metastability (A) lies between fully coupled, integrated states (C, D) and totally uncoupled, segregated states (E).
In other regions of the model's parameter space, coordination is generalized to the case of local oscillations with increasingly heterogeneous properties (see also Werner, 2007). There, coordination is not dissolved along with the disappearance of strict phase-locking (synchronization). But other forms of coordination appear that are not considered in classical models of the brain. The dynamics of this region is called metastability. The metastable regime bears only remnants of the attractors and is a fluent way to bind local areas with different intrinsic oscillatory properties (Fig. 1A, green), for instance, two local neural assemblies that need to interact, yet tend to oscillate at different frequencies. Metastability refers to a form of partial coordination that does not lock the dynamics of local areas into synchronized states. Rather, patterns of quasi phase-locking (dwelling tendencies) are created that dynamically summon and release brain areas without requiring costly disengagement mechanisms. Metastability thus enables the concurrent expression of both large-scale integrative activity and local autonomous activity (Kelso, 1995; Kelso and Tognoli, 2007; Bressler and Kelso, 2001), a consequence of which may be to maximize measures of informational complexity (Tononi et al., 1994; Friston, 1997; Sporns, 2004). Metastability is robust and confers advantages of speed, flexibility (metastable trajectories consist of coordination tendencies and visit “options” whereas synchronized cell assemblies settle in stereotyped states) and versatility (a diverse range of neural elements can be coordinated) that are valuable properties for an adaptive cortical system (Kelso and Tognoli, 2007).
2.2. Spontaneous oscillations and transient coordination
In our model of brain coordination dynamics, the source elements spontaneously oscillate as a result of two plausible mechanisms: (1) local post-synaptic activity, self-organized and/or entrained by pacemaker cells; and (2) recurring network activity that engages local areas and remote sites into recurrent patterns of inhibition and re-excitation (Freeman, 1991; Ramirez et al., 2004; Tononi and Edelman, 1998; Buzsáki and Draguhn, 2004). To extract specific oscillations from the broadband signal, band-pass filters are applied to continuous EEG. Spatiotemporal patterns are then inspected using a colorimetric method (Tognoli et al., 2007) developed to map four dimensions of data into 2 dimensional plots (see Figs. 3 and 4 thereafter).
Fig. 3.

Single source contributions to inter-electrode coherence. (A) Tangential patterns arising from a source in a sulcal wall contribute both to spurious antiphase and inphase synchronization. The electrodes situated above the source are typically silent (electrode 3), but electrodes located further away unmask the source's activity (electrodes 1, 2, 4). In step with solid angle theory, the points of maximal amplitudes are found where the vector normal to the active cortical patch (blue and red lines) meets the surface of the scalp (blue and red concentric circles). Antiphase coupling will be found between electrode pairs 1-4 and 2-4; inphase coordination between electrode pair 1-2. Task-dependent recruitment of this brain area is sufficient to obtain a robust change in inter-electrode coherence (see example B-E). The same holds true for the recruitment of a gyral area (inphase pattern, see F-G). In both cases, changes in coherence are due to local processing rather than to large-scale coordination. (B) Shows a 2-s sample of EEG filtered around 11 Hz, recorded when a subject voluntarily interrupts continuous right finger movements. Electrodes are color-coded according to the map presented in the insert. Electrodes F8 (orange) and O1 (blue) are emphasized (bold lines). Antiphase-locking occurs during two episodes as seen in the time course of the relative phase (C) and its cumulative distribution (E). A topographical map at time 8.4 s (D) reveals the spatial characteristics of the pattern. Similarly, (F-G) shows spurious episodes of inphase-locking in the alpha (10 Hz) range. In (F), the relative phase between electrodes Pz and FCz during 3-min of eyes-closed EEG shows massive preference for inphase-locking. These electrodes are typically located 10 cm apart. In (G), band-pass filtered signals of a 60-channel electrode array are displayed for a small period of time from 53.5 to 55 s. Electrode Pz (purple) and FCz (brown) are emphasized (bold lines). They exhibit two episodes of phase-locking inphase from 53.5 to 53.75 s and from 54.3 to 55 s.
Fig. 4.

Example of short-lived phase dwelling between 10 Hz oscillations at three recording sites located above left parieto-occipital, right parietal and left prefrontal areas suggesting that three cortical sources are engaged in a common task. Phases aggregate near electrodes bearing maximal amplitude at PO3 (1st blue arrow), P6 (1st magenta arrow) and AF3 (1st green arrow). Dwelling is established during the period marked by a white frame and lasts about 2 cycles (ca. 170 ms). The common frequency of coupled areas varies around 8.5 Hz. During the episode, PO3 leads P6 by 26° and AF3 by 87°. After dissolution of the synchronized assembly, reorganization is observed: left prefrontal area slows down whereas right parietal and left parieto-occipital areas increase their frequencies (second series of colored arrows). Oscillations at AF3 and PO3 eventually recede in strength, while oscillation at P6 grows and organizes activity with left centro-parietal site to form a new pattern with apparent locking antiphase.
The colorimetric method overcomes a limitation in brain data visualization. Usually, not more than two or three dimensions are displayed simultaneously (“the shadows of the 4 dimensionalworld” as aptly described by Elbert and Keil (2000)). With multiple piecemeal views of the data, the underlying patterning is elusive: when a dimension that was hidden is brought up, one or two others that were previously displayed have to be suppressed. In the 4D colorimetric method, the two dimensions of space are encoded using chromatic relatedness (Cie L × a × b “colorimetric” model). Then, both x- and y-axes are free to display two additional dimensions of time and amplitude and spatiotemporal patterns are fully revealed. The key to this implementation is the “metrics” underlying color perception, i.e. that a certain distance in space (any direction) is converted into a certain distance in color.
The colorimetric method solves the combinatorial problem faced by studies of pair-wise coherence by indicating directly the sensors that display maximal amplitude for their respective phase. In a final step, the dynamics of the coordination variable ϕ (relative phase) is monitored across this reduced subset of sensors for the duration of the pattern. Although the approach can be applied to any frequency, we illustrate its principles with examples taken from the prominent 10 Hz band which is a privileged firing frequency of the majority of cortical neurons (Abeles, 1991).
3. Apparent phase-locking in continuous EEG
Phase-locking is a signature of dependency between brain areas (Kelso, 1995; Winfree, 2002). Local oscillations are constrained to fuse at a single frequency irrespective of their own preference (natural frequency) and their phases are coerced to maintain the same relationship (lag or angle, Fig. 2). The particular phase at which a neural assembly synchronizes is often studied in models of neural networks (e.g., Saraga et al., 2006; Nomura et al., 2003) but less commonly considered by physiologists (but see Freeman, 1980; Palva and Palva, 2007; Womelsdorf et al., 2007). Perhaps as a result of generalization from the microscopic level (Markram et al., 1997), much significance has been attached to zero-lag synchronization, (König et al., 1996), invoking both electrical (spatial summation, Singer, 1999) and chemical explanations (long term potentiation and depression, Axmacher et al., 2006; Sejnowski and Paulsen, 2006). Consequently, explicit studies of phase relationships between coupled brain areas are largely absent, and methodologies are often biased toward the identification of inphase synchronization. In contrast, our model of brain coordination dynamics considers three categories of phase relationship (Fig. 2): pure inphase (zero-lag synchronization); antiphase (synchronization with a lag of half a cycle) in which oscillatory elements have identical intrinsic frequency; and near inphase or near antiphase when the symmetry of the dynamics is broken and they do not (Fig. 1). Each case is successively considered next.
Fig. 2.
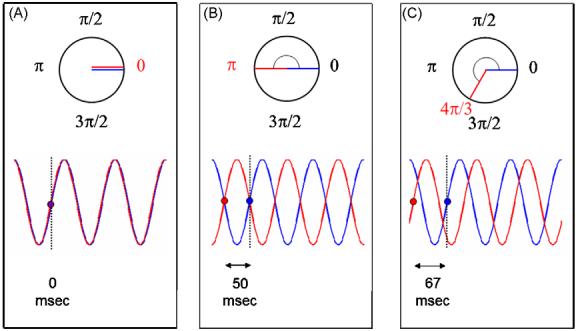
Phase relationships distinguished: inphase (A), antiphase (B) and other phases (C), shown here an example of 4π/3. Each class is presented in the circular domain with their corresponding angle (red number, in radians) and in the linear domain with their corresponding temporal lags (in milliseconds). Oscillations have a frequency of 10 Hz.
3.1. Inphase-locking
A typical EEG shows frequent episodes of inphase-locking (Fig. 3, F-G). However, such inphase-locking should not be taken as evidence of coordination in the brain because volume conduction creates spurious correlation between distant electrodes (Freeman, 1980; Nunez et al., 1997). Theories of EEG point out that the spread of neuronal activity depends not only on the strength but also on the orientation of active sources (Niedermeyer, 2004). Structurally, the brain consists of a convoluted outer surface (cortex) formed by an arrangement of six horizontal layers. Dendritic fields of pyramidal cells largely present in layers 3 and 5 are accepted as the main generator of the EEG signal (Mitzdorf, 1987). Their open ionic fields propagate in all directions but are maximal in a direction normal to the cortical layer (Niedermeyer, 2004). Anatomically, the two limit cases for spurious inphase synchronization are:
Flat surfaces running parallel to the scalp which are found in cortical gyri and at the bottom of cortical sulci. These radial sources generate a single smeared maximum on the scalp which is accurately centered but extends spatially much further than circumscribed by the source.
Patches of cortical tissue orthogonal to the skull which are found in the walls of sulci. These tangential sources create a pair of smeared maxima called a dipolar pattern. Each end of the dipole forms a basin of isopolar electrical activity within which inphase-locking is also seen (Fig. 3A).
Thus, inphase synchronization can result from several configurations: only one source or several, and in the latter case, with or without coupling. Amidst pervasive spurious synchronization (Fig. 3, F-G), real inphase-locking is hidden. Because a single source cannot create spatially discontinuous inphase patterns at the scalp, real synchrony is confirmed as soon as spatial discontinuity is detected (incidentally, the greater the electrode density, the better). Conversely, when spatial discontinuity is not observed, genuine inphase synchronization cannot be asserted at the level of raw EEG.
3.2. Antiphase-locking
Antiphase is another characteristic aspect of brain coordination dynamics (Fig. 1) which is sensitively dependent on system parameters: the state near antiphase is stable for certain parameter values and is destabilized for others. Tendencies for the system to dwell near the remnants of antiphase states reappear in the metastable regime. Due to a focus almost entirely on zero-lag synchronization (which is just one out of many possible phase relationships) studies of neural cell assemblies have shown little interest in investigating antiphase synchronization. Yet empirical observations contain frequent episodes of antiphase-locking as shown in Fig. 3 (B-E). However, apparent antiphase patterns are no better evidence of remote coordination than their inphase counterparts. Volume conduction intervenes again: with every tangential pattern comes spurious synchronization between sensors located in each isopolar basin (Fig. 3A). Since tangential patterns are intrinsically discontinuous in space, unlike inphase, spatial discontinuity of the scalp pattern is of no help in deciding the presence of one or two sources. On probabilistic grounds, genuine antiphase-locking increases with decreasing amplitude of the pattern. This is observed because real antiphase is made of two oscillatory components with opponent waves, and volume conduction inflicts them with amplitude cancellation (see also Fig. 5A).
Fig. 5.
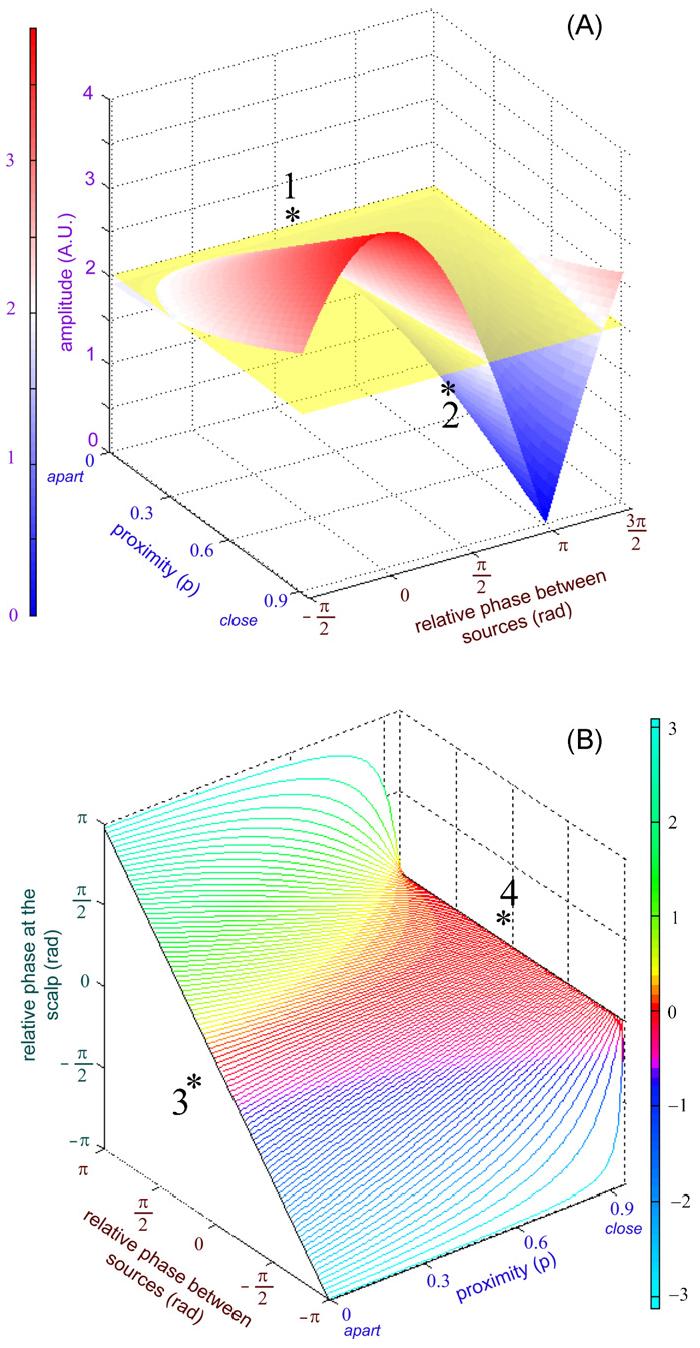
Distortions of scalp amplitude and phase during phase-locked states as revealed by forward modeling. (A) Shows that amplitude at the electrodes is affected by the relative phase between sources and their proximity. For distant sources (p = 0), scalp amplitude is undisturbed as a function of relative phase (rear of surface, annotated 1). For closely located sources, amplitudes with relative phase close to inphase are overestimated (amplitude summation) and underestimated for antiphase (attenuation). For p = .95, there is complete cancellation of scalp signals from sources antiphase and maximal amplitude enhancement inphase (front of surface, annotated 2). (B) Shows that relative phase at the scalp is affected by relative phase between sources and their proximity. For distant sources, relative phase between the electrodes is undistorted (diagonal line annotated 3 on the left of the surface). As proximity between sources increases, relative phases appear close to inphase at the scalp. Eventually, for p = .95, any relative phase between the sources shows up in the scalp as inphase (horizontal line annotated 4 on the right of the surface). A singularity exists at antiphase: scalp relative phase is preserved for any value of p except p = .95 at which phase is not defined.
3.3. Locking at other phases
Whereas many inphase and antiphase patterns arise from spurious synchronization due to single sources, other values of phase-locking cannot be explained by volume conduction and represent safer instances of true synchronization, especially when several aggregates of phase are observed in high density recordings (Fig. 4). In the model of brain coordination dynamics presented above, the particular relative phase at which coupled oscillations settle depends on the frequency difference between source oscillations. For larger differences between intrinsic frequencies, attractive fixed points of the relative phase and their remnants will be shifted further away from pure inphase and antiphase (Fig. 1). Conversely to most inphase and antiphase scalp patterns, dwell-ings at other phase relationships tend to be brief (typically one or two cycles in the 10 Hz range) and relatively scarce. They may, however, constitute valid estimates of true phase-locking in the brain.
4. Effect of spatial correlation: phase-locked states
As we have shown in Section 3, misleading patterns of phase-locking may arise even in the simplest situation of a single active source. Here we explore forward modeling of scalp signals in order to distinguish real from spurious synchrony and thereby aid the recognition of genuine coordination between brain areas. To study how signals at the scalp are affected by the confounding effect of real source dynamics and spurious coupling due to volume conduction, we constructed oscillatory signals for two point-sources S1 and S2 and computed a hypothetical scalp signal as a linear mixture of the sources. We formed the oscillations of two sources S1 and S2 as:
| (1) |
with as1, as2 the amplitudes of the oscillations, ϕs1, ϕs2 their frequency and ϕs1, ϕs2 the initial phase of each oscillation.
Two scalp signals at electrodes E1 and E2 situated above S1 and S2 respectively were modeled with the following equations:
| (2) |
This simple correlation model simulates the proximity between the pair of sources by manipulating a parameter p. The contribution of the electrode situated close to the local source was fixed to l = 0.95 and the contribution of the remote source (p) was allowed to vary from 0 to 0.95. Small values of p represent distant sources, the electrode close to S1 capturing a small amount of S2's signal and vice-versa. As p grows close to 0.95, nearby sources are represented. Note that due to the effect of source orientation, p is not linearly related to the physical distance between sources but represents the contribution of a remote source relative to the local source in the signal recorded from a given electrode. The present model avoids the complex interplay of parameters belonging to a realistic forward model (e.g., source orientation, depth and amplitude; compartment anisotropy, and so forth). Yet, it encapsulates the essential effect of correlation - the end result of these combined factors - on scalp signals.
4.1. Biases in scalp amplitude
For the model represented in Fig. 5, amplitudes (as1 = as2 =1) and frequencies (fs1 = fs2 = 10) of both sources are identical. During phase-locked states, the model shows that scalp amplitude is modulated by the relative phase between active sources, displaying enhancement at inphase and attenuation at antiphase (Fig. 5A). Such amplitude bias has obvious consequences for coherence measures of synchronization which are based on cross-correlations and vary conjointly with phase-locking and with amplitude of the signals. Consequently, quantitative measures of association between brain areas rarely reveal amplitude-attenuated antiphase patterns, and overestimate the contribution of inphase episodes. Amplitude bias may be the chief reason that antiphase brain coordination is omitted in theories of binding-by-synchronization. Methods controlling for the effect of amplitude on phase-locking statistics have been developed (Lachaux et al., 1999) but are not in general use. Below, we develop methods for continuous EEG analysis, a benefit of which is that they do not rely on amplitude information to obtain valid measures of brain coordination.
4.2. Biases in scalp relative phase
Apparent relative phase between phase-locked sources is also biased. Most phase-locked patterns appear at the scalp closer to inphase than they actually are (Fig. 6B). An exception is antiphase, which maintains a genuine angle of π rad - albeit with large amplitude loss - for equal source amplitudes. When sources are allowed to adopt different strengths, antiphase no longer resists the bias: beyond a critical value of amplitude asymmetry, antiphase source patterns flip directly to inphase scalp patterns with no passage through intermediate angles (Fig. 6C). Thus, in addition to (indirect) amplitude overestimation another (direct) bias in the overestimation of zero-lag synchronization is incurred.
Fig. 6.

Distortion of apparent phase during phase-locked states. (A) Summarizes the model with sources S1 and S2 animated with steady oscillations at 10 Hz, and the signal at electrodes E1 and E2 formed with a linear mixture of both sources. (B) Shows phase distortion for sources with symmetrical amplitudes that are coupled with a relative phase of p/2 rad. Apparent relative phase between electrode signals is much smaller than relative phase between source signals. (C) Shows that beyond a threshold of amplitude asymmetry, source patterns antiphase (left) flip to scalp patterns inphase (right). (D) summarizes biases in phase relationships at the scalp relative to source parameters (amplitude, phase). Sources inphase are the only ones that are not distorted at the scalp. Sources antiphase are preserved for small values of amplitude differences but shift to strict inphase beyond a critical amplitude difference. All other source phase relations tend toward inphase at the scalp.
5. Effect of spatial correlation: transitions and metastability
Transitions are periods of time during which one phase state switches to another as a result of changes in parameters (see Fig. 1). The coupling between oscillations is dissolved and the itinerary of the collective variable wanders in search of its next episode of locking. Accordingly, oscillations dephase and may return to their distinct intrinsic frequencies, causing relative phase to drift (Fig. 1E). In the metastable regime, cycles in the relative phase are also observed, but they exhibit a far more subtle temporal structure: the dependency between brain areas strengthens (dwell time) and weakens (escape time) intermittently (Fig. 1D). This temporal structure is evidence of coordination: whereas attractive fixed points of the relative phase have disappeared from the dynamical flow of the system, attracting tendencies persist near the locations where pairs of fixed points (attractors and their associated repellers) coalesce and disappear (Kelso, 1995; Kelso and Tognoli, 2007).
5.1. Dynamic biases and spurious synchrony
During transitions and intermittent regimes, true source parameters are further biased. Phase and amplitude are altered, but instead of being stationary as inphase-locked states, they now have a dynamics - driven by the sources' changing relative phase - that follows the determining features shown in Fig. 5. In addition, yet another bias appears that affects the fidelity of observed frequency (Fig. 7).
Fig. 7.
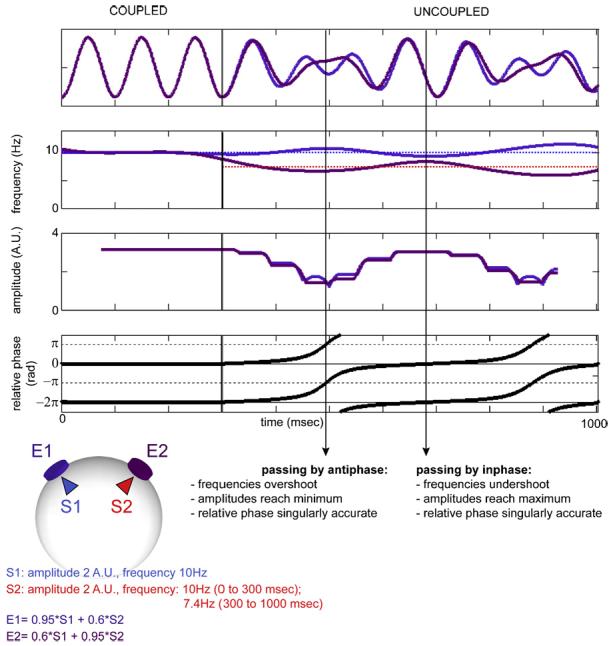
Transition from coupled to uncoupled oscillations for sources with equal amplitude. Both S1 and S2 sustain oscillations with equal amplitudes of 2 arbitrary units. They are coupled at 10 Hz from 0 to 300 ms. At transition, S1 maintains its frequency while S2 slows down to 7.4 Hz. After transition, spurious coupling remains due to volume conduction. Its typical signature is as follows: relative phase dwells inaccurately, except when passing by inphase and antiphase. Frequency, phase and amplitude are distorted. When passing by antiphase, apparent frequencies overestimate real frequencies of the sources and apparent amplitudes reach a minimum. When passing by inphase, observed frequencies are closer to each other than real frequencies, and amplitudes reach a maximum. Dwelling is also observed at antiphase when sources have a certain frequency ratio, allowing the formation of strict antiphase at their maxima.
Such biases are invaluable features for continuous EEG analysis in the framework of coordination dynamics. Even in the absence of key information about source dynamics (e.g., true amplitude and its evolution are unknown), their simultaneous occurrence unambiguously signifies the presence of spurious synchrony. One such signature is in the amplitude domain. For fairly constant amplitudes of the sources, scalp amplitudes simultaneously reach a minimum when incident relative phase crosses p rad and a maximum when crossing 0 rad (Fig. 7). Remarkably, amplitude fluctuation is a pervasive feature of electroencephalographic data both in the temporal (e.g., Linkenkaer-Hansen et al., 2001) and spatial domains (e.g., Freeman, 2004) and is especially notable during resting states such as the alpha rhythm. Dynamics of amplitude attenuation from uncoupled sources is one mechanism that could produce such patterns (Fig. 8, see also Shaw, 2003).
Fig. 8.
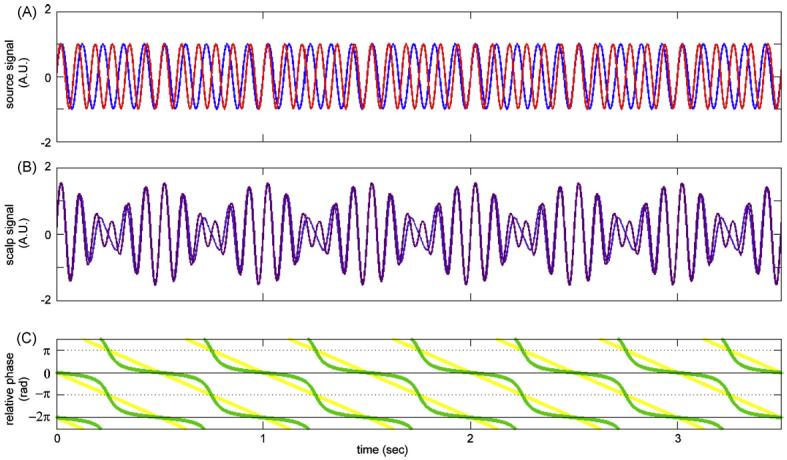
Fluctuation of amplitude observed for two uncoupled sources. The sources were animated with steady dynamics at 10 Hz (S1, blue), and 12 Hz (S2, red), respectively (A). Other parameters of the model were identical to those reported in Fig. 6A. (B) Shows that apparent signals at the scalp exhibit a regular waxing/waning envelope. (C) Discloses the genuinely drifting relative phase of the sources (yellow) and the spuriously lingering relative phase observed at the scalp (green). Note that this phase lingering can be distinguished from the dwells characteristic of the metastable regime: the former is centered at 0 rad, the latter has attracting tendencies near but not at 0 rad.
Other signatures of spurious synchrony pertain to frequency and phase behavior: in the absence of real cortical coupling, residual coupling supported by volume conduction persists and causes apparent frequencies of uncoupled sources to undulate with a period equal to the time necessary for their relative phase to traverse one cycle (Fig. 7). As for relative phase, it is accurate when passing by inphase and antiphase, but lingers near 0 rad for other relative phases.
5.2. Implications
Beyond their usefulness in detecting false synchrony, three further, quite fundamental consequences of dynamic bias arise when multiple sources are active and exhibit non-stationary relative phase. First, since source amplitudes are always unknown, any amplitude modulation cautions against the direct interpreta-tion of source strength on the basis of scalp amplitude. Put bluntly, scalp amplitude is not a direct manifestation of cortical source amplitude (Figs. 5A, 7 and 8). Second, despite source decoupling, scalp signals maintain some correlation through their conjoint amplitude bias (Fig. 7). This feature may permeate average measures of inter-electrode correlation but reveals nothing about brain coupling. Third, spurious dwelling of the relative phase between uncoupled sources adds to the inflation of estimates of zero-lag synchronization (Figs. 7 and 8). Thus, along with the well-known volume conduction bias in space for single sources, a prominent bias also exists in time for multiple uncoupled sources. Thankfully, continuous EEG analysis through colorimetric methods has the ability to uncover such patterns: it relies on the detection of secondary signatures (gathered by forward modeling) to classify continuous EEG patterns as true or false expression of brain coordination. By enabling valid estimates of cortical sources, continuous EEG tells us far more about brain coordination dynamics than previous approaches.
6. Identifying genuine coordination
The main properties that enable oscillatory patterns to survive in the usual averaged descriptions are amplitude and temporal persistence. Both properties drive the attention of investigators away from relatively short-lived episodes of real synchrony. To pass beyond these limitations, we introduced a novel empirical approach based on continuous spatiotemporal analysis of brain signals. We showed that the approach of 4D colorimetric mapping not only portrayed instantaneous episodes of phase-locking between multiple brain areas, but also allowed unambiguous identification of the transitory stable and metastable neural assemblies upon which an understanding of brain function rests.
Here we summarize guidelines for identifying true inter-areal coordination in spatiotemporal patterns of EEG activity. (1) Genuine dwellings in the metastable regime are different from spurious dwellings that arise due to volume conduction. Metast- ability is the inherent result of broken symmetry in the coordination dynamics (e.g., frequency differences between coordinating brain areas). As shown in Fig. 1D, inflection in relative phase starts after crossing 0 or π rad. In contrast, the spurious dwellings of uncoupled sources are symmetrical around 0 or π rad (Fig. 7). In practice, imprecision of phase estimation and strength of volume conduction affect the ability to distinguish cases of moderate broken symmetry from state-transition regimes. (2) Phase-locked states with phase aggregates that are neither inphase nor antiphase are safe instances of phase-locking. Parameters of coordination (relative phase, amplitude, frequency) may be distorted, but the fact of coordination itself cannot be challenged. (3) Phase-locked states are confirmed for inphase patterns with resolved spatial discontinuity. Restoring information about their genuine relative phase may prove difficult. The reason is that with increased proximity, any phase angle will appear like inphase. (4) When spatial discontinuity of inphase patterns cannot be characterized, a variety of source dynamics is possible: engagement of a single radial or tangential source, spurious dwelling from uncoordinated sources, coordinated sources anti-phase with flipped polarity, and finally coordinated sources inphase. Secondary signatures in the domains of amplitude, frequency and phase dynamics (Fig. 7) can assist the recognition of real and spurious synchrony. (5) Antiphase is the most challenging case to determine. We emphasize that the likelihood of real antiphase synchronization increases for patterns with small amplitude, but only in a probabilistic sense. Reliable determination of antiphase patterns will likely require the maturation of efficient inverse algorithms.
7. Conclusion
With the important landmark of Hebb's classical monograph “The Organization of Behavior (1949)”, the theory of transiently synchronized neural cell assemblies is approaching its 60th anniversary. The theoretical model of brain coordination dynamics introduced here steps up Hebb's legacy by going beyond a descriptive account of neural cell assemblies. Within the frame-work of complexity and using the concepts, methods and tools of self-organizing dynamical systems, specific empirical tests of brain coordination dynamics - how neural cell assemblies work together, engaging and disengaging from one to the other in time - are established. Not only does the model predict that coupling will be observed between brain areas, but it also prescribes which areas ought to - or cannot - be coupled when a given assembly is in place. And it specifies details about which frequencies and phase relationships among coupled brain areas are expected to occur.
Despite the availability of whole head EEG and MEG systems for human brain recording, progress has been stunted by the inability of such methods to empirically capture coordination between different neural ensembles at the macroscale (e.g., inter-areal synchronization). A main obstacle to the goal of reading coordination from brain signals (especially in the case of EEG) concerns volume conduction and the spurious synchrony it gives rise to. With the help of a correlation model, we provided predictions that allow investigators to recognize both true and false patterns of synchronization.
We also emphasized the overestimation of inphase synchrony in empirical and theoretical accounts of brain coordination. The view that phase-lockings other than inphase exist in the brain is not new, but for physiologists, zero-lag synchronization has been seen as the instrument through which the brain maximizes its electrical and synaptic efficacy. As a result, inphase has been the only mode of phase-locking in the brain deemed worthy of interest and study. Deviations from inphase - although acknowledged - were often seen merely as imperfect instantiations of zero-lag synchronization rather than as real modes of coordination, per se. As a result of the present work in which distinct modes of coordination dynamics in the brain were identified, it seems it is time to expand our horizon, and discuss what these other phase relationships mean for brain physiology and function. One possibility is to use the bistability of inphase and antiphase in the brain as a way to encode complementary pairs (see Kelso and Tognoli, 2007).
Linear increases in efficacy between parts of the brain are often considered as the golden grail of proper function: a way to facilitate information exchange between neural populations. We argue that this view by itself is just too simple for a complex dynamical system like the brain which has been demonstrated to exhibit hallmark features of self-organization such as phase transitions (Kelso et al., 1992; Kelso, 1995). In our theory, the brain uses multiple phases and metastable regimes to integrate the activity of diverse and heterogenously connected parts into a functional dynamics, or in other words, to encode and communicate information. A focus of this theory is to understand how such dynamics comes about (Ernst et al., 1998; Saraga et al., 2006; Paissan and Zanette, 2008; Jirsa and Kelso, 2000; Jirsa, 2008) and what it means at various levels from the cell (Markram et al., 1997) to the whole system (Varela et al., 2001). Brain coordination dynamics thus lies at the intersection of where neuroscience meets complexity.
Acknowledgments
We wish to acknowledge Walter Freeman and Viktor Jirsa for useful discussions and the reviewers for their helpful suggestions. We are grateful for the support of NIMH grants MH042900-19A2 and MH080838-01A1, NINDS grant NS048229-04 and the Office of Naval Research; the Chaire Pierre de Fermat (JASK) and the Davimos Family Endowment for Excellence in Science (ET).
Abbreviation
- EEG
electroencephalography.
References
- Abeles M. Corticonics: Neural Circuits of the Cerebral Cortex. Cambridge University Press; New York: 1991. [Google Scholar]
- Axmacher N, Mormann F, Fernández G, Elger CE, Fell J. Memory formation by neuronal synchronization. Brain Research Reviews. 2006;52(1):170–182. doi: 10.1016/j.brainresrev.2006.01.007. [DOI] [PubMed] [Google Scholar]
- Bressler SL, Kelso JAS. Cortical coordination dynamics and cognition. Trends in Cognitive Sciences. 2001;5:26–36. doi: 10.1016/s1364-6613(00)01564-3. [DOI] [PubMed] [Google Scholar]
- Bressler SL, Tognoli E. Operational principles of neurocognitive networks. International Journal of Psychophysiology. 2006;60:139–148. doi: 10.1016/j.ijpsycho.2005.12.008. [DOI] [PubMed] [Google Scholar]
- Buzsáki G, Draguhn A. Neuronal oscillations in cortical networks. Science. 2004;304:1926–1929. doi: 10.1126/science.1099745. [DOI] [PubMed] [Google Scholar]
- Buzsáki G. Rhythms of the Brain. Oxford University Press; New York: 2006. [Google Scholar]
- Elbert T, Keil A. Cognitive neuroscience: imaging in the fourth dimension. Nature. 2000;404:29–31. doi: 10.1038/35003682. doi:10.1038/35003682. [DOI] [PubMed] [Google Scholar]
- Ernst U, Pawelzik K, Geisel T. Delayed-induced multistable synchronization of biological oscillators. Physical Review E. 1998;57:2150–2162. [Google Scholar]
- Freeman WJ. Origin, structure, and role of background EEG activity. Part 2. Analytic amplitude. Clinical Neurophysiology. 2004;115:2089–2107. doi: 10.1016/j.clinph.2004.02.028. [DOI] [PubMed] [Google Scholar]
- Freeman WJ. Use of spatial deconvolution to compensate for distortion of EEG by volume conduction. IEEE Transactions on Biomedical Engineering. 1980;27(8):421–429. doi: 10.1109/TBME.1980.326750. [DOI] [PubMed] [Google Scholar]
- Freeman WJ. The physiology of perception. Scientific American. 1991;264:78–85. doi: 10.1038/scientificamerican0291-78. [DOI] [PubMed] [Google Scholar]
- Friston KJ. Transients, metastability, and neuronal dynamics. NeuroImage. 1997;5(2):164–171. doi: 10.1006/nimg.1997.0259. [DOI] [PubMed] [Google Scholar]
- Fuchs A, Jirsa VK, Kelso JAS. Theory of the relation between human brain activity (MEG) and hand movements. NeuroImage. 2000;11:359–369. doi: 10.1006/nimg.1999.0532. [DOI] [PubMed] [Google Scholar]
- Hebb DO. The Organization of Behavior. John Wiley; New-York: 1949. [Google Scholar]
- Jirsa VK, Kelso JAS. Spatiotemporal pattern formation in neural systems with heterogeneous connection topologies. Physical Review E. 2000;62:8462–8465. doi: 10.1103/physreve.62.8462. [DOI] [PubMed] [Google Scholar]
- Jirsa VK, Fuchs A, Kelso JAS. Cortical and behavioral dynamics: bimanual coordination. Neural Computation. 1998;10:2019–2045. doi: 10.1162/089976698300016954. [DOI] [PubMed] [Google Scholar]
- Jirsa VK. Dispersion and time delay effects in synchronized spike-burst networks. Cognitive Neurodynamics. 2008;2(1):29–38. doi: 10.1007/s11571-007-9030-0. [DOI] [PMC free article] [PubMed] [Google Scholar]
- Kelso JAS. Dynamic Patterns: the Self-Organization of Brain and Behavior. MIT Press; Cambridge, MA: 1995. [Google Scholar]
- Kelso JAS, Bressler SL, Buchanan S, De Guzman GC, Ding M, Fuchs A, Holroyd T. A phase transition in human brain and behavior. Physics Letters A. 1992;169:134–144. [Google Scholar]
- Kelso JAS, Fuchs A, Holroyd T, Lancaster R, Cheyne D, Cheyne D, Weinberg H. Dynamic cortical activity in the human brain reveals motor equivalence. Nature. 1998;392:814–818. doi: 10.1038/33922. [DOI] [PubMed] [Google Scholar]
- Kelso JAS, Tognoli E. Toward a complementary neuroscience: metastable coordination dynamics of the brain. In: Kozma R, Perlovsky L, editors. Neurodynamics of Cognition and Consciousness. Springer-Verlag; Berlin: 2007. pp. 39–59. [Google Scholar]
- König P, Engel AK, Singer W. Integrator or coincidence detector? The role of the cortical neuron revisited. Trends in Neurosciences. 1996;19:130–137. doi: 10.1016/s0166-2236(96)80019-1. [DOI] [PubMed] [Google Scholar]
- Lachaux JP, Rodriguez E, Martinerie J, Varela FJ. Measuring phase synchrony in brain signals. Human Brain Mapping. 1999;8(4) doi: 10.1002/(SICI)1097-0193(1999)8:4<194::AID-HBM4>3.0.CO;2-C. doi:10.1002/ (SICI)1097-0193. [DOI] [PMC free article] [PubMed] [Google Scholar]
- Linkenkaer-Hansen K, Nikouline VV, Palva JM, Ilmoniemi RJ. Long-range temporal correlations and scaling behavior in human brain oscillations. Journal of Neuroscience. 2001;21:1370–1377. doi: 10.1523/JNEUROSCI.21-04-01370.2001. [DOI] [PMC free article] [PubMed] [Google Scholar]
- Markram H, Lübke J, Frotscher M, Sakmann B. Regulation of synaptic efficacy by coincidence of postsynaptic APs and EPSPs. Science. 1997;275:213. doi: 10.1126/science.275.5297.213. [DOI] [PubMed] [Google Scholar]
- Meyer-Lindenberg A, Ziemann U, Hajak G, Cohen L, Berman KF. Transitions between dynamical states of differing stability in the human brain. Proceedings of the National Academy of Sciences of the USA. 2002;99:10948–10953. doi: 10.1073/pnas.162114799. [DOI] [PMC free article] [PubMed] [Google Scholar]
- Mitzdorf U. Properties of the evoked potential generators: current source- density analysis of visually evoked potentials in the cat cortex. International Journal of Neuroscience. 1987;33:33–59. doi: 10.3109/00207458708985928. [DOI] [PubMed] [Google Scholar]
- Niedermeyer E. The EEG signal: polarity and field determination. In: Niedermeyer E, Lopes Da Silva F, editors. Electroencephalography Basic Principles, Clinical Applications, and Related Fields. Lippincott, Williams and Wilkins; Philadelphia: 2004. pp. 161–166. [Google Scholar]
- Nomura M, Fukai T, Aoyagi T. Synchrony of fast-spiking interneurons interconnected by GABAergic and electrical synapses. Neural Computation. 2003;15(9):2179–2198. doi: 10.1162/089976603322297340. [DOI] [PubMed] [Google Scholar]
- Nunez PL, Srinivasan R, Westdorp AF, Wijesinghe RS, Tucker DM, Silberstein RB, Cadusch PJ. EEG coherency. I: Statistics, reference electrode, volume conduction, Laplacians, cortical imaging, and interpretation at multiple scales. Electroencephalography Clinical Neurophysiology. 1997;103(5):499–515. doi: 10.1016/s0013-4694(97)00066-7. [DOI] [PubMed] [Google Scholar]
- Paissan GH, Zanette DH. Synchronization of phase oscillators with heterogeneous coupling: a solvable case. Physica D. 2008;237:818–828. [Google Scholar]
- Palva S, Palva JM. New vistas for alpha-frequency band oscillations. Trends in Neurosciences. 2007;30:150–158. doi: 10.1016/j.tins.2007.02.001. [DOI] [PubMed] [Google Scholar]
- Ramirez JM, Tryba AK, Peña F. Neurons and neural networks: an integrative view. Current Opinion in Neurobiology. 2004;14:1–10. doi: 10.1016/j.conb.2004.10.011. [DOI] [PubMed] [Google Scholar]
- Saraga F, Ng L, Skinner FK. Distal gap junctions and active dendrites can tune network dynamics. Journal of Neurophysiology. 2006;95(3):1669–1682. doi: 10.1152/jn.00662.2005. [DOI] [PubMed] [Google Scholar]
- Schöner G, Kelso JAS. Dynamic pattern generation in behavioral and neural systems. Science. 1988;239:1513–1520. doi: 10.1126/science.3281253. [DOI] [PubMed] [Google Scholar]
- Sejnowski TJ, Paulsen O. Network oscillations: emerging computational principles. Journal of Neurosciences. 2006;26:1673–1676. doi: 10.1523/JNEUROSCI.3737-05d.2006. [DOI] [PMC free article] [PubMed] [Google Scholar]
- Shaw JC. The Brain's Alpha Rhythms and the Mind. Elsevier; Amsterdam: 2003. [Google Scholar]
- Singer W. Neural synchrony: a versatile code for the definition of relations. Neuron. 1999;24:49–65. doi: 10.1016/s0896-6273(00)80821-1. [DOI] [PubMed] [Google Scholar]
- Sporns O. Complex neural dynamics. In: Jirsa VK, Kelso JAS, editors. Coordination Dynamics: Issues and Trends. Springer-Verlag; Berlin: 2004. pp. 197–215. [Google Scholar]
- Srinivasan R, Winter WR, Ding J, Nunez PL. EEG and MEG coherence: measures of functional connectivity at distinct spatial scales of neocortical dynamics. Journal of Neuroscience Methods. 2007;166(1):41–52. doi: 10.1016/j.jneumeth.2007.06.026. [DOI] [PMC free article] [PubMed] [Google Scholar]
- Tognoli E, Lagarde J, De Guzman GC, Kelso JAS. The phi complex as a neuromarker of human social coordination. Proceedings of the National Acad-emy of Sciences of the USA. 2007;104:8190–8195. doi: 10.1073/pnas.0611453104. [DOI] [PMC free article] [PubMed] [Google Scholar]
- Tononi G, Edelman GM. Consciousness and complexity. Science. 1998;282:1846–1851. doi: 10.1126/science.282.5395.1846. [DOI] [PubMed] [Google Scholar]
- Tononi G, Sporns O, Edelman GM. Measure for brain complexity: relating functional segregation and integration in the nervous system. Proceedings of the National Academy of Sciences of the USA. 1994;91:5033–5037. doi: 10.1073/pnas.91.11.5033. [DOI] [PMC free article] [PubMed] [Google Scholar]
- Varela FJ, Lachaux J-P, Rodriguez E, Martinerie J. The brainweb: phase synchronization and large-scale integration. Nature Reviews Neuroscience. 2001;2:229–239. doi: 10.1038/35067550. [DOI] [PubMed] [Google Scholar]
- von der Malsburg C. Internal Report. MPI Biophysical Chemistry; Goettingen: 1981. The correlation theory of brain function; pp. 81–82. [Google Scholar]
- Werner G. Metastability, criticality and phase transitions in brain and its models. Biosystems. 2007;90(2):496–508. doi: 10.1016/j.biosystems.2006.12.001. [DOI] [PubMed] [Google Scholar]
- Winfree T. Oscillating systems: on emerging coherence. Science. 2002;298:2336–2337. doi: 10.1126/science.1072560. [DOI] [PubMed] [Google Scholar]
- Womelsdorf T, Schoffelen J-M, Oostenveld R, Singer W, Desimone R, Engel AK, Fries P. Modulation of neuronal interactions through neuronal synchronization. Science. 2007;316:1609–1612. doi: 10.1126/science.1139597. [DOI] [PubMed] [Google Scholar]