Abstract
Objectives. We investigated associations of socioeconomic position (SEP) with chronic disease risk factors, and heterogeneity in this patterning by provincial-level urbanicity in Argentina.
Methods. We used generalized estimating equations to determine the relationship between SEP and body mass index, high blood pressure, diabetes, low physical activity, and eating fruit and vegetables, and examined heterogeneity by urbanicity with nationally representative, cross-sectional survey data from 2005. All estimates were age adjusted and gender stratified.
Results. Among men living in less urban areas, higher education was either not associated with the risk factors or associated adversely. In more urban areas, higher education was associated with better risk factor profiles (P < .05 for 4 of 5 risk factors). Among women, higher education was associated with better risk factor profiles in all areas and more strongly in more urban than in less urban areas (P < 0.05 for 3 risk factors). Diet (in men) and physical activity (in men and women) were exceptions to this trend.
Conclusions. These results provide evidence for the increased burden of chronic disease risk among those of lower SEP, especially in urban areas.
Deaths from noncommunicable chronic diseases are on the rise globally and are projected to account for 69% of all deaths by 2030.1 Nearly 80% of these deaths already occur in low- and middle-income countries.2 Also troubling is that deaths from chronic diseases usually occur at younger ages in developing countries than they do in developed countries.3,4
Although the classic epidemiological transition theory states that as countries become more developed, the disease burden shifts from mostly infectious diseases to mostly chronic diseases,5 many developing countries are experiencing a double burden of communicable and noncommunicable diseases.6 In addition to facing demographic changes related to aging populations,7 many countries have experienced a nutrition transition, in which people increase their consumption of fats, sugars, and processed food,8 as well as a physical activity transition, with populations becoming more sedentary.9–11
Several macroeconomic and social processes have shaped these transitions. Trade liberalization and foreign investment have contributed to changes in agricultural production and the processing and distribution of energy-dense and processed foods globally, and marketing promotes the consumption of these foods.12 Urbanization is also a major influence on chronic disease risk. As of 2008, more than half of the world's population was living in urban areas. The urban population is expected to continue growing over the next 2 decades, and most of the increase will occur in developing countries.13
Rapid urbanization is associated with increases in fat, sugar, and sodium in the diet. The types of jobs available in urban areas are often more sedentary than those in rural areas, causing changes in physical activity levels. Likewise, changes in leisure-time activities and the different types of transportation available (e.g., buses, cars) result in more sedentary lifestyles.14–16 In addition, urbanization increases the participation of women in the labor force, which subsequently changes the amount of money households have as well as the time available for food preparation.17 Not surprisingly, then, those living in urban areas in most developing countries have higher levels of such chronic disease risk factors as overweight, hypertension, and diabetes than do their rural counterparts.2
The increasing burden of chronic diseases does not affect all people equally.18 Although those of higher socioeconomic position (SEP) are usually the early adopters of lifestyles associated with greater risk for chronic diseases, they are also the first to respond to health messages and are able to change their behavior and environment to decrease their risk. Thus, socioeconomic gradients in chronic disease risk factors may change over time. Most research on the socioeconomic gradients of chronic disease risk has occurred in high-income countries, where numerous studies have shown inverse gradients for chronic diseases such as cardiovascular disease, which means that persons with lower SEP have higher disease risk while those with higher SEP have lower disease risk.19 Although few studies have examined this trend in developing countries, evidence suggests that despite an initially greater risk among those with higher SEP, some countries have already transitioned to a pattern in which the poor carry the greater burden of chronic disease risk.3,20
Very few studies have examined how the transition in social patterning occurs within developing countries. Identifying factors associated with changes in social patterning may help to better understand the determinants of inequities in chronic disease. It may also assist efforts to prevent chronic diseases through the development of more appropriate or targeted interventions. We used data from a nationally representative survey to investigate the socioeconomic patterning of several chronic disease risk factors (body mass index [BMI; defined as weight in kilograms divided by height in meters squared], high blood pressure, diabetes, physical activity, and diet) in the middle-income country of Argentina. We also examined how this patterning varied according to provincial levels of urbanicity.
METHODS
Our data source was the 2005 National Survey of Risk Factors for Noncommunicable Diseases conducted by the Argentine government.21 The study employed a 4-stage probabilistic sample design with agglomerations of at least 5000 inhabitants sampled at the first stage, censal radios (census areas with an average of 300 housing units) or clusters of censal radios sampled at the second stage, housing units (house, apartment building, etc.) sampled at the third stage, and an individual aged 18 years or older randomly sampled from all households within each housing unit at the fourth stage. The sample represented 96% of adults living in urban areas (with 5000 or more inhabitants) and included residents of villas (shantytowns) but not the homeless.22
According to the 2001 census, Argentina had a population of 36.3 million people, with 89% living in urban areas (defined as areas with 2000 or more people).23 A total of 41 392 people participated in the survey; they were drawn from all 23 provinces and the city of Buenos Aires. The response rate was 86.7%.22 Pilot testing of the questionnaire found excellent reliability and expected associations between measurements of weight, blood pressure, glycemia, and cholesterol and their respective self-reported measures. Questionnaire validity did not differ by gender, age, or education level.24
Trained interviewers visited the sampled households. Study participants answered questions about their height, weight, blood pressure status, diabetes status, diet, and physical activity, in addition to questions about their SEP. BMI was calculated from self-reported weight and height. Obesity was defined as a BMI of 30 kg/m2 or higher. Participants were classified as having high blood pressure or diabetes if they reported they had ever been diagnosed with the condition by a health professional; people who reported that they had never had their blood pressure or blood sugar measured were coded as missing those data. Results of sensitivity analyses that used a less strict definition (i.e., including those who did not report measurements) were not qualitatively different.
Diet was assessed by questions regarding the frequency of fruit and vegetable intake: “How many days in the last week, in your house or outside of your house, did you eat or drink fruit (not including fruit juice)?” The same question was asked again for frequency of eating or drinking vegetables. Participants were considered to have high intake if they reported eating fruit and vegetables at least 5 days per week.
Physical activity level was determined by 2 items: “In the last week, how many days did you participate in intense physical activity, lasting at least 10 min?” The same question was asked again for frequency of moderate physical activity, and again for frequency of walking. Participants were then asked to give the amount of time of intense physical activity in minutes. The same question was asked again for moderate physical activity, and again for walking. Physical activity was defined as low if the person did not meet the following criteria: at least 3 days per week of intense activity for 20 minutes per day, at least 5 days per week of moderate activity, walking at least 30 minutes per day, or at least 5 days of any combination of activity yielding at least 600 MET-minutes per week. A MET is defined as the caloric consumption of a person while at complete rest (1 kcal/kg/h).
SEP was measured by education. Self-reported categories for education were no school, incomplete primary, complete primary, incomplete secondary, complete secondary, incomplete tertiary or university education, and complete tertiary or university or more. We treated education level as an ordinal variable.
Argentina has 23 provinces in addition to the autonomous city of Buenos Aires; they ranged in population size from 101 079 (Tierra del Fuego) to 13.8 million (province of Buenos Aires) in 2001.23 We took the provincial-level indicator of urbanicity from the 2001 census. It was measured as the percentage of households living in urban areas, defined as areas with at least 2000 people, by province.23 We gave each person in the sample the value for their province (or city of Buenos Aires).
We adjusted all analyses for age and stratified by gender because of the variation in socioeconomic gradients by gender for some risk factors,20,25 and the differential way that women experience economic development and its health consequences.26 Regression analyses included survey weights to account for the complex sampling design.
We used generalized estimating equations to account for the nesting of individuals within provinces.27 We ran 2 regression models for each risk factor (BMI, high blood pressure, diabetes, eating fruit and vegetables, and low physical activity) separately. The first model included the mutually adjusted main effects of education and urbanicity, and the second model introduced interaction terms between education and urbanicity. We calculated predicted means (BMI) and probabilities (high blood pressure, diabetes, low physical activity, and eating fruit and vegetables) from the second model, which included interaction terms. We calculated predicted values for various levels of urbanicity (mean, ±1 SD, ±2 SD) and education (10th, 25th, 50th, 75th, 90th percentiles) to graphically display the interactions. We gave age its mean value when calculating the predicted values. We conducted analyses with SAS version 9.2 (SAS Institute Inc, Cary, NC).
RESULTS
Table 1 displays selected characteristics, by gender, for the Argentina-wide sample. Of the 41 392 participants, 57% were women. Provinces had a mean population of 1725 ±391 people. Women respondents were slightly older than men and had similar education levels but lower monthly household income. Education and income were positively, though not highly, correlated (Spearman correlation = 0.46). Men reported higher mean BMI and higher levels of obesity than did women (17% vs 15%, respectively). However, more women (39%) than men (32%) reported being diagnosed with high blood pressure. Men and women reported being diagnosed with diabetes at the same frequency (12%). Women reported low physical activity more often than did men (47% vs 42%, respectively), but more women than men ate fruit and vegetables at least 5 days per week (35% vs 25%, respectively). Mean province-level urbanicity (percentage of households living in urban areas) was 85% (range = 66%–100%).
TABLE 1.
Selected Characteristics of Study Sample by Gender: National Survey of Risk Factors for Noncommunicable Diseases, Argentina, 2005
| Men | Women | |
| Age, y, mean ±SD | 42.7 ±17.1 (18–97) | 44.8 ±18.0 (18–98) |
| Education, no. (%) | ||
| No school | 289 (1.6) | 558 (2.4) |
| Primary incomplete | 2048 (11.5) | 2924 (12.4) |
| Primary complete | 4198 (23.6) | 5474 (23.3) |
| Secondary incomplete | 3360 (18.9) | 3544 (15.1) |
| Secondary complete | 3563 (20.0) | 4535 (19.3) |
| Tertiary or university incomplete | 2303 (12.9) | 2946 (12.5) |
| Tertiary or university complete or more | 2033 (11.4) | 3560 (15.1) |
| Monthly household income, pesos, mean ±SD | 920.7 ±863.9 (0–5 500) | 815.7 ±774.3 (0–5 500) |
| BMI,a kg/m2, mean ±SD | 26.4 ±4.3 (10.6–76.1) | 25.0 ±5.1 (12.4–94.9) |
| Obesity,a,b % | 17.0 | 14.9 |
| High blood pressure,c % | 32.3 | 39.1 |
| Diabetes,d % | 12.3 | 12.3 |
| Physical activity level, no. (%) | ||
| Low | 7360 (41.8) | 10 937 (47.0) |
| Moderate | 7400 (42.0) | 10 822 (46.5) |
| Intense | 2850 (16.2) | 1535 (6.6) |
| Eat fruit and vegetables ≥ 5 d/wk, % | 25.3 | 35.0 |
| Households in province living in urban areas, % | ||
| Mean ±SD (range) | 84.5 ±8.3 (66.1–100.0) | 84.6 ±8.2 (66.1–100.0) |
| Median | 84.4 | 84.4 |
| 25th–75th percentile | 79.5–89.2 | 79.5–89.2 |
Note. BMI = body mass index. Except where noted, the sample size for men was n = 17 827; for women, n = 23 565.
The sample size for men was n = 16 913; for women, n = 21 033.
Obesity defined as BMI ≥ 30 kg/m2.
Diagnosed at least once. The sample size for men was n = 14 765; for women, n = 21 962.
Diagnosed. The sample size for men was n = 11 278; for women, n = 17 970.
Associations of education and province-level urbanicity (adjusted for each other, in addition to age) with risk factors are shown in Table 2, by gender. For men, higher education was associated with lower odds of high blood pressure and diabetes, greater odds of low physical activity, and greater odds of eating fruit and vegetables. For women, higher education was associated with lower mean BMI, lower odds of high blood pressure and diabetes, and higher odds of eating fruit and vegetables. Among men, greater levels of urbanicity were associated with higher odds of low physical activity and lower odds of eating fruit and vegetables. Among women, greater levels of urbanicity were associated with lower odds of high blood pressure. However, we found evidence of important interactions between province-level urbanicity and education: of the 10 interactions between urbanicity and education tested, 7 interactions (4 in men and 3 in women) were statistically significant. Among men, we noted statistically significant interactions between urbanicity and education for all risk factors except low physical activity (which was marginally statistically significant at α = 0.10). For women, we found statistically significant interactions between urbanicity and education for BMI, diabetes, and low physical activity.
TABLE 2.
Adjusted Mean Differences in Body Mass Index (BMI) and Odds of High Blood Pressure, Diabetes, Fruit and Vegetable Intake, and Low Physical Activity Level According to Education and Urbanicity, by Gender: National Survey of Risk Factors for Noncommunicable Diseases, Argentina, 2005
| Difference in BMI,a Mean (95% CI) | High Blood Pressure,b OR (95% CI) | Diabetes,c OR (95% CI) | Low Physical Activity Level,d OR (95% CI) | Eat Fruit and Vegetables,e OR (95% CI) | |
| Men | |||||
| Education | −0.02 (−0.07, 0.03) | 0.94 (0.90, 0.98) | 0.85 (0.82, 0.88) | 1.06 (1.04, 1.08) | 1.20 (1.17, 1.24) |
| Urbanicityf | −0.09 (−0.19, 0.01) | 0.98 (0.92, 1.05) | 1.01 (0.93, 1.10) | 1.19 (1.03, 1.38) | 0.92 (0.87, 0.97) |
| P | .002 | > .001 | .011 | .121 | .006 |
| Women | |||||
| Education | −0.48 (−0.56, −0.41) | 0.86 (0.84, 0.89) | 0.80 (0.78, 0.82) | 1.02 (0.96, 1.08) | 1.27 (1.22, 1.31) |
| Urbanicityf | 0.07 (−0.10, 0.25) | 0.94 (0.90, 0.98) | 0.98 (0.90, 1.08) | 0.85 (0.69, 1.05) | 1.02 (0.89, 1.17) |
| P | .017 | .471 | .015 | .002 | .562 |
Note. CI = confidence interval; OR = odds ratio. All models adjusted for age; BMI also adjusted for age squared.
The sample size for men was n = 16 888; for women, n = 21 013.
The sample size for men was n = 14 743; for women, n = 21 942.
The sample size for men was n = 11 259; for women, n = 17 957.
The sample size for men was n = 17 579; for women, n = 23 270.
The sample size for men was n = 17 794; for women, n = 23 541.
Centered, per SD.
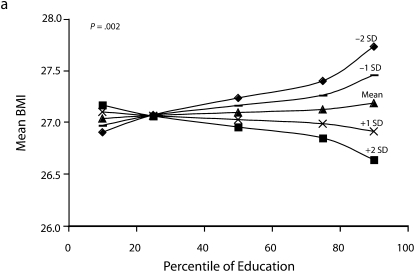
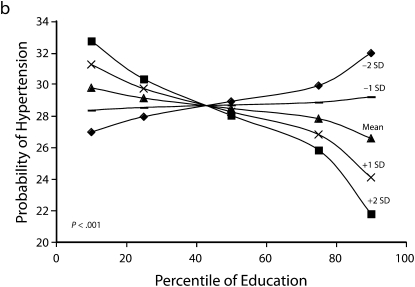
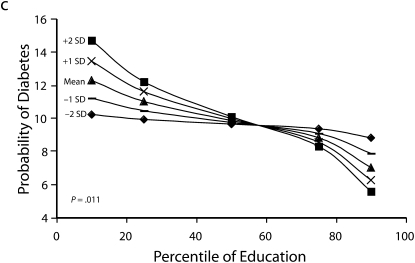
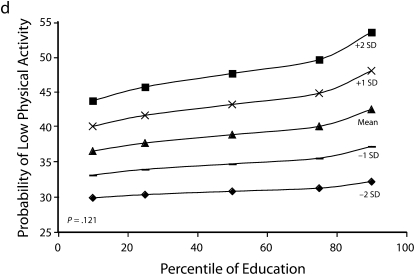
Figures 1 and 2 show predicted risk factor levels for varying levels of urbanicity and education. Among men living in less urban areas, higher education was either not associated with the risk factors or was associated with adverse risk factor profiles (Figure 1). By contrast, in more urban areas, higher education was usually associated with better risk profiles. For example, as urbanicity increased, the socioeconomic gradient changed from persons with the highest education level to those with lowest having the highest mean BMI. We observed similar patterns for high blood pressure. For diabetes we did not observe a socioeconomic gradient in areas of low urbanicity, but an inverse gradient emerged in areas of high urbanicity. Higher education was associated with less physical activity in both urban and rural areas; the gradient appeared to be slightly stronger with greater urbanicity, although the interaction between urbanicity and education was only marginally statistically significant (P = .12) The probability of eating fruit and vegetables increased with education in all areas; however, by contrast to the other risk factors examined, this gradient was stronger in less urban than it was in more urban areas.
FIGURE 1.
Predicted mean BMI and probability of hypertension, diabetes, low physical activity, and eating fruit and vegetables among men, by education according to different levels of urbanicity: National Survey of Risk Factors for Noncommunicable Diseases, Argentina, 2005.
Note. BMI = body mass index.
FIGURE 2.
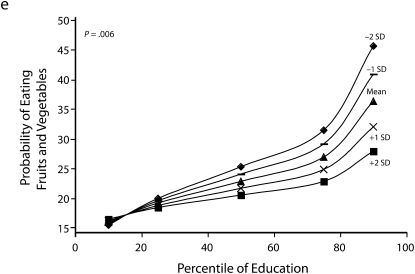
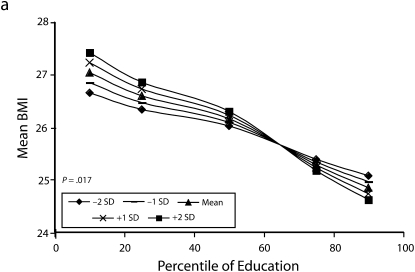
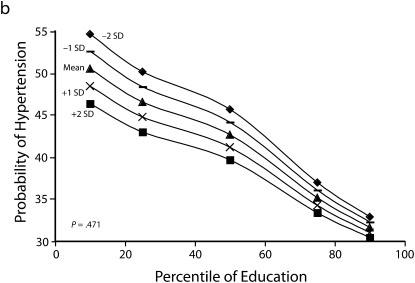
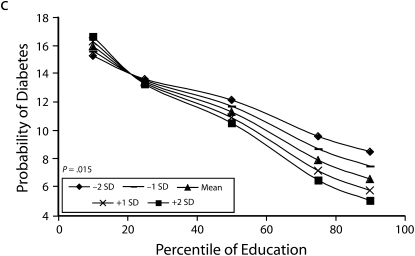
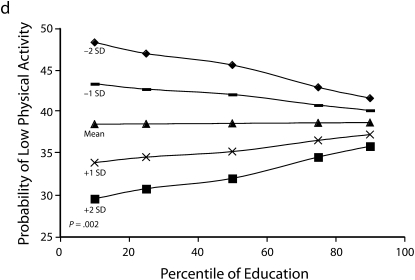
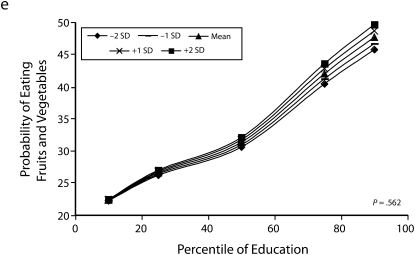
Predicted mean BMI and probability of hypertension, diabetes, low physical activity, and eating fruit and vegetables among women, by education according to different levels of urbanicity: National Survey of Risk Factors for Noncommunicable Diseases, Argentina, 2005.
Note. BMI = body mass index.
Heterogeneity of the social patterning of cardiovascular risk factors by urbanicity for women is shown in Figure 2. In general, women showed inverse gradients regardless of level of urbanicity. Among both men and women, results for BMI and diabetes showed stronger inverse associations with education in more urban than in less urban areas (P < .05 among women for both outcomes). The social patterning of hypertension and eating fruit and vegetables (with more education being associated with better profiles) was not substantially modified by urbanicity. By contrast to the other risk factors in women, more education was associated with greater probability of low physical activity in more urban areas, and the opposite pattern occurred in more rural areas (P = .002).
The varying social patterning by urbanicity we found also suggested that the relationship between urbanicity and chronic disease risk factors varied by level of education. Among men, greater urbanicity was associated with lower BMI and lower prevalence of hypertension and diabetes at high levels of education, but we detected no association or the opposite association at low levels of education. By contrast, greater urbanicity was associated with lower probability of fruit and vegetable intake at high levels of education, but the effect weakened at low levels of education. Our findings for BMI and diabetes were very similar among women and men: at high education levels, urbanicity was associated with lower levels of BMI and diabetes, but we found the opposite effects or no effect at low levels of education. Higher urbanicity was associated with lower probability of low physical activity, but differences were greater at lower than at higher education levels.
DISCUSSION
Our data demonstrate the complexity of social gradients in several major chronic disease risk factors and how urbanicity affects these gradients in a middle-income country in Latin America. Overall, our results showed that the socioeconomic patterning of risk factors was modified by urbanicity, such that for many of the risk factors examined, inverse socioeconomic patterning (i.e., lower risk factor levels in the more advantaged groups) became stronger or only emerged in more urban settings. This effect modification was stronger in men than in women. Two exceptions to this general pattern were eating fruit and vegetables among men and low physical activity among women. Both of these risk factors showed stronger inverse social patterning in less urban than in more urban areas: among men, higher education was more strongly associated with eating fruits and vegetables in less urban compared to more urban areas; among women, higher education was associated with lower probability of low physical activity in less urban areas, but the opposite was observed in more urban areas.
Our results also showed that the associations of urbanicity with risk factors were not homogeneous across social groups. For example, in both men and women, greater urbanicity had beneficial effects on BMI and diabetes for persons with more education but no effect or the opposite effect (worse risk factor levels in more urbanized areas) for persons with less education. We observed a similar pattern for hypertension in men. Among men, greater urbanicity was associated with a lower probability of fruit and vegetable intake, but only among the more educated. Among women, greater urbanicity had unfavorable effects on physical activity, but this was more pronounced in the less educated.
Few studies have investigated heterogeneity in socioeconomic patterning of chronic disease risk by urbanicity or other development indicators in developing countries. Most of these studies examined an urban–rural dichotomy, and none had a countrywide, population-based design. For example, an analysis of Chinese data found that higher SEP was associated with lower physical activity levels in both urban and rural areas.28 A study of older Chinese adults found that higher SEP was associated with fewer chronic health conditions (including hypertension, among others) in rural areas but more chronic health conditions in urban areas.29 In Bangladesh, the prevalence of diabetes by social class did not differ according to urbanicity.30
Data are limited on the social patterning of chronic disease risk factors according to urbanicity in Latin America. A study of older adults in Mexico found an inverse association between education and obesity in urban areas but a positive gradient in less urban areas; however, income was associated with an increase in obesity throughout the country.31 The data also provided evidence of effect modification by gender: the education–obesity relationship was negative for women but positive for men in urban areas. In a Brazilian study, results were more mixed.32 Among men, researchers found a positive social gradient for obesity with income in all areas and a slight inverse gradient with education in more developed areas only. Among women in less developed areas, obesity was positively associated with income and inversely associated with education; in more developed areas education was inversely associated with obesity but no association was observed with income.
The education patterns from the 2 studies in Latin America are generally consistent with our findings of inverse social gradients for women regardless of level of urbanicity, and increasingly inverse associations for men with increasing urbanicity. Just as increased chronic disease risk filters from urban to rural areas as countries develop, inverse social patterning emerges in urban areas and subsequently extends to rural areas. This may be because higher-SEP groups in urban areas recognize the detrimental health effects of certain behaviors and use their resources and power to change their behavior and environment.
Our results also showed that the effects of urbanicity on chronic disease risk varied by SEP. For example, urbanicity had favorable effects on BMI, hypertension, and diabetes for higher-SEP groups, but we observed adverse effects for some of these risk factors in low-SEP groups. However, this pattern was not present for all risk factors: among men, living in more urban areas was associated with less consumption of fruit and vegetables, and this effect was stronger in high-SEP groups, possibly because of changes in diet associated with urbanization in working-aged men. By contrast, urbanicity was clearly associated with lower physical activity among men regardless of SEP. This may be because occupations are typically more sedentary in urban areas. The opposite result for women—women in less urban areas were less physically active, with the differences most pronounced at low SEP—may indicate an increase in leisure time or work activity associated with urban living. Taken together, these findings illustrate the complex way that urbanization and social circumstances interact to shape chronic disease risk.
Our findings offer some insight into how the processes of globalization affect health, but many other areas have yet to be investigated. Are these patterns in Argentina typical of middle-income countries globally or perhaps just in Latin America? Does the rate of urbanization and economic development exacerbate social inequalities in chronic disease risk? What country-level policies reduce the overall burden as well as the inequalities in chronic disease risk factors? Are there ways that countries can simultaneously participate in globalization and reduce chronic disease burden and inequalities in chronic disease risk?
Limitations
Self-reported data undoubtedly introduce measurement error. For example, because people with lower SEP or who live in more rural provinces may have more limited access to medical care, we may have underestimated the prevalence of hypertension and diabetes for these groups.33 Also, the data were cross-sectional and captured a single point in time, so we were unable to determine whether the trends we observed existed well into the past or had only recently emerged.
Our study reported socioeconomic patterning according to only 1 marker of SEP: education. Additional analyses, not reported here, investigated the associations by household income; patterns were similar. The urbanicity indicator we investigated may have been a proxy for a variety of social and economic changes associated with urbanization. Urbanicity and 2 economic indicators (median household income by province, derived from the survey data, and a marker of provincial-level economic activity per capita) were highly correlated, making it difficult to distinguish between their effects (Spearman correlation coefficient = 0.78 and 0.73, respectively). In sensitivity analyses that used median household income by province, the results were similar.
The survey itself targeted people living in areas with 5000 people or more, so our results are not generalizable to people living in less populated areas. Nearly 90% of the population of Argentina lived in areas of 2000 people or more in 2001, making the survey approximately representative of the country. However, studies on countries with a greater variability in levels of urbanization could yield different results. Although the overall response rate was generally high, geographic and socioeconomic differences in response rates could have affected the patterns that we observed, if nonparticipants had different levels of risks factors than did participants.
Conclusions
Our study was among the first to use a nationally representative sample to examine heterogeneity in the social patterning of risk factors by geographic areas and level of urbanicity in a middle-income country. We observed inverse social gradients among women for most risk factors, regardless of level of urbanicity, and emerging inverse gradients among men with increasing levels of urbanicity.
Because middle-income countries are by definition in transition and often quite heterogeneous, they provide an ideal setting in which to investigate modifiers of socioeconomic patterning. As the world becomes more urban, with most growth occurring in developing countries, it is likely that we will see an increasing burden of chronic disease risk among the poor.
Acknowledgments
This work was supported by the Fogarty International Center and the National Institutes of Health (grant RO3 TW007020).
We thank Marta R. Prescott of the University of Michigan for helpful discussion.
Human Participant Protection
No protocol approval was required because the study used publicly available data from which identifying information was removed.
References
- 1.Mathers CD, Loncar D. Projections of global mortality and burden of disease from 2002 to 2030. PLoS Med. 2006;3(11):e442. [DOI] [PMC free article] [PubMed] [Google Scholar]
- 2.Reddy KS. Cardiovascular diseases in the developing countries: dimensions, determinants, dynamics and directions for public health action. Public Health Nutr. 2002;5(1A):231–237 [DOI] [PubMed] [Google Scholar]
- 3.Reddy KS, Yusuf S. Emerging epidemic of cardiovascular disease in developing countries. Circulation. 1998;97(6):596–601 [DOI] [PubMed] [Google Scholar]
- 4.Abegunde DO, Mathers CD, Adam T, Ortegon M, Strong K. The burden and costs of chronic diseases in low-income and middle-income countries. Lancet. 2007;370(9603):1929–1938 [DOI] [PubMed] [Google Scholar]
- 5.Omran AR. The epidemiologic transition. A theory of the epidemiology of population change. Milbank Mem Fund Q. 1971;49(4):509–538 [PubMed] [Google Scholar]
- 6.Boutayeb A. The double burden of communicable and non-communicable diseases in developing countries. Trans R Soc Trop Med Hyg. 2006;100(3):191–199 [DOI] [PubMed] [Google Scholar]
- 7.Department of Economic and Social Affairs World Population Ageing. New York, NY: United Nations; 2007 [Google Scholar]
- 8.Drewnowski A, Popkin BM. The nutrition transition: new trends in the global diet. Nutr Rev. 1997;55(2):31–43 [DOI] [PubMed] [Google Scholar]
- 9.Katzmarzyk PT, Mason C. The physical activity transition. J Phys Act Health. 2009;6(3):269–280 [DOI] [PubMed] [Google Scholar]
- 10.Popkin BM. Urbanization, lifestyle changes, and the nutrition transition. World Dev. 1999;27(11):1905–1916 [Google Scholar]
- 11.Popkin BM, Gordon-Larsen P. The nutrition transition: worldwide obesity dynamics and their determinants. Int J Obes Relat Metab Disord. 2004;28(suppl 3):S2–S9 [DOI] [PubMed] [Google Scholar]
- 12.Hawkes C. Uneven dietary development: linking the policies and processes of globalization with the nutrition transition, obesity and diet-related chronic diseases. Global Health. 2006;2:4. [DOI] [PMC free article] [PubMed] [Google Scholar]
- 13.Martine G. State of World Population 2007: Unleashing the Potential of Urban Growth. New York, NY: United Nations Population Fund; 2007 [Google Scholar]
- 14.Leeder S, Raymond S, Greenberg H, Liu H, Esson K. A Race Against Time: The Challenge of Cardiovascular Disease in Developing Economies. New York, NY: Columbia University; 2004 [Google Scholar]
- 15.Popkin BM. Global nutrition dynamics: the world is shifting rapidly toward a diet linked with noncommunicable diseases. Am J Clin Nutr. 2006;84(2):289–298 [DOI] [PubMed] [Google Scholar]
- 16.Yusuf S, Reddy S, Ounpuu S, Anand S. Global burden of cardiovascular diseases: part I: general considerations, the epidemiologic transition, risk factors, and impact of urbanization. Circulation. 2001;104(22):2746–2753 [DOI] [PubMed] [Google Scholar]
- 17.Uusitalo U, Pietinen P, Puska P. Dietary Transition in Developing Countries: Challenges for Chronic Disease Prevention. Geneva, Switzerland: World Health Organization; 2002 [Google Scholar]
- 18.Preventing Chronic Diseases: A Vital Investment: WHO Global Report. Geneva, Switzerland: World Health Organization; 2005 [Google Scholar]
- 19.Kaplan GA, Keil JE. Socioeconomic factors and cardiovascular disease: a review of the literature. Circulation. 1993;88(4 pt 1):1973–1998 [DOI] [PubMed] [Google Scholar]
- 20.McLaren L. Socioeconomic status and obesity. Epidemiol Rev. 2007;29:29–48 [DOI] [PubMed] [Google Scholar]
- 21.Ministerio de Salud de la Nación Encuesta Nacional de Factores de Riesgo [National Survey of Risk Factors for Noncommunicable Diseases]. 2006. Available at: http://www.msal.gov.ar/htm/Site/enfr/index.asp. Accessed October 21, 2009
- 22.Ferrante D, Virgolini M. Encuesta Nacional de Factores de Riesgo 2005: resultado principales [National Survey of Risk Factors for Noncommunicable Diseases 2005: principal results]. Rev Argent Cardiol. 2007;75:20–29 [Google Scholar]
- 23.Censo Nacional de Población. Hogares y viviendas 2001 [Homes and housing 2001]. Available at: http://www.indec.gov.ar/censo2001s2/ampliada_index.asp?mode=01. Accessed September 30, 2008.
- 24.Ministerio de Salud de la Nación Vigilancia de Enfermedades No Transmisibles [Surveillance of Noncommunicable Diseases]. Edición especial Buenos Aires, Brazil: Ministerio de Salud de la Nación; 2004 [Google Scholar]
- 25.Fleischer NL, Diez Roux AV, Alazraqui M, Spinelli H. Social patterning of chronic disease risk factors in a Latin American city. J Urban Health. 2008;85(6):923–937 [DOI] [PMC free article] [PubMed] [Google Scholar]
- 26.Vlassoff C. Gender differences in determinants and consequences of health and illness. J Health Popul Nutr. 2007;25(1):47–61 [PMC free article] [PubMed] [Google Scholar]
- 27.Liang KY, Zeger SL. Longitudinal data analysis using generalized linear models. Biometrika. 1986;73(1):13–22 [Google Scholar]
- 28.Popkin BM. The nutrition transition and its health implications in lower-income countries. Public Health Nutr. 1998;1(1):5–21 [DOI] [PubMed] [Google Scholar]
- 29.Zimmer Z, Kwong J. Socioeconomic status and health among older adults in rural and urban China. J Aging Health. 2004;16(1):44–70 [DOI] [PubMed] [Google Scholar]
- 30.abu Sayeed M, Ali L, Hussain MZ, Rumi MA, Banu A, Azad Khan AK. Effect of socioeconomic risk factors on the difference in prevalence of diabetes between rural and urban populations in Bangladesh. Diabetes Care. 1997;20(4):551–555 [DOI] [PubMed] [Google Scholar]
- 31.Smith KV, Goldman N. Socioeconomic differences in health among older adults in Mexico. Soc Sci Med. 2007;65(7):1372–1385 [DOI] [PubMed] [Google Scholar]
- 32.Monteiro CA, Conde WL, Popkin BM. Independent effects of income and education on the risk of obesity in the Brazilian adult population. J Nutr. 2001;131(3):881S–886S [DOI] [PubMed] [Google Scholar]
- 33.De Vaus D. Surveys in Social Research. 5th ed St. Leonards, Australia: Routledge; 2002 [Google Scholar]


