
Fig. 7.
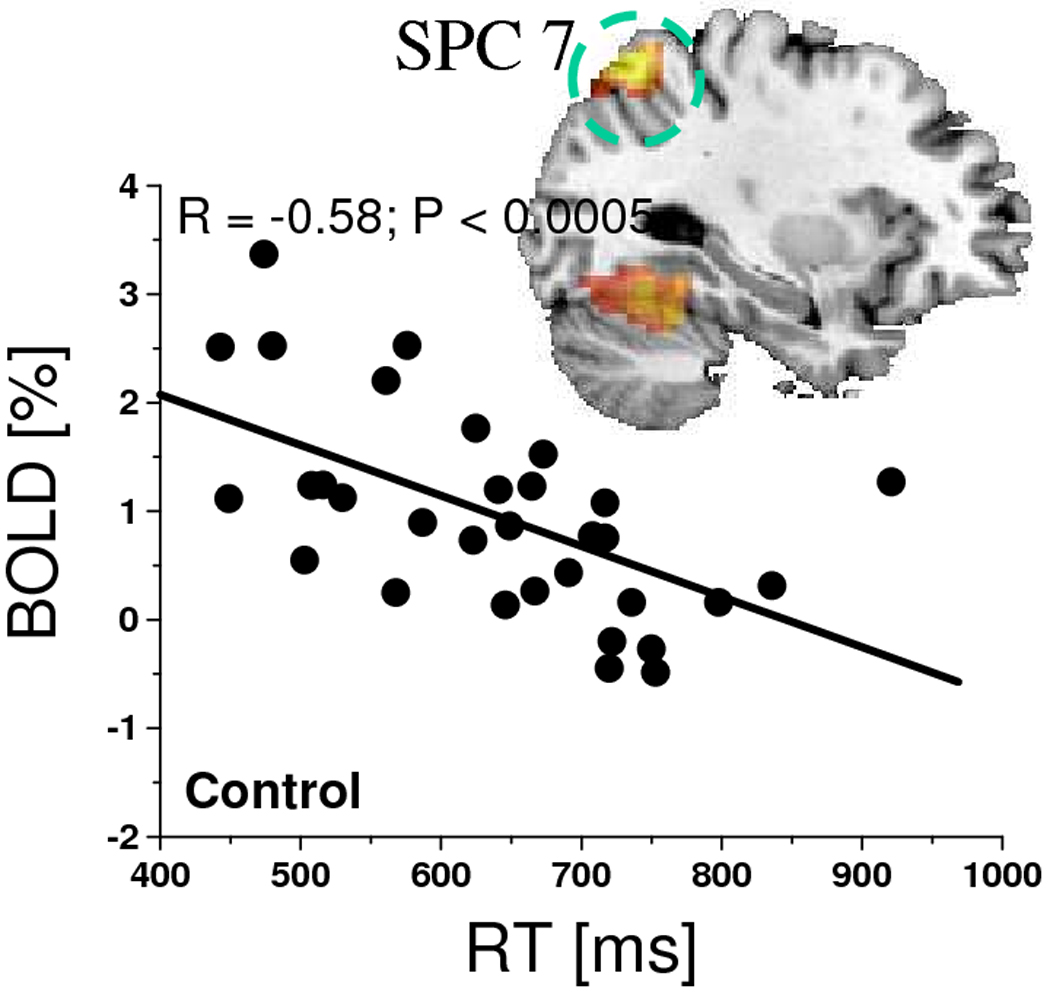
Scatter plot showing the negative correlation between RT and BOLD responses in the left superior parietal cortex (BA 7) during the 1-back and 2-back WM tasks for the control group and the corresponding negative correlation pattern superimposed on a sagital view of the human brain.