Abstract
Language is one of the defining abilities of humans. Many studies have characterized the neural correlates of different aspects of language processing. However, the imaging techniques typically used in these studies were limited in either their temporal or spatial resolution. Electrocorticographic (ECoG) recordings from the surface of the brain combine high spatial with high temporal resolution, and thus could be a valuable tool for the study of neural correlates of language function. In this study, we defined the spatiotemporal dynamics of ECoG activity during a word repetition task in nine human subjects. ECoG was recorded while each subject overtly or covertly repeated words that were presented either visually or auditorily. ECoG amplitudes in the high gamma (HG) band confidently tracked neural changes associated with stimulus presentation and with the subject's verbal response. Overt word production was primarily associated with HG changes in the superior and middle parts of temporal lobe, Wernicke's area, the supramarginal gyrus, Broca's area, premotor cortex (PMC), primary motor cortex. Covert word production was primarily associated with HG changes in superior temporal lobe and the supramarginal gyrus. Acoustic processing from both auditory stimuli as well as the subject's own voice resulted in HG power changes in superior temporal lobe and Wernicke's area. In summary, this study represents a comprehensive characterization of overt and covert speech using electrophysiological imaging with high spatial and temporal resolution. It thereby complements the findings of previous neuroimaging studies of language and thus further adds to current understanding of word processing in humans.
Keywords: word processing, Electrocorticography (ECoG), High Gamma activity, temporal lobe, verbal response
1. Introduction
Many studies have focused on the functional neuroanatomy and the neural correlates of language processing using different methodologies that included lesion and behavioral studies (Dronkers, 1996; Watkins et al., 2002; Dronkers et al., 2004; Rosen et al., 2006; Agosta et al., 2010), and neuroimaging with positron emission tomography (PET) or functional magnetic resonance imaging (fMRI) (Price et al., 1996a,b; Price, 2000; Binder et al., 2000; Fiez and Petersen, 1998)). This work has repeatedly confirmed the important roles of Broca's area and Wernicke's area in production and comprehension of speech, respectively ((Price, 2000; Démonet et al., 2005) for review). These studies also revealed that language processing involves a widely distributed network of different cortical areas, but how these areas dynamically interact to perceive and produce speech has remained largely unclear.
The primary source of experimental evidence in language-related studies has been neuroimaging, in particular fMRI. However, because fMRI cannot readily track rapid brain signal changes, it does not lend itself to elucidating the spatiotemporal dynamics of cortical activity in distributed cortical networks. In response, recent studies (Fried et al., 1981; Crone et al., 2001b,a; Sinai et al., 2005; Edwards et al., 2005; Canolty et al., 2007; Towle et al., 2008; Edwards et al., 2009) have begun to investigate neural correlates of speech using electrocorticographic (ECoG) recordings from the surface of the brain, which combine good spatial resolution with good temporal resolution. These and other studies (Aoki et al., 1999, 2001; Leuthardt et al., 2007; Miller et al., 2007a; Brunner et al., 2009) consistently showed that ECoG amplitude over anatomically appropriate areas decreased during a task in mu and beta frequency bands and increased in gamma bands. These studies also showed that sites with gamma changes are concordant with those identified using electrical cortical stimulation (ECS) (Sinai et al., 2005; Leuthardt et al., 2007; Miller et al., 2007a; Brunner et al., 2009) or metabolic imaging (Niessing et al., 2005; Lachaux et al., 2007). These results suggest that ECoG gamma activity could provide important information about the spatiotemporal dynamics of language processing, but these dynamics have not been comprehensively characterized, in particular for covert language processing.
In this study, we characterize the spatiotemporal evolution of ECoG gamma activity during a word repetition task in which nine subjects were asked to overtly or covertly repeat words that were presented to them auditorily or visually. Our results reveal the ECoG gamma dynamics that are differentially engaged by visual or auditory stimuli and by overt or covert word production, respectively. In summary, this study extends the findings of previous studies of word processing by providing a detailed spatiotemporal characterization of spatially distributed cortical structures engaged across different phases of word processing. Thus, the contribution of our study is to demonstrate that ECoG HG activity can be used to investigate the dynamic cortical activations associated with the different stages of overt and covert word repetition in high spatial and temporal detail.
2. Method
2.1. Subjects
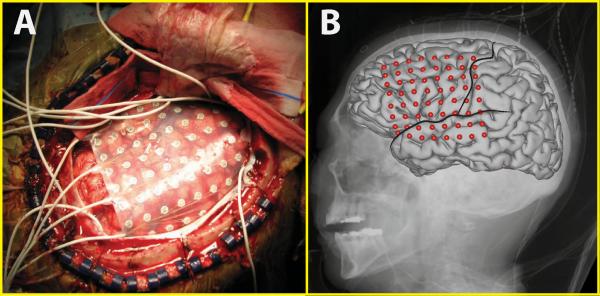
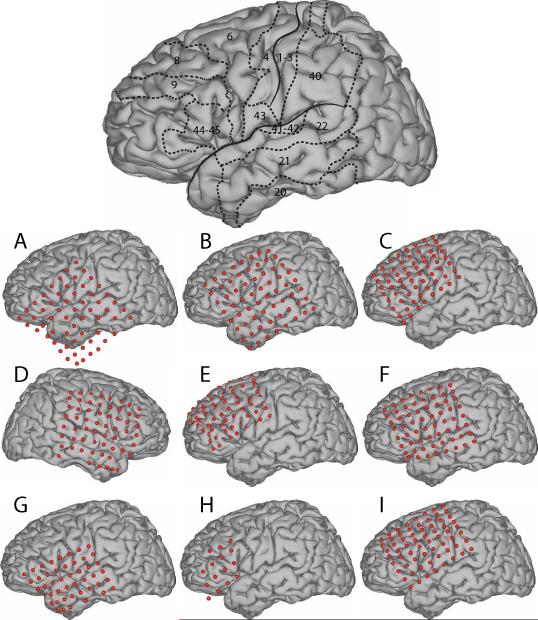
The subjects in this study were nine subjects with intractable epilepsy who underwent temporary placement of subdural electrode arrays (see Fig. 1 for an example) to localize seizure foci prior to surgical resection. They included three men (subjects C, H and I) and six women (subjects A, B, D, E, F, and G). (See Table 1 for additional information.) All gave informed consent for the study, which was approved by the Institutional Review Board of Washington University School of Medicine and the Human Research Protections Office of the U.S. Army Medical Research and Materiel Command. Each subject had an electrode grid (15, 48, or 64 contacts) placed over frontal, parietal and temporal regions (see Fig. 2 for details). Grid placement and duration of ECoG monitoring were based solely on the requirements of the clinical evaluation, without any consideration of this study. As shown in Fig. 2, electrode coverage varied across subjects. (See Discussion about statistical implications.) These grids consisted of flat electrodes with an exposed diameter of 2.3 mm and an inter-electrode distance of 1 cm, and were implanted for about one week. The electrodes for all subjects except subject D were localized over the left hemisphere. Following placement of the subdural grid, each subject had postoperative anterior-posterior and lateral radiographs to verify grid location.
Figure 1.
ECoG array for Subject F. A: 8*8 electrode grid on the surface of the brain. B: Average brain template and electrode locations co-registered to the x-ray image. Two black lines delineate the approximate locations of the precentral sulcus and Sylvian fissure, respectively.
Table 1.
Clinical profiles.
| Subject | Age | Sex | Hand | Grid Location | Tasks |
|---|---|---|---|---|---|
| A | 16 | F | R | left frontal-parietal-temporal | Overt/Covert word repetition |
| B | 44 | F | L | left frontal-parietal-temporal | Overt/Covert word repetition |
| C | 44 | M | R | left frontal | Overt word repetition |
| D | 47 | F | R | right frontal-parietal-temporal | Overt word repetition |
| E | 58 | F | R | left frontal | Overt/Covert word repetition |
| F | 48 | F | R | left frontal-parietal-temporal | Overt/Covert word repetition |
| G | 49 | F | R | left frontal-parietal-temporal | Overt/Covert word repetition |
| H | 15 | M | R | left frontal | Overt word repetition |
| I | 55 | M | R | left frontal-parietal | Overt/Covert word repetition |
Figure 2.
Approximate electrode locations. The brain template on the top delineates the approximate locations of the central sulcus and Sylvian fissure, and also outlines relevant Brodmann areas.
2.2. Experimental Paradigm
During the study, each subject was in a semi-recumbent position in a hospital bed about 1 m from a video screen. In separate experimental runs, ECoG was recorded during four different conditions: word repetition using overt or covert speech in response to visual or auditory word stimuli. Throughout the paper, we will refer to these conditions as “Visual/Overt,” “Audio/Overt,” “Visual/Covert,” and “Audio/Covert.” Visual and auditory stimuli consisted of 36 words that were presented on a video monitor or through headphones, respectively. These words were monosyllables with consonant-vowel-consonant (CVC) structure and were either consonant matched (i.e., contained one of nine consonant pairs) or vowel matched (i.e., contained one of four vowels). (See Table 2 for additional information.) In each trial, the subject was randomly presented with one of the words either visually or auditorily. In different runs, the subject's task was to repeat or imagine repeating the presented word. Visual stimuli were displayed on the screen for 4 seconds, followed by a break of 0.5 seconds during which the screen was blank (i.e., 4.5 seconds per trial). For the auditory conditions, the total trial duration was identical, but the duration of the auditory stimuli varied with the different words (i.e., mean 0.53 seconds, standard deviation 0.09 seconds).
Table 2.
The words that were presented to the subjects auditorily or visually. Words were monosyllables with Consonant-Vowel-Consonant (CVC) structure that consisted of one of four vowels and one of nine consonant pairs.
| cvc | b_t | c_n | h_d | l_d | m_n | p_p | r_d | s_t | t_n |
|---|---|---|---|---|---|---|---|---|---|
| eh | bet | ken | head | led | men | pep | red | set | ten |
| ah | bat | can | had | lad | man | pap | rad | sat | tan |
| ee | beat | keen | heed | lead | mean | peep | read | seat | teen |
| oo | boot | coon | hood | lewd | moon | poop | rood | soot | toon |
2.3. Data Collection
In all experiments, we recorded ECoG from the electrode grid using the general-purpose BCI2000 software (Schalk et al., 2004) that was connected to five g.USBamp amplifier/digitizer systems (g.tec, Graz, Austria). Simultaneous clinical monitoring was achieved using a connector that split the cables coming from the subject into one set that was connected to the clinical monitoring system and another set that was connected to the BCI2000/g.USBamp system. Thus, at no time was clinical care or clinical data collection affected. All electrodes were referenced to an inactive electrode. In a subset of subjects (B, E, F, G, I), the verbal response was recorded using a microphone; in the remaining subjects, speech onset was detected using the g.TRIGbox (g.tec, Graz, Austria). The ECoG signals and microphone signal were amplified, bandpass filtered (0.15–500 Hz), digitized at 1200 Hz, and stored by BCI2000. We collected 2–7 experimental runs of ECoG from each subject for each of the four conditions during one or two sessions. Each run included 36 trials (140 trials total per condition, on average). All nine subjects participated in the experiments using overt word repetition; a subset of six subjects (A, B, E, F, G, I) participated in experiments using covert word repetition. Each dataset was visually inspected and all artifactual channels were removed prior to analysis, which left 15–64 channels that were analyzed as described further below.
2.4. 3D Cortical Mapping
We used lateral skull radiographs to identify the stereotactic coordinates of each grid electrode with software (Miller et al., 2007b) that duplicated the manual procedure described in (Fox et al., 1985). We defined cortical areas using Talairach's Co-Planar Stereotaxic Atlas of the Human Brain (Talairach and Tournoux, 1988) and a Talairach transformation (http://www.talairach.org, (Lancaster et al., 1997, 2000)). We obtained a 3D cortical brain model from source code provided on the AFNI SUMA website (http://afni.nimh.nih.gov/afni/suma). Of note, the lines in Fig. 1 and Fig. 2 were derived from the borders of the Brodmann areas (Brodmann, 1909) defined by the Talairach daemon, which are close to, but do not exactly match, the sulci in the MNI brain. Therefore, these lines give approximate locations of relevant Brodmann areas, as well as the precentral sulcus and Sylvian fissure.
2.5. Data Analysis and Brain Mapping
We first re-referenced the signal from each electrode using a common average reference (CAR) montage (Schalk et al., 2007). Then, every 50 ms, we converted the time-series ECoG signals of the previous 167 ms into the frequency domain with an autoregressive model (Marple, 1987) of order 25. Using this model, we calculated spectral amplitudes between 0 and 196 Hz in 2-Hz bins. We then averaged these spectral amplitudes in particular frequency range between 70 and 170 Hz, excluding the 116–124 Hz band, which produced a time course of high gamma (HG) power for each location. A large number of ECoG studies have shown that functional activation of cortex is consistently associated with a broadband increase in signal power at high frequencies, i.e., typically > 60 Hz and extending up to 200 Hz and beyond (Crone et al., 2006). These high gamma responses have been observed in different functional domains including motor, visual, language, and auditory (Crone et al., 1998; Edwards et al., 2005; Crone et al., 2001b,a). Other studies have shown that the use of different high gamma frequency bands resulted in very similar results (Ray et al., 2008a,b). Thus, while the specific selection of the frequency band is somewhat arbitrary, we selected the 70–170 Hz band based on three considerations: this frequency band 1) covers the broadband high frequency response (Miller et al., 2009); 2) avoids the 60 Hz power line frequency and its harmonics; 3) produced maximum r2 values when we evaluated different frequency bands.
We also calculated the temporal envelopes of the auditory stimuli and the subject's verbal response to relate the spatiotemporal brain dynamics of processing auditory input or speech output, respectively. To calculate the temporal envelope of the auditory stimuli, we first squared the amplitude of the time course of the auditory stimulus for each word. Then, we applied to each of these squared amplitude time courses a low pass filter (cut-off frequency 6 Hz, Butterworth IIR filter of order 3) to extract the temporal envelope of each word stimulus. Finally, we normalized each temporal envelope by its maximum and averaged those envelopes across all 36 words. The resulting average time course of the auditory stimuli indicated their general onset, offset and duration. We followed a similar procedure to determine the average verbal response from the microphone recordings, which indicated the onset (defined as the time at which the recording exceeded an empirically chosen threshold (0.05)), offset and duration of word production. The onset of the verbal response in the five subjects was 540±42 ms and 808±65 ms for visual and auditory stimuli, respectively.
To determine the difference in ECoG amplitudes (e.g., HG power) between different conditions, and to thereby derive a metric of cortical activation, we calculated the coefficient of determination (r2) (Wonnacott and Wonnacott, 1977) of ECoG amplitudes for each electrode and between the task (e.g., overt/covert speech in response to visual/auditory word presentation) and rest, and also between the overt and covert speech tasks. Because the r2 metric reflects the difference of the distributions of HG spectra between two conditions (i.e., task and rest), this analysis determined, for a particular subject and particular experimental condition, location, and time point, the statistical difference between a task (e.g., overt production of any word) and rest, and between overt and covert tasks, respectively. The rest state was defined by the collection of ECoG signals during all 500 ms inter-trial intervals.
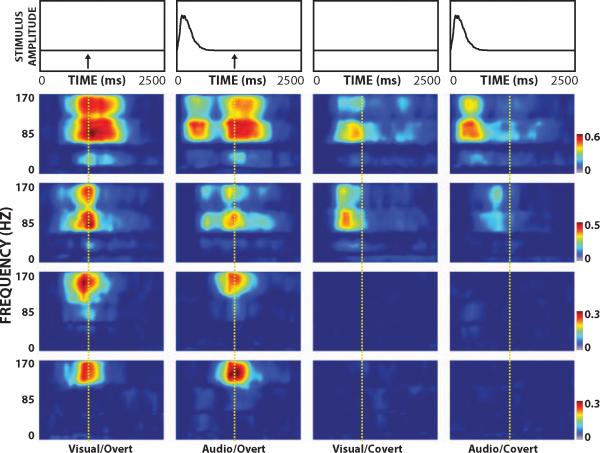
Fig. S1 in the Supplemental Material shows an example of the raw ECoG and the corresponding HG amplitude time course from selected locations for subject A following presentation of one stimulus. Fig. 3 shows an example of the color-coded time-frequency distribution of r2 values (Bonferroni-corrected p-value=0.004 when r2=0.026) for the channels highlighted in Fig.S1-C (30, 40, 53 and 55 (from top to bottom, respectively)) for all four experimental conditions, the corresponding averaged temporal envelope of the auditory stimuli, and onset of the verbal response (dashed line). This figure illustrates the differential activation of ECoG activity at different times, locations, and frequencies in each of the four experimental conditions.
Figure 3.
Example of r2 time-frequency distribution for the indicated experimental condition (bottom) and temporal envelope of the auditory stimulus (top). Arrows mark the onset of the subject's response. Figures from top to bottom correspond to results from channel 30, 40, 53 and 55, respectively. Signals at different times, locations, and frequencies and for different experimental conditions relate to different aspects of the stimulus or response. The vertical dashed line indicates the onset of the verbal response during overt speech.
To visualize the spatial distribution of r2 values, we projected each electrode from all subjects onto the 3D template brain model (see Discussion for further comments) and rendered color-coded topographical maps using a custom Matlab program that used a linear fading function that dropped off to zero at the inter-electrode distance.
3. Results
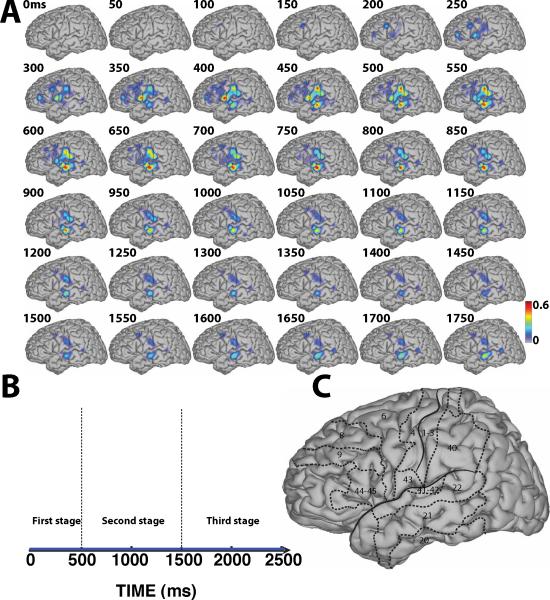
The principal results of this study are given in Fig. 4 – Fig. 7. These topographical maps characterize the spatiotemporal dynamics of ECoG HG activity for the four different experimental conditions by showing the time-varying topographical distribution of color-coded r2 values that were calculated for the high gamma band between the word repetition tasks and rest at each location and time, and that were superimposed across all subjects except subject D. Fig. 9 – 10 show the results of a comparison between overt and covert tasks. Also, the Supplementary Material includes results for subject D at the level of single subject, whose grid was placed on the right hemisphere. In addition, these figures also show the averaged temporal envelope of the auditory stimuli and the verbal response. These results are described in more detail below.
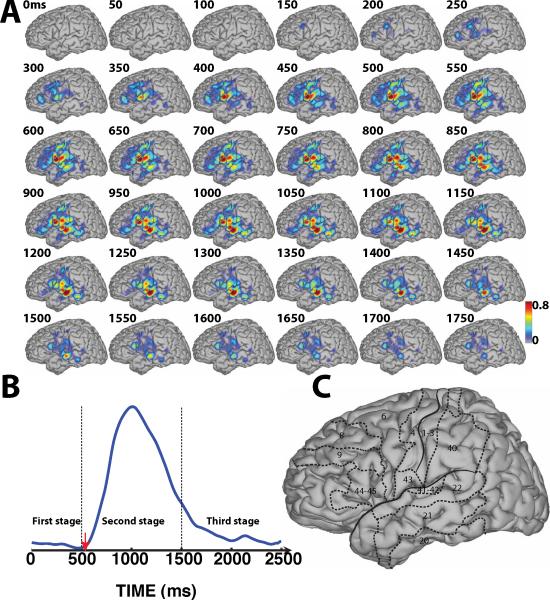
Figure 4.
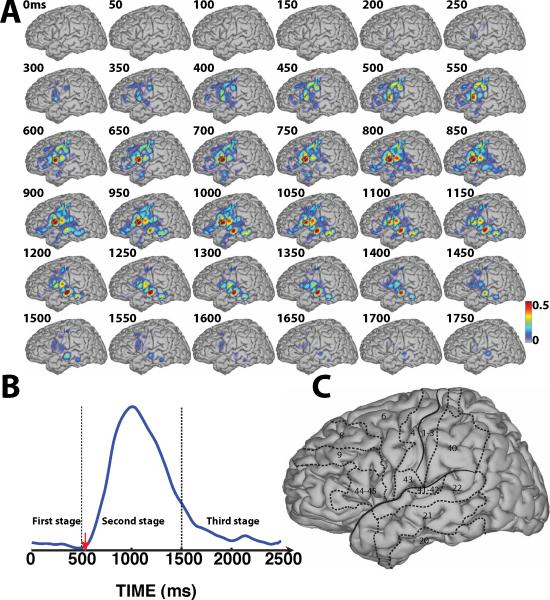
Spatiotemporal dynamics of word processing for the Visual/Overt condition. A: Color-coded r2 values are superimposed across all subjects except subject D. B: Averaged temporal envelope for verbal response (blue trace) and voice onset (red arrow). C: Outline of the approximate location of relevant Brodmann areas. (See Supplementary Video 1)
Figure 7.
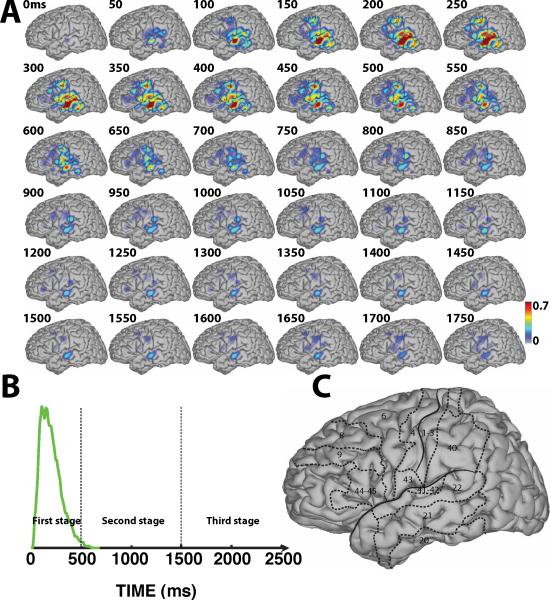
Spatiotemporal dynamics of word processing for the Audio/Covert condition. A: Color-coded r2 values are superimposed across all subjects that participated in the imagery tasks (i.e., A, B, E, F, G, I). B: Averaged temporal envelope for the auditory stimuli (green trace). C: Outline of the approximate location of relevant Brodmann areas.
Figure 9.
Comparison between overt and covert speech following visual stimuli. A: Color-coded r2 values superimposed across all subjects that participated in both the overt and covert speech tasks (i.e., A, B, E, F, G, I). B: Averaged temporal envelope for verbal response (blue trace), and onset of the verbal response (red arrow). C: Outline of the approximate location of relevant Brodmann areas.
Figure 10.
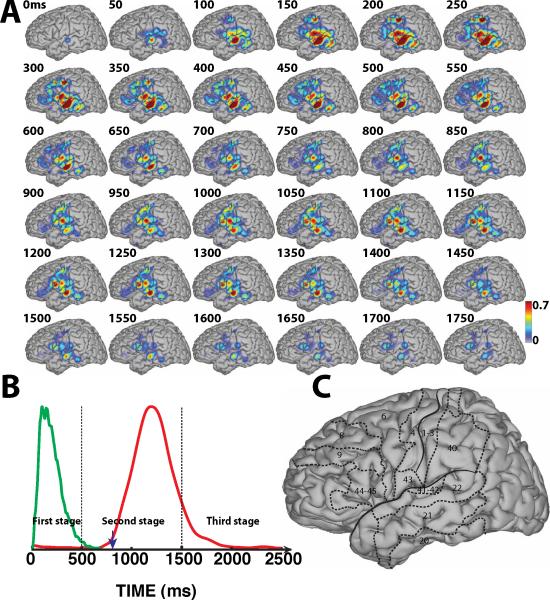
Comparison between overt and covert speech following auditory stimuli. A: Color-coded r2 values superimposed across all subjects that participated in both the overt and covert speech tasks (i.e., A, B, E, F, G, I). B: Averaged temporal envelope for the auditory stimuli (green trace) and verbal response (red trace), as well as the onset of the verbal response (blue arrow). C: Outline of the approximate location of relevant Brodmann areas.
3.1. Three Stages of Word Processing
The brain's translation of the auditory or visual stimuli into overt or covert speech is a continuous and dynamic process. Also, the onset of the verbal response is variable within and across subjects. For the sake of simplicity in describing the temporal evolution of our results, we divided the cortical responses into three stages in our descriptions below: 1) the brain's response to sensory input prior to onset of the behavioral response (about 0–500 ms); 2) neural correlates of the behavioral response (about 500–1500 ms); and 3) recovery to baseline after the offset of the behavioral response (after about 1500 ms). Since we chose a rest state as the basis for our comparisons, the topographies in Fig. 4 – Fig. 7 reflect multiple levels of processing including the immediate responses to the sensory stimulus and also language-related processing. The verbal response can be characterized by onset, offset and duration of the temporal envelope derived from the recorded microphone signal (blue and red traces, respectively). The brain's response to auditory stimuli can be categorized using the onset and offset of the temporal envelope derived from the auditory stimuli, which ranged from stimulus onset to about 500 ms. The blue and red traces in Fig. 4-B and Fig. 5-B, respectively, illustrate that the subjects' verbal responses following auditory stimuli was delayed compared to those following visual stimuli. Because the onset and offset of the verbal responses are not defined for the covert speech conditions, we used the onset/offset of the overt speech condition for our discussions of the covert speech condition.
Figure 5.
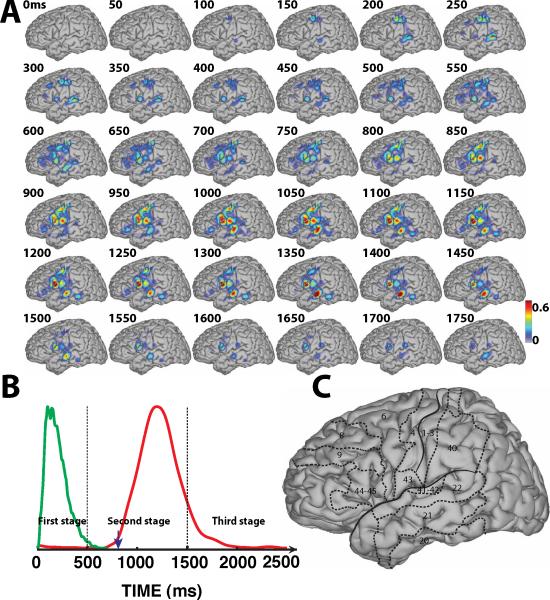
Spatiotemporal dynamics of word processing for the Audio/Overt condition. A: Color-coded r2 values are superimposed across all subjects except subject D. B: Averaged temporal envelope for auditory stimuli (green trace) and microphone signal (red trace), and voice onset (blue arrow). C: Outline of the approximate location of relevant Brodmann areas. (See Supplementary Video 2)
3.2. Stage 1: Response to Sensory Input
Fig. 4-A shows the results for the Visual/Overt condition. The topographies in this figure show practically no cortical responses to the visual stimulus prior to 150 ms. This is not surprising given that the subjects did not have electrode coverage of visual areas. Beginning at around 150 ms, cortical activations gradually increased over BA6 (premotor cortex (PMC)) (see topographies between 250–500 ms in Fig. 4-A). These activations may reflect preparatory activation of PMC during planning stages of verbal articulation. These activations then continued to spread to BA22 (STG), BA43 and also BA40 (part of supramarginal gyrus) (see topographies between 400–500 ms in Fig. 4-A). These activations may reflect early verbal responses and/or transitional processing of short-term phonological memory prior to word repetition, respectively.
Fig. 5-A shows the results for the Audio/Overt condition. The topographies in this figure reflect multiple levels of processing including acoustic processing (see the small focus in BA41/42/22 beginning at 0 ms) as well as subsequent speech-related processing. These responses subsequently begin to broaden to widespread perisylvian regions, which may reflect aspects of speech perception and recognition. They reached maximum values around 250 ms after the peak of the temporal envelope of the auditory stimuli (green line in Fig. 5-B)), which is a little earlier than that of a gamma peak (330 ms) associated with pure tone stimuli in a previous EEG study (Haenschel et al., 2000). These responses are subsequently decreasing in amplitude and spatial coverage until around 700 ms. This temporal evolution of these early responses corresponds well to the temporal envelope of the auditory stimuli. The cortical activations over PMC also increased and peaked at around 250 ms, which suggests that PMC may also play a role during speech processing.
Compared with activations in response to visual stimuli, activations corresponding to auditory stimuli surrounding the perisylvian fissure and BA21 (posterior MTG) were much more pronounced and appeared approximately 300 ms earlier. This difference may reflect the distinct cortical pathways engaged in translating the different sensory inputs into speech output as well as auditory- and visual-level sensory processing. The finding that auditory stimuli induced strong activations over regions surrounding the perisylvian fissure is consistent with those of previous studies on auditory speech processing (Binder et al., 2000; Price, 2000; Price et al., 1996b). Interestingly, during the first stage of word processing, the brain responses following both auditory and visual stimuli included activations in premotor cortex (i.e., BA6). This is consistent with previous results (Duffau et al., 2003) that demonstrated that the left dominant premotor cortex — in particular the ventral part of premotor cortex — played a major role in articulatory planning.
Compared to cortical activations associated with overt word production during this first stage, both covert speech conditions resulted in cortical activations that were less pronounced, occurred over more localized cortical areas, but nevertheless followed a similar time course compared to those for the overt speech conditions.
3.3. Stage 2: Overt/Covert Word Production
During the second stage, i.e., overt/covert word production, the subject either spoke or imagined speaking the word that was presented visually or auditorily. Overt word production requires that the cortex orchestrates the motor commands that lead to the production of the word, as well as the auditory and speech processing that results from sensory feedback of that spoken word. Hence, it appears reasonable to expect that the spatial patterns of cortical activations associated with word production are somewhat similar for both overt speech conditions (i.e., irrespective of sensory input modality), and that some of the cortical activations follow the temporal envelope of the subject's verbal response. For covert word production, one may expect temporal lobe/Wernicke's area activations that are associated with mental rehearsal of the imagined word.
For overt word repetition following visual stimuli (Fig. 4-A), starting at 500 ms after stimulus presentation, cortical activations began to extend to the regions surrounding the perisylvian fissure including PMC and temporal lobe, until these activations reached their peak at around 1000 ms. This time roughly corresponds to the peak of the verbal response (see blue line in Fig. 4-B). Similar cortical activations occurred for overt word repetition following auditory stimuli (Fig. 5-A). The peak of these activations over those regions is somewhat delayed (around 1200 ms) compared to that following visual stimulation, but again corresponds to the peak of the verbal response (red line in Fig. 5-B). In general, the topography of the cortical activations for visual and auditory stimulus presentation are approximately comparable, except that the activations for auditory stimulus presentation appear to be trailing those for visual stimulus presentation by about 200 ms. For example, compare topographies at 650 ms in Fig. 4-A to those at 850 ms in Fig. 5-A, or topographies at 900 ms in Fig. 4-A to those at 1100 ms in Fig. 5-A. We also find that the cortical activations over Broca's area (BA44–45) reached their maximum around 850 ms and 1050 ms for Visual/Overt and Audio/Overt conditions, respectively, thereby preceding the peak of verbal response by about 100–150 ms. Finally, the cortical activations over PMC were decreasing in parallel with an increase over inferior posterior frontal cortex. This observation is consistent with the notion that PMC has a preferential role in the planning of motor action, whereas primary motor cortex (i.e., BA4) is directly involved in the motoric aspects of motor execution, i.e., the overt production of speech.
During that second stage, covert word production resulted in activation patterns that were similar for visual and auditory stimuli. Compared to overt word production, covert word repetition produced more localized and smaller changes that were localized mainly to posterior parts of BA22, but also BA41/42 and BA40, i.e., the regions surrounding the perisylvian fissure that are part of Wernicke's area. The small cortical activations over primary motor cortex suggest that the dominant processes in covert word production are word comprehension and phonological processing rather than imagery of the motor actions of speech production.
3.4. Recovery to Baseline
The third stage of word processing (starting from around 1500 ms after stimulus onset) consists of the brain's gradual recovery process from an activated state back to a baseline state. As shown in Fig. 4-A and Fig. 5-A, cortical activations tracked the fading verbal response. In addition, the Supplementary Videos show that the brain activations gradually decrease to the idle state until about 2000 ms. In addition, for both overt speech conditions, cortical activations show similar topographic patterns until the idle state.
3.5. Activation Time Course
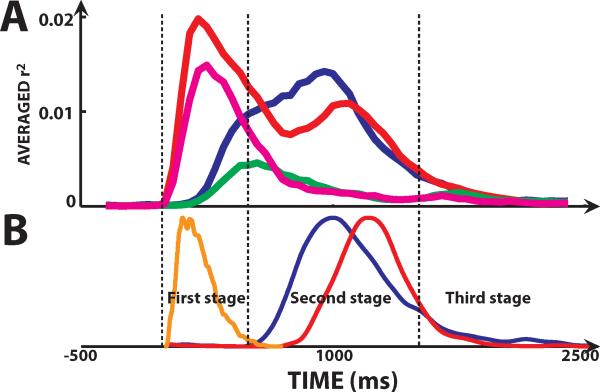
In addition to the topographical analyses described above, we derived, for each of the four conditions, the averaged time course of r2 across all electrodes from all left-hemisphere subjects. The results are shown in Fig. 8. First, they show that the response to auditory stimulation during the first 500 ms reached its peak around 200 ms and 250 ms for overt and covert speech, respectively. Those times are somewhat delayed compared to the peak of the temporal envelope of the auditory stimuli (i.e., 100 ms). There is no peak in the responses to visuali stimuli during the first 500 ms (presumably due to missing coverage of visual areas – see Discussion for further comments). Second, for overt word production, visual and auditory stimuli correspond to peaks in the average r2 time course around 950 ms and 1100 ms, respectively. These peaks correspond to those in the microphone signals at 985 ms and 1200 ms, respectively. Third, compared to overt word production, covert word production resulted in smaller r2 time courses. In summary, Fig. 8 demonstrates that ECoG HG gamma can characterize the neural responses during overt and covert speech tasks, and that those responses relate well to the temporal evolution of the stimuli and the subjects' response.
Figure 8.
Activation time course. A: Averaged time course of r2 computed for all electrodes from all left-hemisphere subjects during each of the four different tasks. Blue and red traces correspond to responses for overt speech following visual and auditory stimuli, respectively; green and purple traces correspond to responses for covert speech following visual and auditory stimuli, respectively. B: Averaged temporal envelope of auditory stimuli (orange trace) and verbal responses following visual (blue trace) and auditory (red trace) stimuli, respectively.
3.6. Comparison Between Spatiotemporal Dynamics of Overt and Covert Word Production
To our knowledge, no previous study reported the difference between overt and covert speech tasks in high spatial and temporal detail. Thus, we compared, in additional analyses, HG activation between overt and covert speech tasks, and did so separately for visual and auditory stimulus presentation (see Fig. 9 and Fig. 10). Because these analyses reflect the statistical difference of spatiotemporal patterns between overt and covert speech tasks, they attenuated the cortical activations that were common to overt and covert tasks, but highlighted their differences. Here, the comparison was made for those six subjects (i.e., A, B, E, F, G, I) who participated in both overt and covert speech tasks.
First, as expected, our analyses did not reveal substantial differences between overt and covert word processing early after stimulus presentation, i.e., from 0–250 ms for visual stimuli and from 0–100 ms for auditory stimuli. It is interesting to note that there were pronounced differences between overt and covert conditions between 200–500 ms over the posterior STG (i.e., Wernicke's area) during auditory stimulus presentation that were not present during visual stimulus presentation. This may suggest an important role of Wernicke's area in translating auditory speech input into overt speech output. This finding is consistent with the classical neurological model of language that suggests that connections between primary auditory cortex and Wernicke's area link auditory word forms to the corresponding speech output ((Price, 2000) for review).
Second, during word production (i.e., between 850–1400 ms following visual stimuli and between 950–1550 ms following auditory stimuli), we see strong differences between overt and covert word production over SMA, PMC, Broca's area, and STG. This suggests that these areas play an important role in overt, but not covert, speech-related motor output. Earlier during that stage, i.e., around 650–800 ms, we still see substantial differences over SMA, PMC and Broca's area but not over temporal lobe, which could be explained by the fact that overt and covert word production resulted in similar activations in this area. Fig. 4 to Fig. 7 show that covert word repetition induced weaker and less distributed cortical activations than those induced by overt word repetition. Therefore, the difference shown in Fig. 9 and Fig. 10 reflect a more pronounced brain response for overt tasks compared to covert tasks.
Third, the difference in STG between overt and covert speech tasks following visual stimuli (Fig. 9) and auditory stimuli (Fig. 10) peak around 1200 ms and 1350 ms, respectively. These times of peak difference are later than those for the corresponding microphone signals (i.e., 1000 ms and 1200 ms, respectively). This may indicate that auditory cortex processes the feedback from the subject's own voice during the overt speech response, but not during the covert speech response.
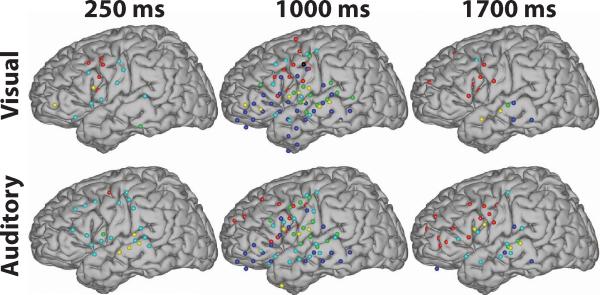
Finally, we highlighted the location of statistically significant (p-value ≤ 0.001) ECoG HG differences between overt and covert speech at representative times (250 ms, 1000 ms, 1700 ms) during each of the three stages (stimulus presentation, overt/covert word production and recovery). The total number of electrodes in the six subjects was 368. The number of electrodes with significant r2 values at these three times account for about 6%, 19% and 9% of the total number of electrodes, respectively. This demonstrates that the differences between overt and covert speech tasks were largest and most widely distributed during word production, and smallest and most focused during stimulus presentation.
4. Discussion
In the first large study of its kind, we comprehensively characterized the spatiotemporal dynamics of ECoG gamma activity during four different conditions of word processing, and related the results to the temporal envelope of auditory stimulation and the subject's verbal response. The results presented here thereby expand on the mostly spatial information provided by previous neuroimaging studies, and further reinforce the important role of gamma changes as a general index of cortical activation.
4.1. Limitations of the Present Study
While our study provides comprehensive information, it does have two limitations that are worth noting. First, electrode coverage was incomplete and varied across subjects. For example, no subject had occipital coverage, and thus we could not observe the expected ECoG responses to the visual stimuli in visual cortices. Also, almost all subjects except subject D had grids placed on the left hemisphere. Thus, we could not systematically compare cortical activations across the two hemispheres. While speech function is largely lateralized to the left hemisphere, language studies in other modalities also showed cortical activity in the right hemisphere (Church et al., 2008). This is consistent with the findings in our subject with right-sided coverage (see Supplementary Material Figs. 2 and 3). The varying coverage may also introduce a systematic bias in the topographies towards those areas that are common to most subjects. This problem could be handled in different ways, but all these approaches have limitations. However, this and previous studies (Schalk et al., 2007; Miller et al., 2007a; Leuthardt et al., 2007; Kubánek et al., 2009) that used a similar methodology consistently produced results that were in line with those using other imaging techniques. As shown in Fig. 2, the density of the electrode distribution over the frontal lobe was much higher than that over the temporal lobe, which biases our results towards frontal regions. However, during both auditory stimulus presentation and overt word production, we still observed the expected pronounced cortical activations over temporal regions. Second, we recorded the verbal response in only five of the nine subjects. In the remaining four subjects, we simply detected the onset of the response. Thus, the averaged temporal envelope of the verbal response showed in Fig. 4-B to Fig. 7-B was derived from only a subset of five subjects, whereas the topographies were calculated from all subjects. Third, considering the simplicity of the tasks, our study did not examine all possible aspects of word processing.
4.2. Comparison to Neuroimaging Studies
The results shown here are consistent with those of previous neuroimaging studies (Fiez and Petersen, 1998; Price et al., 1996a,b; Price, 2000). For example, we found robust activations over BA4, and lateral premotor cortex, i.e., BA6 during word production. These areas have been shown previously (Petersen and Fiez, 1993; Fiez and Petersen, 1998; Price, 2000) to be involved in motoric aspects of speech production, and also in speech processing of auditory stimuli (see topographies around 150–300 ms in Fig. 5-A). Wilson and colleagues speculated that the motor system is recruited in mapping acoustic inputs to a phonetic code (Wilson et al., 2004). In addition, superior temporal regions, especially BA41/42 and BA22, were activated not only by the auditory stimulus as well as speech processing (the first 500 ms in Fig. 5-A and Fig. 7-A), but also by the subject's verbal response (around 1000 ms in Fig. 4-A and around 1200 ms in Fig. 5-A). This is consistent with previous findings of superior temporal activity in self-monitoring of speech and the auditory perception and phonological processing (Binder et al., 2009, 2000; Price et al., 1996b; Démonet et al., 2005; Indefrey and Levelt, 2004). Interestingly, the temporal lobe response to the auditory stimulus was much stronger than that during the subject's perception of his/her own voice (Fig. 5-A). This, too, is consistent with previous studies (Price et al., 1996b; McGuire et al., 1996) that showed a difference of activated regions between listening to words and word reading. These studies explained this phenomenon by differences in attention, i.e., listening to words preparing for word repetition requires more attention to auditory percepts compared to during word repetition. Alternative explanations are possible differences in stimulation intensity or variability in response latency. Furthermore, BA44/45 showed robust activations during the verbal response (around 850 ms in Fig. 4-A and Fig. 9-A, and around 1000 ms in Fig. 5-A and Fig. 10). This is consistent with results from previous fMRI/PET studies (Fiez and Petersen, 1998; Price, 2000; Price et al., 1996a,b) and suggests an important role of Broca's area in processing different components of linguistic computation (Sahin et al., 2009) such as pre-articulatory syllabification (Indefrey and Levelt, 2004), semantic representation of words (Pulvermüller, 2005) and graphophonological conversion during reading aloud (Jobard et al., 2003).
4.3. Comparison to Other ECoG-Based Studies
The dynamic cortical activations shown in Fig. 4 to Fig. 7 accurately related the temporal envelope of the auditory stimuli and the subjects' responses, respectively. In particular, activations in regions surrounding the Sylvian fissure peaked around 150–200 ms and accurately tracked the brain's acoustic processing in response to the auditory stimuli that peaked around 100 ms (see Fig. 5-A, B). Then, following visual or auditory stimuli, activations began to increase around 700 ms and 800 ms, respectively, and peaked around 1000 ms and 1200 ms, respectively. These time courses of neural activations corresponded well to the temporal envelope of the subjects' response (see Fig. 4-A, B and Fig. 5-A, B). These findings are consistent with a previous report based on the classical ERD/ERS (Event-Related Desynchronization/Synchronization) method from one subject (Crone et al., 2001b), which described that gamma activity at one location in posterior STG significantly augmented around 100–200 ms and returned to baseline about 700–800 ms after onset of a word stimulus that was presented auditorily. The same study found that the augmentation of gamma activity at a different location over posterior STG peaked around 1000 ms for word reading and around 1250 ms for word repetition (Crone et al., 2001b). While this previous study and our study used different methods (ERD/ERS metric and r2 metric, respectively), the temporal evolution of cortical activations from these two studies are consistent with each other. Both ERD/ERS and r2 metrics quantify the amount of change of task-related cortical activation relative to rest, except that the r2 metric normalizes that difference by variance. (We compared our topographical results for ERD/ERS and r2 analyses, and found that they were qualitatively very similar.)
These temporal results can be compared to the macro-level time course analyses shown in Fig. 8, as the latter were derived from the same data as those in the topographical analyses. The time peaks of the averaged r2 in Fig. 8 are not exactly identical but very similar to those of activations in the regions surrounding the Sylvian fissure described above. This suggests that these regions are dominant during auditory stimulation and overt word production. We also find that in response to auditory stimulation (during the first 500 ms), the averaged r2 was much larger in amplitude compared to that for visual stimulation. Because there was no electrode coverage over visual areas, we did not expect pronounced responses to visual stimulation. In addition, auditory (speech) stimuli do result in strong brain responses over widely distributed cortical areas including temporal, frontal, and parietal lobes, and may thus also be easier to detect.
A different study (Canolty et al., 2007) reported that gamma activity tracked a sequence of word-specific processing starting in the post-STG at 120±13 ms, moving to the mid-STG later at 193±24 ms, before activating the STS at 268±30 ms, in which the acoustically matched non-words were used as a reference. Because our study used rest state as a reference, we were unable to track spatiotemporal dynamics related to word-specific processing. However, the HG activity in our study tracked multiple processing including acoustic and word-related processing. As shown in Fig. 5-A, the cortical activations began with BA22/41/42 (Primary Auditory Cortex, PAC) at 0 ms soon after receiving the auditory stimulus, and then increased in amplitude and spatial coverage towards posterior BA22 (post-STG) with a peak around 150 ms, and further towards BA21 (MTG) with a peak at 200 ms. This may reflect information flow from auditory cortex towards post-STG and BA21, which is consistent with a systematic flow of word processing that begins with acoustic processing in the auditory cortices and ends in posterior middle and inferior portions of temporal lobe (Canolty et al., 2007; Hickok and Poeppel, 2007). Furthermore, in Fig. 10, we found practically no differences of cortical activation during early sensory-related processing (i.e., the first 100 ms) between overt and covert conditions, but increasing differences over posterior superior temporal lobe thereafter. Thus, the temporal evolution of these differences may separate sensory processing from processes from preparing word production, and appears to be comparable to that shown in (Canolty et al., 2007).
4.4. Spatiotemporal Dynamics of Covert Word Representation
While previous imaging studies used silent reading (Price et al., 1996a,b; Rumsey et al., 1997; Huang et al., 2002; Borowsky et al., 2005), we are not aware of ECoG studies investigating the detailed spatiotemporal dynamics of covert word reading/repetition following different sensory inputs. Our three related observations are described below.
First, and as described above, during sensory processing of early stimulus presentation, cortical activations for covert modalities were similar to those of the corresponding overt modalities. For example, there was very little difference in cortical activations between overt and covert modalities between 0–250 ms (Fig. 9) and between 0–150 ms (Fig. 10).
Second, we found differences between overt and covert conditions between 200–500 ms over posterior STG (Wernicke's area) after acoustic processing (see Fig. 10), despite the fact that this area is implicated during both overt and covert tasks (see Fig. 5 and Fig. 7 during 200–500 ms). This suggests that Wernicke's area is involved in translating auditory speech input into overt speech output as well as into covert speech output, but that this level of involvement is different for overt speech compared to covert speech. Besides Wernicke's area, we also observe a similar effect for Broca's area and premotor cortex.
Third, for covert conditions during the second stage, we found only small activations over primary motor and premotor cortex, but pronounced activations over BA22 (mid-STG), BA41/42, and the temporoparietal junction (see topographies between 550–1200 ms in Fig. 6-A and between 700–1200 ms in Fig. 7-A). This suggests that these areas are involved in covert word production. It is also interesting to note that there is not much difference in activations between overt and covert speech production over superior temporal lobe between 550–800 ms in Fig. 9 and between 700–900 ms in Fig. 10. This could be explained by the notion that superior temporal lobe is involved in both overt and covert speech production. In any case, the results found here suggest an important role of the superior temporal lobe during covert speech production.
Figure 6.
Spatiotemporal dynamics of word processing for the Visual/Covert condition. A: Color-coded r2 values are superimposed across all subjects that participated in the imagery tasks (i.e., A, B, E, F, G, I). B: There was no auditory stimulus or verbal response in this condition. C: Outline of the approximate location of relevant Brodmann areas.
5. Future Work
In this work, we focused on ECoG gamma activity associated with word processing. Other brain signals, in particular amplitudes in mu and beta bands, are also involved in word processing, and will be described in a separate report. Furthermore, ongoing work is characterizing the activation time course of specific functional brain areas (e.g., primary motor cortex, Broca's area, primary auditory cortex) separately. Finally, ongoing studies are making use of subject-specific cortical models to more accurately attribute functional changes to anatomical location.
Supplementary Material
Figure 11.
Location of electrodes with a statistically significant (p-value ≤ 0.001) difference between overt and covert speech tasks at representative times (250 ms, 1000 ms, 1700 ms) during each of three stages, respectively. The different colors of the electrodes represent different subjects.
6. Acknowledgments
This work was supported by grants from the US Army Research Office (W911NF-07-1-0415 (GS), W911NF-08-1-0216 (GS)), the NIH/NIBIB (EB006356 (GS) and EB000856 (JRW and GS)), and the James S. McDonnell Center for Higher Brain Function (ECL).
Footnotes
Publisher's Disclaimer: This is a PDF file of an unedited manuscript that has been accepted for publication. As a service to our customers we are providing this early version of the manuscript. The manuscript will undergo copyediting, typesetting, and review of the resulting proof before it is published in its final citable form. Please note that during the production process errors may be discovered which could affect the content, and all legal disclaimers that apply to the journal pertain.
References
- Agosta F, Henry RG, Migliaccio R, Neuhaus J, Miller BL, Dronkers NF, Brambati SM, Filippi M, Ogar JM, Wilson SM, Gorno-Tempini ML. Language networks in semantic dementia. Brain. 2010 Jan;133:286–299. doi: 10.1093/brain/awp233. [DOI] [PMC free article] [PubMed] [Google Scholar]
- Aoki F, Fetz EE, Shupe L, Lettich E, Ojemann GA. Increased gamma-range activity in human sensorimotor cortex during performance of visuomotor tasks. Clin Neurophysiol. 1999 Mar;110(3):524–537. doi: 10.1016/s1388-2457(98)00064-9. [DOI] [PubMed] [Google Scholar]
- Aoki F, Fetz EE, Shupe L, Lettich E, Ojemann GA. Changes in power and coherence of brain activity in human sensorimotor cortex during performance of visuomotor tasks. Biosystems. 2001 Nov–Dec;63(1–3):89–99. doi: 10.1016/s0303-2647(01)00149-6. [DOI] [PubMed] [Google Scholar]
- Binder JR, Desai RH, Graves WW, Conant LL. Where is the semantic system? a critical review and meta-analysis of 120 functional neuroimaging studies. Cereb Cortex. 2009 Dec;19(12):2767–2796. doi: 10.1093/cercor/bhp055. [DOI] [PMC free article] [PubMed] [Google Scholar]
- Binder JR, Frost JA, Hammeke TA, Bellgowan PS, Springer JA, Kaufman JN, Possing ET. Human temporal lobe activation by speech and nonspeech sounds. Cereb Cortex. 2000 May;10(5):512–528. doi: 10.1093/cercor/10.5.512. [DOI] [PubMed] [Google Scholar]
- Borowsky R, Owen WJ, Wile TL, Friesen CK, Martin JL, Sarty GE. Neuroimaging of language processes: fMRI of silent and overt lexical processing and the promise of multiple process imaging in single brain studies. Can Assoc Radiol J. 2005 Oct;56(4):204–213. [PubMed] [Google Scholar]
- Brodmann K. Vergleichende Lokalisationslehre der Grosshirnrinde in ihren Prinzipien dargestellt auf Grund des Zellenbaues. Johann Ambrosius Barth Verlag. 1909 [Google Scholar]
- Brunner P, Ritaccio AL, Lynch TM, Emrich JF, Wilson JA, Williams JC, Aarnoutse EJ, Ramsey NF, Leuthardt EC, Bischof H, Schalk G. A practical procedure for real-time functional mapping of eloquent cortex using electrocorticographic signals in humans. Epilepsy Behav. 2009 Jul;15(3):278–286. doi: 10.1016/j.yebeh.2009.04.001. [DOI] [PMC free article] [PubMed] [Google Scholar]
- Canolty RT, Soltani M, Dalal SS, Edwards E, Dronkers NF, Nagarajan SS, Kirsch HE, Barbaro NM, Knight RT. Spatiotemporal dynamics of word processing in the human brain. Front Neurosci. 2007 Nov;1(1):185–196. doi: 10.3389/neuro.01.1.1.014.2007. [DOI] [PMC free article] [PubMed] [Google Scholar]
- Church JA, Coalson RS, Lugar HM, Petersen SE, Schlaggar BL. A developmental fmri study of reading and repetition reveals changes in phonological and visual mechanisms over age. Cereb Cortex. 2008 Sep;18(9):2054–2065. doi: 10.1093/cercor/bhm228. [DOI] [PMC free article] [PubMed] [Google Scholar]
- Crone NE, Boatman D, Gordon B, Hao L. Induced electrocorticographic gamma activity during auditory perception. brazier award-winning article, 2001. Clin Neurophysiol. 2001a Apr;112(4):565–582. doi: 10.1016/s1388-2457(00)00545-9. [DOI] [PubMed] [Google Scholar]
- Crone NE, Hao L, Hart J, Boatman D, Lesser RP, Irizarry R, Gordon B. Electrocorticographic gamma activity during word production in spoken and sign language. Neurology. 2001b Dec;57(11):2045–2053. doi: 10.1212/wnl.57.11.2045. [DOI] [PubMed] [Google Scholar]
- Crone NE, Miglioretti DL, Gordon B, Lesser RP. Functional mapping of human sensorimotor cortex with electrocorticographic spectral analysis. ii. event-related synchronization in the gamma band. Brain. 1998 Dec;121(Pt 12):2301–2315. doi: 10.1093/brain/121.12.2301. [DOI] [PubMed] [Google Scholar]
- Crone NE, Sinai A, Korzeniewska A. High-frequency gamma oscillations and human brain mapping with electrocorticography. Prog Brain Res. 2006;159:275–295. doi: 10.1016/S0079-6123(06)59019-3. [DOI] [PubMed] [Google Scholar]
- Démonet JF, Thierry G, Cardebat D. Renewal of the neurophysiology of language: functional neuroimaging. Physiol Rev. 2005 Jan;85(1):49–95. doi: 10.1152/physrev.00049.2003. [DOI] [PubMed] [Google Scholar]
- Dronkers NF. A new brain region for coordinating speech articulation. Nature. 1996 Nov;384(6605):159–161. doi: 10.1038/384159a0. [DOI] [PubMed] [Google Scholar]
- Dronkers NF, Wilkins DP, Van Valin RD, Redfern BB, Jaeger JJ. Lesion analysis of the brain areas involved in language comprehension. Cognition. 2004 May–Jun;92(1–2):145–177. doi: 10.1016/j.cognition.2003.11.002. [DOI] [PubMed] [Google Scholar]
- Duffau H, Capelle L, Denvil D, Gatignol P, Sichez N, Lopes M, Sichez JP, Van Effenterre R. The role of dominant premotor cortex in language: a study using intraoperative functional mapping in awake patients. Neuroimage. 2003 Dec;20(4):1903–1914. doi: 10.1016/s1053-8119(03)00203-9. [DOI] [PubMed] [Google Scholar]
- Edwards E, Soltani M, Deouell LY, Berger MS, Knight RT. High gamma activity in response to deviant auditory stimuli recorded directly from human cortex. J Neurophysiol. 2005 Dec;94(6):4269–4280. doi: 10.1152/jn.00324.2005. [DOI] [PubMed] [Google Scholar]
- Edwards E, Soltani M, Kim W, Dalal SS, Nagarajan SS, Berger MS, Knight RT. Comparison of time-frequency responses and the event-related potential to auditory speech stimuli in human cortex. J Neurophysiol. 2009 Jul;102(1):377–386. doi: 10.1152/jn.90954.2008. [DOI] [PMC free article] [PubMed] [Google Scholar]
- Fiez JA, Petersen SE. Neuroimaging studies of word reading. Proc Natl Acad Sci U S A. 1998 Feb;95(3):914–921. doi: 10.1073/pnas.95.3.914. [DOI] [PMC free article] [PubMed] [Google Scholar]
- Fox PT, Perlmutter JS, Raichle ME. A stereotactic method of anatomical localization for positron emission tomography. J Comput Assist Tomogr. 1985 Jan–Feb;9(1):141–153. doi: 10.1097/00004728-198501000-00025. [DOI] [PubMed] [Google Scholar]
- Fried I, Ojemann GA, Fetz EE. Language-related potentials specific to human language cortex. Science. 1981 Apr;212(4492):353–356. doi: 10.1126/science.7209537. [DOI] [PubMed] [Google Scholar]
- Haenschel C, Baldeweg T, Croft RJ, Whittington M, Gruzelier J. Gamma and beta frequency oscillations in response to novel auditory stimuli: A comparison of human electroencephalogram (EEG) data with in vitro models. Proc Natl Acad Sci U S A. 2000 Jun;97(13):7645–7650. doi: 10.1073/pnas.120162397. [DOI] [PMC free article] [PubMed] [Google Scholar]
- Hickok G, Poeppel D. The cortical organization of speech processing. Nat Rev Neurosci. 2007 May;8(5):393–402. doi: 10.1038/nrn2113. [DOI] [PubMed] [Google Scholar]
- Huang J, Carr TH, Cao Y. Comparing cortical activations for silent and overt speech using event-related fMRI. Hum Brain Mapp. 2002 Jan;15(1):39–53. doi: 10.1002/hbm.1060. [DOI] [PMC free article] [PubMed] [Google Scholar]
- Indefrey P, Levelt WJ. The spatial and temporal signatures of word production components. Cognition. 2004 May–Jun;92(1–2):101–144. doi: 10.1016/j.cognition.2002.06.001. [DOI] [PubMed] [Google Scholar]
- Jobard G, Crivello F, Tzourio-Mazoyer N. Evaluation of the dual route theory of reading: a metanalysis of 35 neuroimaging studies. Neuroimage. 2003 Oct;20(2):693–712. doi: 10.1016/S1053-8119(03)00343-4. [DOI] [PubMed] [Google Scholar]
- Kubánek J, Miller KJ, Ojemann JG, Wolpaw JR, Schalk G. Decoding flexion of individual fingers using electrocorticographic signals in humans. J Neural Eng. 2009 Oct;6(6):66001–66001. doi: 10.1088/1741-2560/6/6/066001. [DOI] [PMC free article] [PubMed] [Google Scholar]
- Lachaux JP, Fonlupt P, Kahane P, Minotti L, Hoffmann D, Bertrand O, Baciu M. Relationship between task-related gamma oscillations and bold signal: new insights from combined fMRI and intracranial EEG. Hum Brain Mapp. 2007 Dec;28(12):1368–1375. doi: 10.1002/hbm.20352. [DOI] [PMC free article] [PubMed] [Google Scholar]
- Lancaster J, Rainey L, Summerlin J, Freitas C, Fox P, Evans A, Toga A, Mazziotta J. Automated labeling of the human brain: a preliminary report on the development and evaluation of a forward-transform method. Human Brain Mapping. 1997;5(4):238–242. doi: 10.1002/(SICI)1097-0193(1997)5:4<238::AID-HBM6>3.0.CO;2-4. [DOI] [PMC free article] [PubMed] [Google Scholar]
- Lancaster J, Woldorff M, Parsons L, Liotti M, Freitas C, Rainey L, Kochunov P, Nickerson D, Mikiten S, Fox P. Automated Talairach atlas labels for functional brain mapping. Human Brain Mapping. 2000;10(3):120–131. doi: 10.1002/1097-0193(200007)10:3<120::AID-HBM30>3.0.CO;2-8. [DOI] [PMC free article] [PubMed] [Google Scholar]
- Leuthardt EC, Miller K, Anderson NR, Schalk G, Dowling J, Miller J, Moran DW, Ojemann JG. Electrocorticographic frequency alteration mapping: a clinical technique for mapping the motor cortex. Neurosurgery. 2007 Apr;60(4 Suppl 2):260–270. doi: 10.1227/01.NEU.0000255413.70807.6E. [DOI] [PubMed] [Google Scholar]
- Marple SL. Digital spectral analysis: with applications. Prentice-Hall; Englewood Cliffs: 1987. [Google Scholar]
- McGuire PK, Silbersweig DA, Frith CD. Functional neuroanatomy of verbal self-monitoring. Brain. 1996 Jun;119:907–917. doi: 10.1093/brain/119.3.907. [DOI] [PubMed] [Google Scholar]
- Miller KJ, Leuthardt EC, Schalk G, Rao RP, Anderson NR, Moran DW, Miller JW, Ojemann JG. Spectral changes in cortical surface potentials during motor movement. J Neurosci. 2007a Feb;27(9):2424–2432. doi: 10.1523/JNEUROSCI.3886-06.2007. [DOI] [PMC free article] [PubMed] [Google Scholar]
- Miller KJ, Makeig S, Hebb AO, Rao RP, Dennijs M, Ojemann JG. Cortical electrode localization from x-rays and simple mapping for electrocorticographic research: the “Location on Cortex” (LOC) package for MATLAB. Journal of Neuroscience methods. 2007b;162(1–2):303–308. doi: 10.1016/j.jneumeth.2007.01.019. [DOI] [PubMed] [Google Scholar]
- Miller KJ, Sorensen LB, Ojemann JG, den Nijs M. Power-law scaling in the brain surface electric potential. PLoS Comput Biol. 2009 Dec;5(12) doi: 10.1371/journal.pcbi.1000609. [DOI] [PMC free article] [PubMed] [Google Scholar]
- Niessing J, Ebisch B, Schmidt KE, Niessing M, Singer W, Galuske RA. Hemodynamic signals correlate tightly with synchronized gamma oscillations. Science. 2005 Aug;309(5736):948–951. doi: 10.1126/science.1110948. [DOI] [PubMed] [Google Scholar]
- Petersen SE, Fiez JA. The processing of single words studied with positron emission tomography. Annu Rev Neurosci. 1993;16:509–530. doi: 10.1146/annurev.ne.16.030193.002453. [DOI] [PubMed] [Google Scholar]
- Price CJ. The anatomy of language: contributions from functional neuroimaging. J Anat. 2000 Oct;197:335–359. doi: 10.1046/j.1469-7580.2000.19730335.x. [DOI] [PMC free article] [PubMed] [Google Scholar]
- Price CJ, Moore CJ, Frackowiak RS. The effect of varying stimulus rate and duration on brain activity during reading. Neuroimage. 1996a Feb;3(1):40–52. doi: 10.1006/nimg.1996.0005. [DOI] [PubMed] [Google Scholar]
- Price CJ, Wise RJ, Warburton EA, Moore CJ, Howard D, Patterson K, Frackowiak RS, Friston KJ. Hearing and saying. the functional neuro-anatomy of auditory word processing. Brain. 1996b Jun;119:919–931. doi: 10.1093/brain/119.3.919. [DOI] [PubMed] [Google Scholar]
- Pulvermüller F. Brain mechanisms linking language and action. Nat Rev Neurosci. 2005 Jul;6(7):576–582. doi: 10.1038/nrn1706. [DOI] [PubMed] [Google Scholar]
- Ray S, Crone NE, Niebur E, Franaszczuk PJ, Hsiao SS. Neural correlates of high-gamma oscillations (60–200 hz) in macaque local field potentials and their potential implications in electrocorticography. J Neurosci. 2008a Nov;28(45):11526–11536. doi: 10.1523/JNEUROSCI.2848-08.2008. [DOI] [PMC free article] [PubMed] [Google Scholar]
- Ray S, Hsiao SS, Crone NE, Franaszczuk PJ, Niebur E. Effect of stimulus intensity on the spike-local field potential relationship in the secondary somatosensory cortex. J Neurosci. 2008b Jul;28(29):7334–7343. doi: 10.1523/JNEUROSCI.1588-08.2008. [DOI] [PMC free article] [PubMed] [Google Scholar]
- Rosen HJ, Allison SC, Ogar JM, Amici S, Rose K, Dronkers N, Miller BL, Gorno-Tempini ML. Behavioral features in semantic dementia vs other forms of progressive aphasias. Neurology. 2006 Nov;67(10):1752–1756. doi: 10.1212/01.wnl.0000247630.29222.34. [DOI] [PubMed] [Google Scholar]
- Rumsey JM, Horwitz B, Donohue BC, Nace K, Maisog JM, Andreason P. Phonological and orthographic components of word recognition. a PET-rCBF study. Brain. 1997 May;120:739–759. doi: 10.1093/brain/120.5.739. [DOI] [PubMed] [Google Scholar]
- Sahin NT, Pinker S, Cash SS, Schomer D, Halgren E. Sequential processing of lexical, grammatical, and phonological information within Broca's area. Science. 2009 Oct;326(5951):445–449. doi: 10.1126/science.1174481. [DOI] [PMC free article] [PubMed] [Google Scholar]
- Schalk G, Kubánek J, Miller KJ, Anderson NR, Leuthardt EC, Ojemann JG, Limbrick D, Moran D, Gerhardt LA, Wolpaw JR. Decoding two-dimensional movement trajectories using electrocorticographic signals in humans. J Neural Eng. 2007 Sep;4(3):264–275. doi: 10.1088/1741-2560/4/3/012. [DOI] [PubMed] [Google Scholar]
- Schalk G, McFarland D, Hinterberger T, Birbaumer N, Wolpaw J. BCI2000: a general-purpose brain-computer interface (BCI) system. IEEE Trans Bio-Med Eng. 2004;51(6):1034–1043. doi: 10.1109/TBME.2004.827072. [DOI] [PubMed] [Google Scholar]
- Sinai A, Bowers CW, Crainiceanu CM, Boatman D, Gordon B, Lesser RP, Lenz FA, Crone NE. Electrocorticographic high gamma activity versus electrical cortical stimulation mapping of naming. Brain. 2005 Jul;128(Pt 7):1556–1570. doi: 10.1093/brain/awh491. [DOI] [PubMed] [Google Scholar]
- Talairach J, Tournoux P. Co-Planar Sterotaxic Atlas of the Human Brain. Thieme Medical Publishers, Inc.; New York: 1988. [Google Scholar]
- Towle VL, Yoon HA, Castelle M, Edgar JC, Biassou NM, Frim DM, Spire JP, Kohrman MH. ECoG gamma activity during a language task: differentiating expressive and receptive speech areas. Brain. 2008 Aug;131(Pt 8):2013–2027. doi: 10.1093/brain/awn147. [DOI] [PMC free article] [PubMed] [Google Scholar]
- Watkins KE, Dronkers NF, Vargha-Khadem F. Behavioural analysis of an inherited speech and language disorder: comparison with acquired aphasia. Brain. 2002 Mar;125(Pt 3):452–464. doi: 10.1093/brain/awf058. [DOI] [PubMed] [Google Scholar]
- Wilson SM, Saygin AP, Sereno MI, Iacoboni M. Listening to speech activates motor areas involved in speech production. Nat Neurosci. 2004 Jul;7(7):701–702. doi: 10.1038/nn1263. [DOI] [PubMed] [Google Scholar]
- Wonnacott TH, Wonnacott R. Introductory Statistics. 3rd Edition John Wiley and Sons; New York: 1977. [Google Scholar]
Associated Data
This section collects any data citations, data availability statements, or supplementary materials included in this article.


