Abstract
This work addresses the choice of imaging flip angle in blood oxygenation level dependent (BOLD) functional magnetic resonance imaging (fMRI). When noise of physiological origin becomes the dominant noise source in fMRI timeseries, it causes a nonlinear dependence of the temporal signal-to-noise ratio (TSNR) versus signal-to-noise ratio (SNR) that can be exploited to perform BOLD fMRI at angles well below the Ernst angle without any detrimental effect on our ability to detect sites of neuronal activation. We show, both experimentally and theoretically, that for situations where available SNR is high and physiological noise dominates over system/thermal noise, although TSNR still reaches it maximum for the Ernst angle, reduction of imaging flip angle well below this angle results in negligible loss in TSNR. Moreover, we provide a way to compute a suggested imaging flip angle, which constitutes a conservative estimate of the minimum flip angle that can be used under given experimental SNR and physiological noise levels. For our experimental conditions, this suggested angle equals 7.63° for the grey matter compartment, while the Ernst angle = 77°. Finally, using data from eight subjects with a combined visual-motor task we show that imaging at angles as low as 9° introduces no significant differences in observed hemodynamic response time-course, contrast-to-noise ratio, voxel-wise effect size or statistical maps of activation as compared to imaging at 75° (an angle close to the Ernst angle). These results suggest that using low flip angles in BOLD fMRI experimentation to obtain benefits such as (1) reduction of RF power, (2) limitation of apparent T1-related inflow effects, (3) reduction of through-plane motion artifacts, (4) lower levels of physiological noise, and (5) improved tissue contrast is feasible when physiological noise dominates and SNR is high.
Keywords: Physiological noise, Imaging flip angle, Temporal signal-to-noise ratio, TSNR, fMRI
Introduction
A common practice in gradient recalled-echo (GRE) functional magnetic resonance imaging (fMRI) is to select the imaging flip angle to be equal to the Ernst angle (Ernst and Anderson, 1996) for grey matter. The premise is to select the Ernst angle to maximize the grey matter signal-to-noise ratio (SNR). Although this approach has proven beneficial for spoiled gradient echo anatomically oriented applications of MRI, in which physiological noise does not dominate or even contribute significantly (i.e. SNR < 50 or in non living samples), the same might not be necessarily true for fMRI, in which non-thermal noise dominates (Kruger and Glover, 2001; Triantafyllou et al., 2005).
FMRI detects neuronal activity-induced subtle temporal MRI signal fluctuations that have their origin in the BOLD (Blood Oxygenation Level Dependent) phenomenon (Ogawa et al., 1993). These time series contain noise. Specifically, physiological noise is present and represents a confounding factor in BOLD fMRI data (Kruger and Glover, 2001). Depending on the imaging voxel volume and available SNR, physiological noise frequently becomes the dominant noise source present in fMRI time courses (Bodurka et al 2007). The quality of functional MRI data can be characterized in terms of temporal-SNR (TSNR). This metric is defined and computed on a voxel-wise basis as the ratio of the mean steady-state signal of the fMRI time-series to the voxel temporal standard deviation (Parrish et al., 2000). While SNR is independent of physiological noise contributions (i.e., in EPI, an image is collected within 40 ms – faster than most physiologic process – thus minimizing effects of temporal variations of these), TSNR shows a non-linear dependence on physiological noise contribution. Based on this non-linear dependence of TSNR with physiological noise and the fact that physiological noise is MR-signal strength dependent (Kruger and Glover, 2001; Triantafyllou et al., 2005), we hypothesize that the behavior of SNR and TSNR as a function of imaging flip angle might differ; and that such differences might be exploited to perform fMRI experiments at imaging angles well below the Ernst angle.
This work studies, both theoretically and experimentally, the TSNR dependence on the flip angle. We provide evidence that, in the presence of physiologic noise, the TSNR does not follow the relationship defined by the Ernst equation. In fact, we show that the relationship between TSNR and flip angle is relatively constant across a wide range of flip angles. We subsequently evaluate if the use of flip angles other than the Ernst angle has any detrimental effect on our ability to detect BOLD-related neuronal activity. For that purpose we conducted a block-design experiment with a combined visual-motor task. Using this data, we examined flip angle effects on the time-course of the hemodynamic response associated with task epoch, on contrast-to-noise ratio (CNR), and on statistical maps of activation. Our results suggest that, as could be expected on the basis of TSNR behavior, under specific experimental conditions the use of angles larger or smaller than the Ernst angle does not reduce our ability to detect BOLD-based neuronal activity. In this respect, we also provide formulation of the suggested flip angle (θS), which provides a conservative estimate of the minimum flip angle that can be used under given experimental SNR and physiological noise levels.
The possibility of performing fMRI at low flip angles without great loss in TSNR, as our results suggest, comes accompanied by a series of additional benefits such as: (1) reduction of RF power, (2) limitation of apparent T1-related inflow effects—e.g., increasing BOLD specificity—, (3) reduction of through-plane motion artifacts, (4) lower levels of physiological noise—as a result of the linear dependence between physiological noise and signal level—and (5) improved tissue contrast. Two of these benefits, lower physiological noise and lower RF induced heating are of special importance in imaging at ultra-high fields.
Theory
Signal-to-Noise Ratio (SNR)
| (Eq. 1) |
SNR for magnetic resonance images (Eq. 1) is defined as the ratio of the signal (S) from a small volume of material in the body to the thermal noise present in the measuring system (σo) (Edelstein et al., 1986). In the case of gradient recalled-echo, in which a series of consecutive imaging volumes are acquired with repetition times (TR) in the same order of magnitude as the longitudinal relaxation time (T1) of the sample under study, the numerator in Eq. 1 no longer refers to the signal generated after a single excitation, but to the steady state signal that develops after several seconds. The mathematical formulation of this steady state signal (SSSIS) is provided in equation 2 (Zur et al., 1991)
| (Eq. 2) |
where θ=flip angle, TE=echo time, T2*=transverse relaxation time, and Mo=longitudinal magnetization. If we now define SNRo as the signal-to-noise ratio for the first image of the fMRI time-series for θ=90° (Eq. 3), we can obtain a simplified version (Eq. 4) of SNR as a function of flip angle (θ) for gradient echo fMRI that depends solely on parameters easily obtained experimentally.
| (Eq. 3) |
| (Eq. 4) |
Temporal Signal-to-Noise Ratio
In fMRI, temporal signal to noise ratio (and typically not signal to noise ratio) is the determinant of sensitivity. Temporal signal to noise ratio (TSNR), which is many times used in fMRI to evaluate data quality (Bellgowan et al., 2006; Bodurka et al., 2007; Kruger and Glover, 2001; Murphy et al., 2007; Parrish et al., 2000; Triantafyllou et al., 2005), is commonly defined as
| (Eq. 5) |
where SSSIS is the mean voxel time course signal, and σfmri is the voxel time course standard deviation. It has been already demonstrated (Bodurka et al., 2007; Kruger and Glover, 2001; Kruger et al., 2001) that the noise variance in an imaging voxel (σfmri) is the sum of thermal noise (σo) and physiological noise (σp). The thermal noise in MR (σo) arises from the subject and scanner electronics, and depends on B0, but is independent of MR-signal strength (Kruger and Glover, 2001; Edelstein et al., 1986). The physiological noise (σp) is directly proportional to MR-signal strength (σp=λ·SSSIS), and creates the following non-linear relationship between SNR and TSNR:
| (Eq. 6) |
If we combine Eq. 4 and Eq. 6 we obtain the following expression of TSNR as a function of flip angle
| (Eq. 7) |
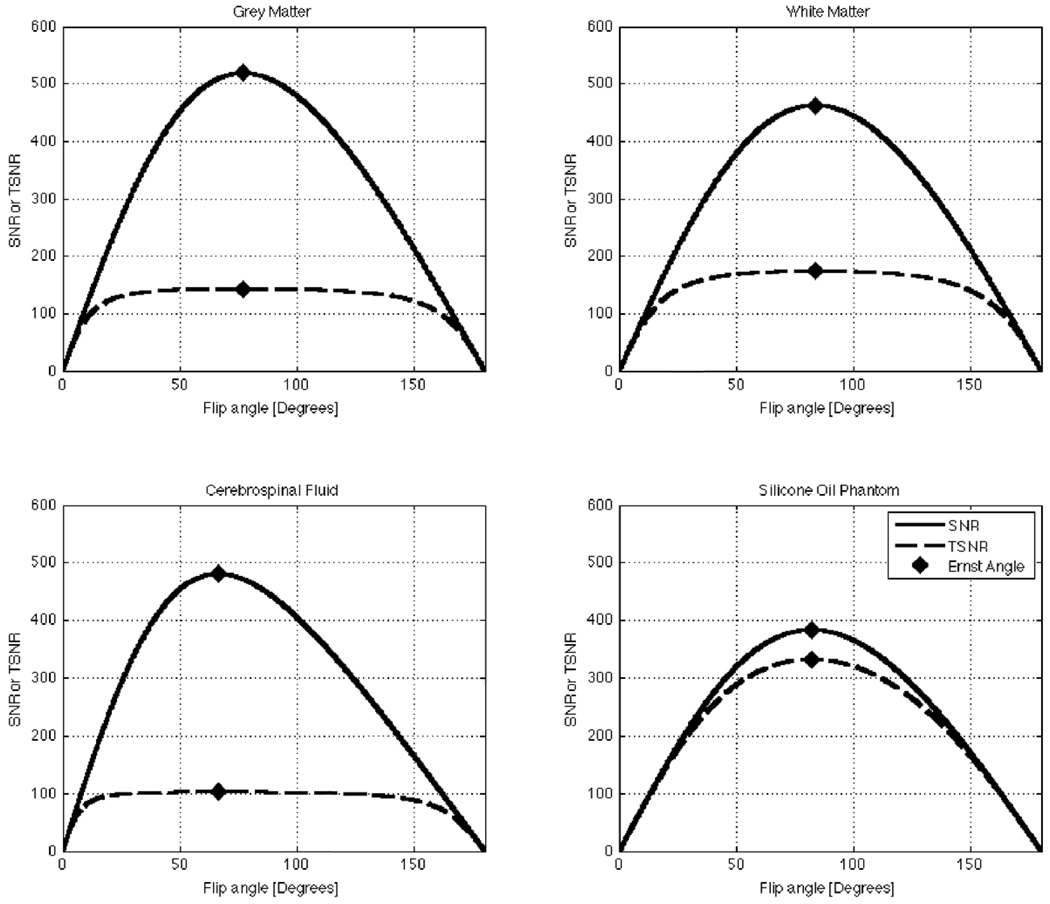
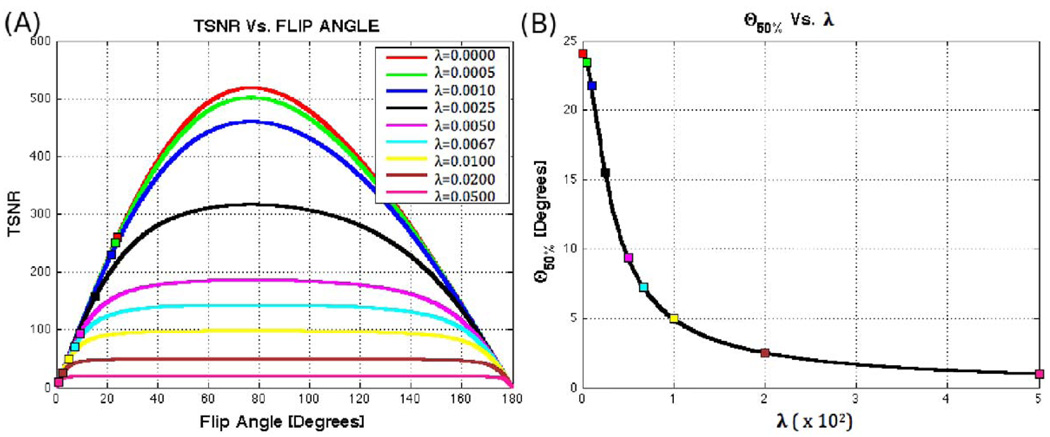
Figure 1 shows plots of Eq. 4 and Eq. 7 for three human tissue compartments —namely grey matter (GM), white matter (WM), and cerebrospinal fluid (CSF)—as well as for a Silicone Oil phantom. The values of T1, λ, and SNRo (Table 1) used in these simulations correspond to values previously reported in the literature for 3T scanners (Bodurka and Bandettini, 2009; Wang et al., 2006). Repetition time (TR) is set to 2.0 s, a commonly used value in fMRI experimentation. In the figure, it can be observed that both SNR and TSNR reach their respective maximum values at the Ernst angle (Ernst and Anderson, 1996). The figure also shows how SNR strongly varies as a function of flip angle in all cases under consideration. Conversely, TSNR presents two different behaviors depending on the amount of physiological noise present in the measured system. For a Silicone Oil phantom, which presents a minor contribution of signal-dependent or physiological-like noise (λ=0.0015), TSNR behaves in a similar manner to SNR. Conversely, for GM (λ=0.0067), WM (λ=0.0053) and, especially for CSF (λ=0.0095), the TSNR curves suffer little modulation by the flip angle for a wide range of angles above and below the Ernst angle. To further investigate the effect of λ on the shape of the TSNR curve, we generated additional plots of TSNR vs. Flip Angle for different levels of physiological noise (ranging from λ=0 to λ=0.05) while keeping T1 and SNRo equal to the values reported in Table 1 for GM. Figure 2.A shows these additional plots. It can be observed that as λ increases, the TSNR curve becomes flatter and conserves a value close to its maximum for a wider range of angles. Moreover, if we look at the angle below the Ernst angle for which TSNR has decreased to half its maximum value (θ50%)—marked as squares in Figure 2.A—we can see that as λ increases this angle becomes smaller. Figure 2.B shows how this angle, θ50%, decreases very rapidly and reaches a value of 7.22° for λ=0.0067 (physiological noise level previously reported for GM (Bodurka and Bandettini, 2009)).
FIGURE 1.
Plots of the predicted behavior of SNR and TSNR as a function of flip angle for four different tissue compartments/objects. (A) Plots for Grey Matter. (B) Plots of White Matter. (C) Plots for Cerebrospinal Fluid. (D) Plots for the Silicone Oil Phantom (the unexpected residual physiological noise present in the phantom may arise from transfer of vibrations from the bed to the fluid inside the phantom (Kruger and Glover, 2001))
Table 1.
Reference values used to create simulations of SNR and of flip angle.
FIGURE 2.
(A) TSNR vs. Flip angle for T1=T1,GM=1.34s, SNRo=SNRo,GM=652 and different values of λ ranging from 0 to 0.05. For each curve, a square marks the angle below the Ernst angle for which TSNR has decreased to 50% from its maximum value (θ50%). (B) Evolution of θ50% with λ. The higher the amount of physiological noise present, the flatter the TSNR curve and consequently the lower the angle for which TSNR reaches 50% of its maximum value.
These results, coupled with the fact that TSNR is the primary measure of the ability to detect BOLD signal changes (Bellgowan et al., 2006; Parrish et al., 2000), suggests that detection of BOLD fMRI changes might not be detrimentally affected by the use of flip angles other than the Ernst angle. In the experiments described below we explore this possibility in detail.
Suggested fMRI Flip Angle
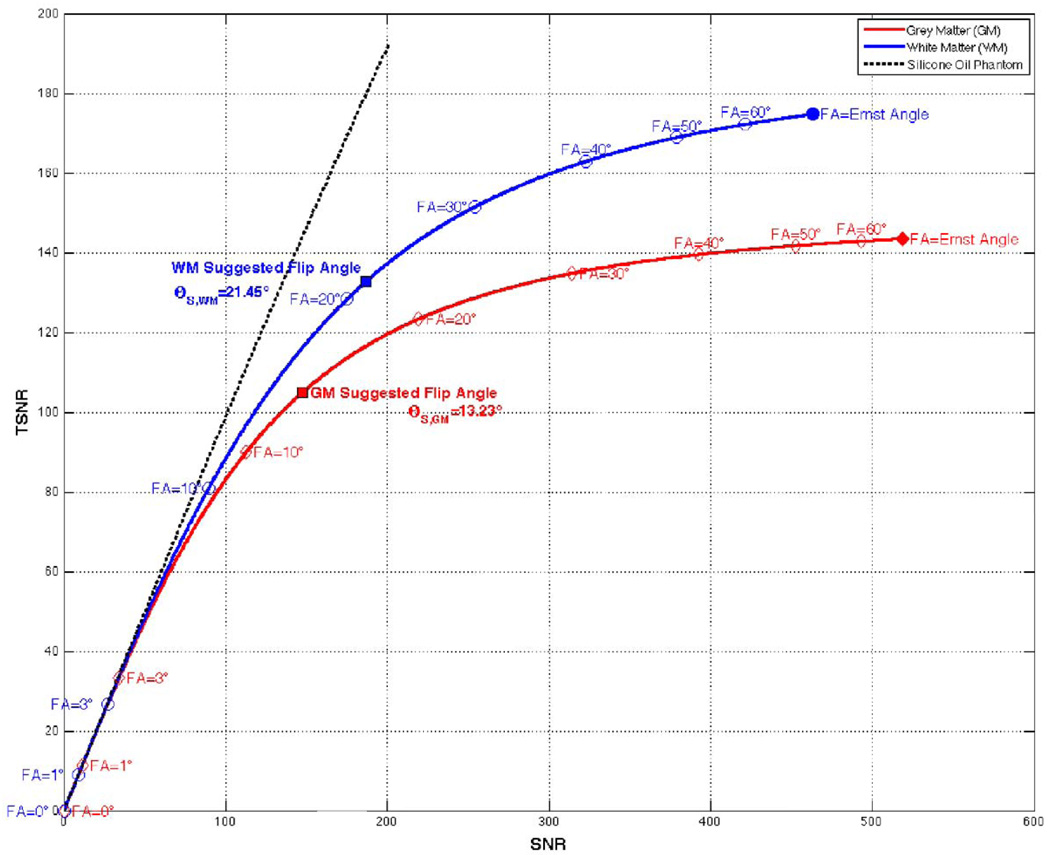
Figure 3 shows simulations of SNR vs. TSNR for GM, WM and the Silicone Oil Phantom using T1, λ and SNRo values reported in Table 1 and TR=2 s. For the Silicone Oil Phantom, where physiological noise never becomes a dominant noise source (e.g., λ~0 and σp/σo≪1 independently of signal level), SNR and TSNR show a linear relationship at all SNR levels (dotted black line). On the other hand, for tissue compartments where physiological noise becomes a dominant noise source at high SNR levels (e.g. GM and WM), two different imaging regimes can be observed in the figure. In the low SNR regime, e.g., flip angles in the vicinity of 0°, SNR and TSNR are equal and small changes in flip angle translate in large changes in both SNR and TSNR. Conversely, in the high SNR regime, e.g., larger flip angles, changes in flip angle come accompanied by large changes in SNR, but moderate or low changes in TSNR. In fact, as we approach the Ernst angle, large changes in SNR come accompanied by negligible changes in TSNR (e.g. from FA=50° to 60° SNR in GM increases 8.2% while TSNR increases only 0.8%).
FIGURE 3.
Simulations of the suggested fMRI flip angle (θS). The black dotted line show a linear behavior for the Silicone Oil Phantom. The red and blue continuous lines show behavior for grey and white matter respectively. Ernst angle for these two tissue compartments is marked with filled dots, while other exemplary angles are masked as transparent dots. The suggested flip angle for both tissue compartments are also marked in each curve as filled squares with black outline.
For tissue compartments that show this dual imaging regime we can attempt to predict the minimum flip angle that can be used under a given set of experimental conditions (e.g., SNRo and λ) that will lead to a limited decline in TSNR and no detrimental effect in our ability to detect BOLD activations. Using an approach similar to the one previously proposed by Bodurka et al. (2007) to define the suggested fMRI voxel volume (SVV) we can now define the suggested imaging flip angle (θS) as the imaging flip angle for which physiological noise is equal to the non-physiological noise (σp=σo). We choose to define the “suggested” condition this way because, when σp=σo, contributions from physiological and system noise are equivalent. In other words, no noise source dominates, and as we shall demonstrate below, this situation approximately corresponds with the inflexion point shown for the SNR vs. TSNR curve in Figure 3. Under this “suggested” conditions, SNR takes the following form:
| (Eq. 8) |
| (Eq. 9) |
Using Eq. 8 and Eq. 9, for tissue compartments and experimental conditions were TR≫T1 (e.g., e−TR/T1≪1), the suggested flip can be calculated as a function of SNRo and λ as follows:
| (Eq. 10) |
This suggested flip angle (θS) corresponds to the transition point where physiological noise no longer is a dominant source and therefore provides a conservative estimate of the transition point where TSNR decline starts to be more pronounced as flip angle goes down. In our simulation the suggested flip angle for WM equals 21.45° (blue square in Figure 3) and for GM it equals 13.23° (red square in Figure 3). It can be observed in the figure that at these angles we are entering the low SNR regime and for angles below the suggested angle the slope of the curve starts to increase abruptly. Still, it is worth mentioning that at this suggested flip angle we have only compromised a small portion of TSNR (as compared to the maximum) and it is expected that even for angles below the suggested flip angle we may still have a minimal loss in our ability to detect BOLD activations.
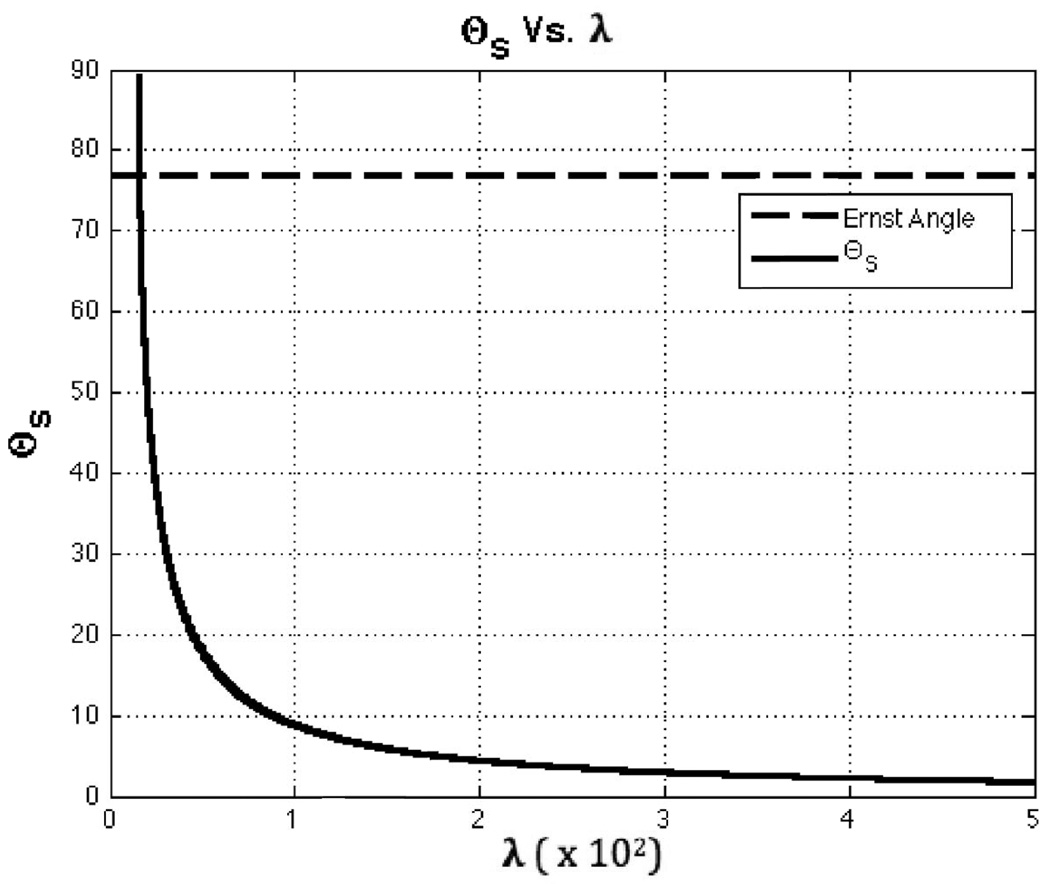
As for the dependence of suggested flip angle on levels of physiological noise, Figure 4 shows a plot of how θS varies with λ while keeping SNRo =SNRo,GM=652. In the Figure, it can be observed that θS decreases as λ increases. This behavior is a result of the flattening effect that physiological noise introduces in the TSNR vs. flip angle curve when it represents the dominant source of noise. The figure also shows that for very low levels of physiological noise, well below those previously reported for WM, GM and CSF (see Table 1), Eq. 10 provides angle values above the Ernst angle that rapidly increase toward 90°. This behavior of Eq. 10 for negligible levels of physiological noise is the result of trying to apply Eq. 10 in a situation where physiological noise never becomes the dominant source of noise and the TSNR curve does not flattens. As Figure 3 shows (see black dotted line for the Silicone Oil Phantom), when physiological noise is never dominant, the second imaging regime in which SNR and TSNR curves differ, cannot be achieved; and the appropriate way to compute the imaging flip angle is to use the equation for the Ernst angle. In other words, θS, as calculated with Eq. 10, must be used only when physiological noise is the dominant noise source and the TSNR vs. flip angle curve flattens.
FIGURE 4.
Suggested flip angle (θS) as a function of λ. The dotted line shows the Ernst angle for TR=2 and T1=T1,GM=1.34s. The continuous black line shows a plot of Eq. 10, the estimated θS, as a function of λ while keeping SNRo=SNRo,GM=652.
Methods
Subjects
Eight subjects with no known history of neurological disorder (4 males, 4 females, mean ± SD age = 26 ± 2 years) completed this study. All participants were right handed. All participants gave informed consent in compliance with a protocol approved by the Institutional Review Board (IRB).
Tasks
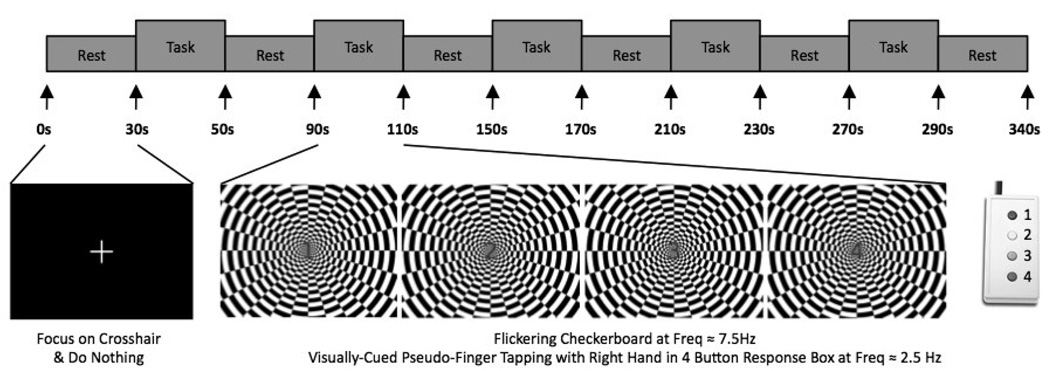
All functional runs had the same organization of blocks (Figure 5). An initial 30-s rest period was followed by 5 repetitions of the following sequence of blocks: task block (20 s); and rest block (40 s). An additional 10 seconds of rest were added at the end of each functional run. This resulted in 340 seconds runs. During the rest periods, subjects were instructed to remain still and focus their attention on a white fixation cross over a black background. During the task epochs subjects were instructed to focus their attention in the center of a flickering checkerboard (frequency = 7.5 Hz) and use their right hand to press each of the four buttons of a response box (CURDES Fiber Optic Response Box Model No: HH-2x4-C) in an order and frequency dictated by a numeric visual cue located at the center of the flashing checkerboard. The numeric cue consisted of a number from one to four: (1) use the index finger to push left most button, (2) use the middle finger to push second left most button, (3) use the ring finger to push second right most button and (4) use the little to press right most button. Numbers always appeared in the same sequence, i.e., 1-2-3-4-1-2-3-4 on so on, leading to a sequential button pressing similar to a finger-tapping task of frequency equal to 2.5 Hz. A button press task, instead of the more commonly used finger-tapping task, was selected to allow recording of some behavioral measure of subject compliance and consistency across runs.
FIGURE 5.
Timing of fMRI functional runs. Each functional run consisted of 30 seconds of rest at the beginning and 10 seconds of rest at the end of the run. In between, there were five task blocks (20 secs) followed by periods of rest (40 secs). During the task periods subjects had to observe the center of a flickering checkerboard and perform a finger-tapping movement at the frequency mandated by a series of numbers that appeared in the center of the image. During rest periods, subjects were instructed to stay still and focus their attention on a cross-hair in the center of the screen.
Data Acquisition
Imaging was performed on a General Electric (GE) 3 Tesla Signa HDx MRI scanner (Waukesha, WI). For RF transmission, the scanner’s standard body coil was used. For MRI signal reception, a custom 16-element receive-only surface coil brain-array (Nova Medical, Inc Wilmington, MA) was used (de Zwart et al., 2004). Images from this coil were obtained by computing the square root of the sum of the square of magnitude image data from each coil element. Functional runs were obtained using a multi-slice gradient recalled, single shot, full k-space echo planar imaging (geEPI) sequence (TR=2.0 s, TE=30 ms, 32 axial slices, slice thickness=4 mm, spacing=0 mm, in-plane resolution=64×64, FOV=24 cm). For all subjects, the first functional run was collected at θ=77° (Ernst angle for gray matter at 3T, T1GM=1.34 s). This run was considered a training run. As such, the purpose of this run was to familiarize subjects with the dynamics of the task. Data from this run was not included in any subsequent analysis. After this training run, functional runs at flip angles of 15°, 30°, 45°, 60°, 75°, 90° and 105° were collected for all subjects. Additionally, functional runs for θ=9° and θ=120° were collected in 7 subjects. T1-weigthed Magnetization-Prepared Rapid Gradient Echo (MPRAGE) sequence were acquired for presentation and alignment purposes (axial prescription, number of slices per slab=128, slice thickness=1.2 mm, square FOV=24 cm, image matrix = 224×224). Finally, a 210 second geEPI run with effective flip angle of zero (the MR scanner’s RF amplifier disabled) and all other parameters matching those of the functional runs was collected to compute the standard deviation associated with thermal noise (σo).
In order to minimize habituation effects and reduce subject discomfort, the following measures were implemented: (1) flip angle acquisition were randomized across subjects, and (2) anatomical and thermal noise measurement scans were interleaved through the scan session to provide subjects with periods of rest every three or four runs.
Data Pre-processing/Region of Interest (ROI) Definition
Common pre-processing steps to all different analyses described below include: (1) intra-run motion correction; (2) spatial registration to the first volume of the θ=90° functional run using a 6 parameters transformation (3 rotational + 3 displacement parameters); and (3) discard initial 5 volumes to allow for magnetization to reach steady state. In order to fully assess the physiological noise contributions to the imaging data no physiological noise correction schemes were applied as part of the preprocessing pipeline.
Two sets of ROIs were generated for averaging purposes. The first set includes binary masks for three tissue compartments of interest: GM, WM and CSF. Masks were generated using the method previously described by Bodurka et al. (2007) using the functional runs at θ=90°. T1 ranges used to define GM and WM compartments correspond to the mean values ± 2SD of the T1 values previously reported by Wansapura et al. (1999) for a 3T system (GM:[1.22 s, 1.44 s], WM:[0.74 s, 0.92 s]). For CSF segmentation we considered voxels with T1 > 2.18 s (Wang et al., 2006).
The second ROI set includes binary masks for three anatomically defined regions of interest associated with the experimental task under consideration: right visual cortex (RV), left visual cortex (LV), and left primary motor cortex (LPM). ROIs in this group were defined using cytoarchitectonic probabilistic maps (Eickhoff et al., 2005) available in AFNI. The LV-ROI and RV-ROI consist of all V1 voxels (Amunts et al., 2000) within the left and right hemisphere respectively, the LPM-ROI consists of all anterior and posterior Brodmann Area 4 (BA4) (Geyer et al., 1996) voxels within the left hemisphere. This set of ROIs, obtained from AFNI datasets in Talairach space, were subsequently transformed to each subject original space for data extraction and averaging purposes using a 12-parameters affine transformation matrix. For each subject, the transformation matrix used corresponds to the inverse of the transformation matrix required to bring each subject high resolution MRPAGE anatomical scan into Talairach space.
Signal-to-Noise Ratio (SNR)
Experimental SNR values were computed for each subject at each flip angle for three different tissue compartments: GM, WM and CSF. Computation of the signal component of the SNR ratio (SSSIS) was performed as follows: (1–3) Common preprocessing steps described above, (4) removal of linear and quadratic trends, (5) signal averaging across time, and (6) spatial averaging using the GM, WM and CSF masks obtained as described above. Conversely, estimation of the noise component of the SNR (σo) was accomplished on an individual basis using the runs at θ=0° in the following manner. For each acquired volume at θ=0° we computed the spatial standard deviation of the signal (σ) within a cubic volume of 78400 voxels (out of a total imaging field of 131072 voxels) situated in the center of the imaging field of view. Values computed this way were corrected to account the use of multi-channel RF coil and sum-of-square image reconstruction [σo =1.42σ, equation 4 in (Gilbert, 2007)]. The 105 estimations of σo obtained this way were subsequently averaged to provide a single value of σo per subject.
In addition to the SNR, we also computed experimental values of SNRo and T1, so that we could generate the theoretical curve described in Eq. 4. Average T1 values for GM, WM and CSF were calculated for GM, WM and CSF using the T1 maps generated using the method previously described by Bodurka et al. (2007) and the T1 ranges described above. For the computation of SNRo, So was calculated as the average across subjects of the mean intensity across voxels in each tissue compartment in the first volume of the run at θ=90°.
Temporal Signal-to-Noise Ratio
Experimental TSNR maps were calculated for each subject at each flip angle for the three tissue compartments of interest. TSNR was calculated as the ratio of the mean signal of the time-series divided by the standard deviation of the time- series. Prior to this computation, the preprocessing steps of time-series was equivalent those described for SNR estimation (i.e., intra-run motion correction, spatial registration, and discarding of initial 5 volumes).
For the purpose of the simulations, we also computed experimental values of percent signal fluctuation associated with physiological noise λ (reported in Table 2) using the method described by Kruger et al. (2001) and the data for θ=15°, 45° and 90°.
Table 2.
Experimental Measures of λ, T1, So, SNRo and θS.
| λ | T1 (ms) | So | SNR0 | *θS (°) | |
|---|---|---|---|---|---|
| GM | 0.0092 ± 0.0023 | 1325 ±2 | 2763 ± 130 | 865.98 ± 40.78 | 7.63 ± 1.73 |
| WM | 0.0040 ± 0.0011 | 842 ± 8 | 2092 ± 123 | 655.79 ± 38.67 | 23.85 ± 5.82 |
| CSF | 0.0158 ± 0.0072 | 2836 ± 195 | 2966 ± 240 | 929.75 ± 75.41 | 4.64 ± 2.04 |
Task-related Activation Analysis
The AFNI (Cox, 1996) software package was used for fMRI data analysis. Pre-processing steps included: (1–3) common preprocessing steps described above, (4) spatial smoothing with a Gaussian kernel (full width at half maximum=6mm), and (5) intensity normalization, by dividing each time-series by its own mean. Individual subject levels of activation were subsequently computed using the 3dREML AFNI program to account for temporal autocorrelations. Head motion parameters were incorporated into the analysis as covariates. Activation maps were generated for the contrast task vs. rest for each subject and each flip angle using a statistical threshold of pFDR<0.05.
To evaluate possible changes in detected patterns of activation across different flip angles, we generated activation overlap maps (Havel et al., 2006; Specht et al., 2003) for each subject. In these maps, the value at a given voxel is the relative number of times, across different scanning runs, i.e. across flip angles, that each voxel was classified as significantly active. A value of 100% is achieved if the voxel was classified as significantly active for all measured flip angles. On the other hand, a value of zero is assigned if the voxel was never classified as significantly active. Additionally, to have some quantitative measure of the overlap, we also computed ratios of volume overlap (Roverlap). Roverlap between two different activation maps (i,j; i<>j) is commonly defined as Roverlapi,j =2*Vij/(Vi + Vj) where Vi is the significantly active volume in the ith map, Vj is the significantly active volume in the jth map, and Vij is the significantly active volume common to both the ith and the jth map (Rombouts et al., 1998; Rombouts et al., 1997; Specht et al., 2003). We computed Roverlap for angle-pair and each subject for the full brain, the LPMC ROI and visual cortex (conjunction of LV and RV ROIs). Average and standard deviations were computed to summarize the data.
Although activation overlap maps are a powerful tool to visually evaluate consistency of activations across conditions (in our case, flip angles); this technique is highly dependent on the statistical threshold selected to classify voxels as active/inactive (Specht et al., 2003). To further investigate the effect of the flip angle in a manner independent of statistical thresholds, we looked at the voxel-wise relationship between regression coefficients (β values) at different flip angles. Scatter plots of voxel-wise β values at θ=75° (β75°) against all other flip angles (βi, i=[9°, 15°, 30°, 45°, 60°, 90°, 105°, 120°]) were generated for each subject. For each available scatter plot, a linear fit (βi = β75° × S + C) was computed using MATLAB function polyfit. Estimated slope (S) and constant term (C) for all subjects were subjected to a series of independent T-tests—one per angle—to evaluate whether or not the mean of estimated slopes significantly differed from a value of 1, and the mean of estimated constant terms significantly different from zero. These values were selected because under ideal conditions—i.e., no flip angle effect—scatter plots generated this way should render a linear relationship of the type βi = β75° × 1 + 0 for all angles.
Hemodynamic Response/Contrast-to-Noise Ratio
| (Eq. 11) |
Estimations of the hemodynamic response associated with the task were obtained for all flip angles and all subjects in three different regions of interest (ROI): left visual cortex (LV), right visual cortex (RV), and left primary motor cortex (LPM). Hemodynamic responses were obtained, after common pre-processing steps (1–3) and time-series detrending (constant, linear and quadratic), by means of averaging the time-course of all statistically significant voxels (pFDR<0.05) within each ROI and then subsequently averaging the five available trials per angle.
Hemodynamic responses obtained this way were used to calculate BOLD fMRI contrast-to-noise ratio (CNR), as defined in Eq. 11. For the numerator, σfmri, we used the same estimation of noise that we used in the TSNR computation. The denominator, ΔS, was estimated as the difference between the signal levels during the task period [8s, 24s] and the rest period [40s, 60s]. These slightly delayed and shortened intervals were chosen to account for the delay and decay of the hemodynamic response (Bandettini et al., 1993) in respect to task onset and offset and also to minimize contribution from transient periods.
Tissue Contrast Dependence on Flip Angle
One potential benefit associated with imaging at low flip angles is greater tissue contrast. To evaluate this hypothesis using our experimental data we define tissue contrast between two different tissue compartments (i,j, i<>j) compartments as
| (Eq. 12) |
where SSSIS,i and SSSIS,j are the averaged steady-state signal strength across voxels in tissue compartments i and j respectively. Tissue contrast defined this way varies between zero (no tissue contrast) and ±100 (maximum tissue contrast).
Results
Behavioral Results
Subjects were expected to perform 250 button presses per run. The overall mean number of button presses (solid line) was 250 ± 5. On two isolated occasions (FA=15° for Sbj01; and FA=30° for Sbj07), the number of button presses was slightly below two standard deviations from the mean. Overall, the behavioral data suggests that subjects were extremely compliant with task requirements for the whole duration of the experiment.
SNR and TSNR Results
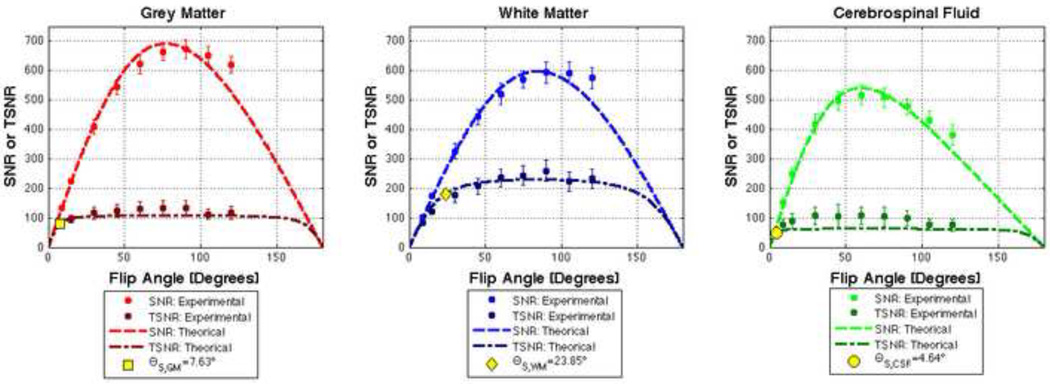
Table 2 summarizes our experimental measurements of T1, λ, So, SNRo and θS for each of the three tissue compartments of interest. Figure 6 shows simulations of Eq. 4 (SNR) and Eq. 7 (TSNR) for GM, WM and CSF generated using the experimental values reported in Table 2. Figure 6 also shows the mean and standard error across all subjects of the empirical measures of SNR and TSNR. Good agreement between theoretical curves and experimental data can be observed in the figure. Finally, suggested flip angles for the three tissue compartments are also depicted in Figure 6 as yellow markers in the corresponding TSNR curves.
FIGURE 6.
SNR and TSNR Results for GM, WM and CSF. Dotted lines represent simulations of Eq. 4 and 9 using parameter values obtained experimentally (Table 2). Averaged measurements of SNR and TSRN are represented as circles. Standard deviation error bars accompany these mean values. Finally, suggested flip angles are depicted as yellow markers for each tissue compartment.
Hemodynamic Response/Contrast-to-Noise Ratio Results
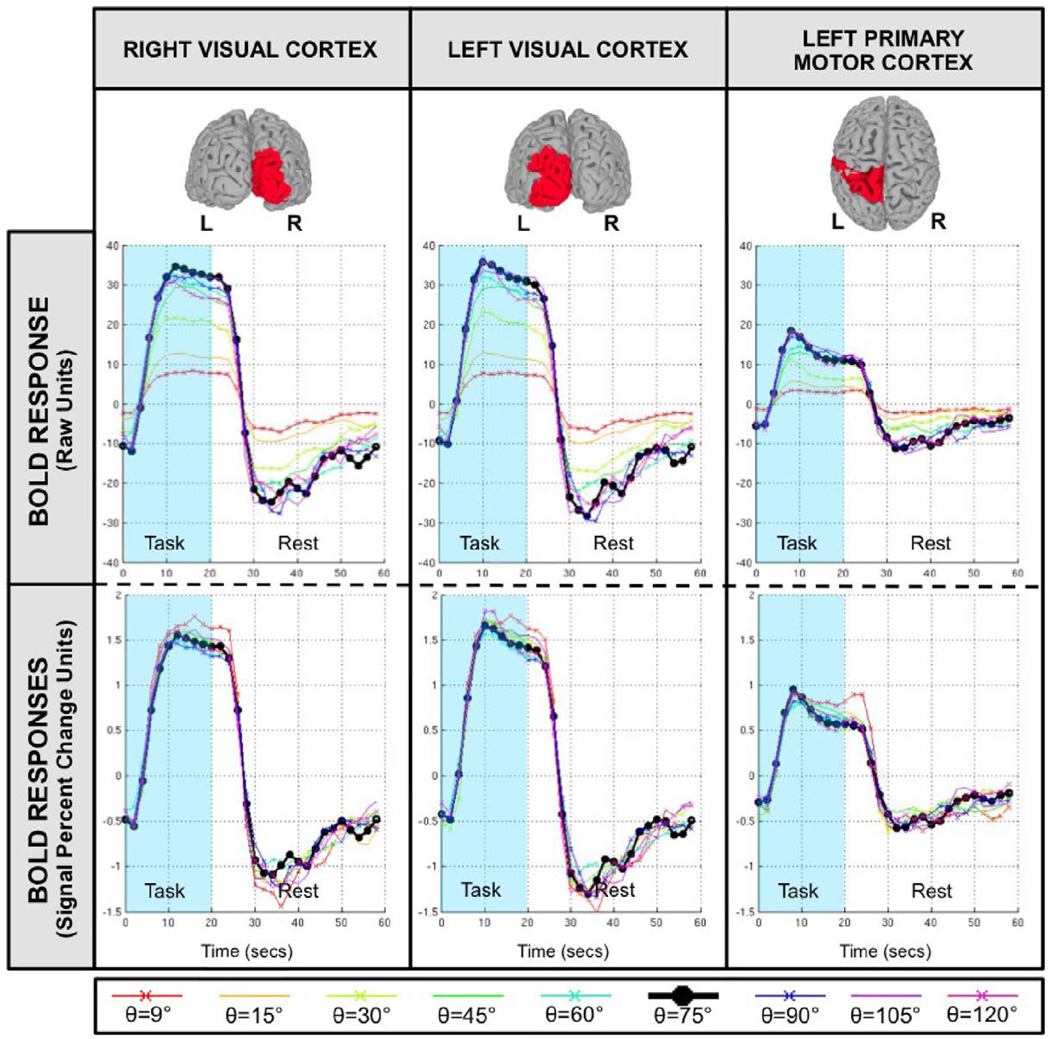
Figure 7 shows estimations of the hemodynamic response (HR) associated with the task epochs for three different anatomically defined ROIs (top row). The middle row shows estimations in raw BOLD intensity units—i.e., prior to intensity normalization—while the bottom row shows estimations in signal percent change units—i.e., after intensity normalization. Estimated hemodynamic responses show variation as a function of flip angle and ROI. Estimated responses are larger in visual cortex than in motor cortex for all flip angles. Prior to normalization, estimated responses show clear differences across flip angles. Responses for small angles (θ=[9°, 15°, 30°]) are appreciably smaller than the response for the reference angle (θ=75°, black curve) in all ROIs. Conversely, for larger angles (θ=[45°, 60°, 90°, 105°, 120°]), the differences are small (visual cortex) or do not exist (motor cortex). After intensity normalization, differences across ROI persists, e.g. visual cortex ROIs shows a positive deflection of about 1.5% while motor cortex shows levels below 1%, but differences across flip angles are clearly reduced. Intensity normalized HRs are almost undistinguishable across flip angles in all three ROIs, with the exception of the HR for θ=9° (red curve), which appears to be slightly stronger in all regions.
FIGURE 7.
Averaged hemodynamic response across all eight subjects for all flip angles in three different anatomically defined ROIs: right visual cortex, left visual cortex and left primary motor cortex. The top panel shows 3D renderings of the ROIs. The middle panel shows estimations of the hemodynamic response without intensity normalization (i.e., only constant, linear and quadratic trends were removed). The bottom panel shows estimations of hemodynamic response in terms of signal percent change. These were obtained by means of intensity normalization prior to the detrending step.
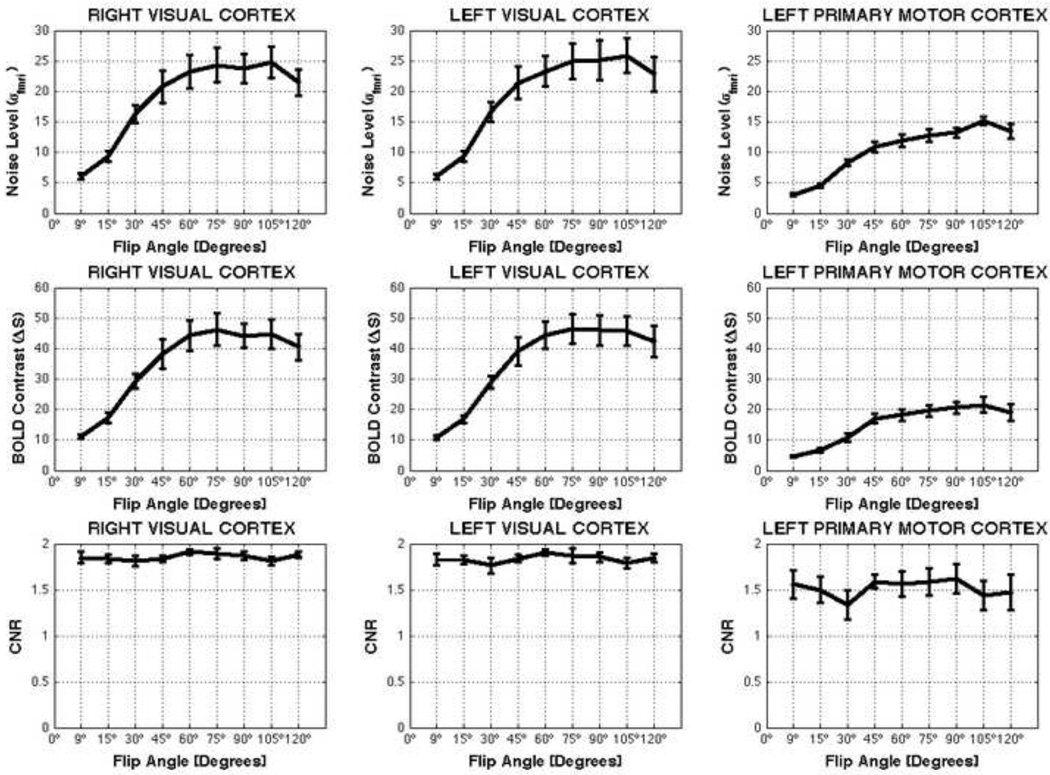
Across subjects averaged total noise (σfmri), BOLD contrast (ΔS) and CNR levels are presented in Figure 8. Noise level and BOLD contrast vary with flip angle, still CNR appears not to be modulated by flip angle, at least for the angles under consideration. To evaluate the significance of these observations we performed independent 3-way mixed effect ANOVAs [A=Flip Angle, Fixed; B=Subject, Random; C=ROI, Fixed] for each metric. Noise levels significantly vary across flip angles (F=60.32; p<0.05) in all ROIs. Subsequent multiple comparison analysis (MATLAB function multcompare) reveals that noise levels at low angles [θ=9°, 15°, and 30°] were significantly smaller than noise levels at θ=75°. For all other angles, the multiple comparison analysis on noise levels revealed no significant differences with θ=75°. The same tendency is true for BOLD contrast levels (F=42.76; p<0.05). Conversely, CNR shows no significant variation across flip angles (F=1.09, p=0.37).
FIGURE 8.
Average values for noise level (σfmri), BOLD contrast (ΔS) and contrast-to-noise Ratio (CNR) across flip angles for different anatomically defined ROIs. Error bars represent standard errors.
Task-related Activation Results
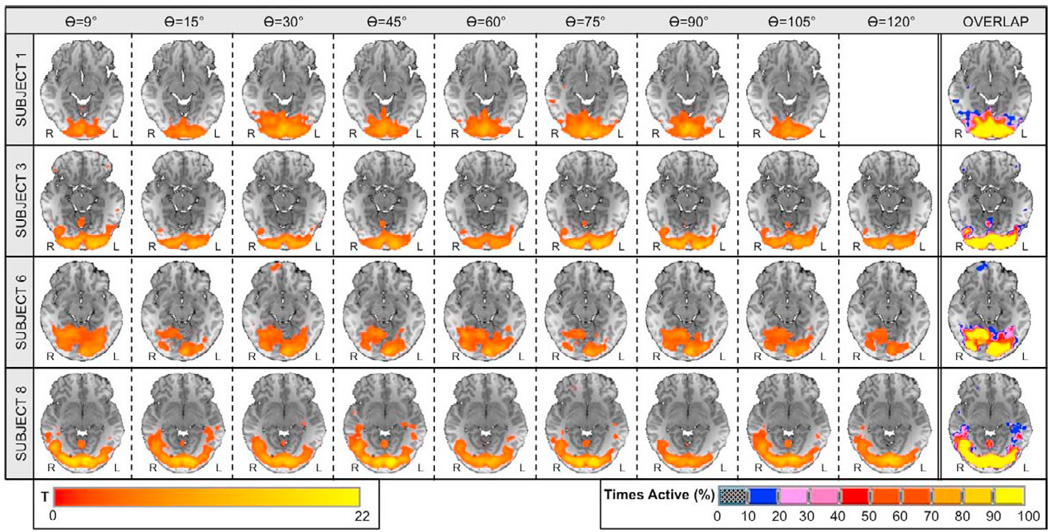
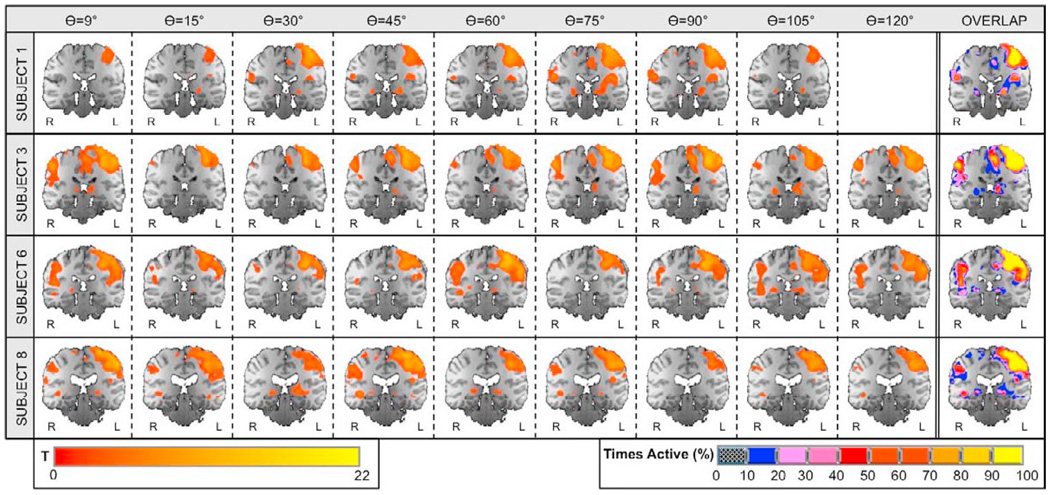
Figures 9 and 10 show statistical maps of activation for visual and motor cortices, respectively, in a sample of four representative subjects. Results for the remaining set of subjects were similar to the ones depicted in the figures. Significant activations at pFDR<0.05 were detected in bilateral visual cortex and left primary motor cortex in all subjects and at all flip angles. Overlap maps on the right most column of the figures show high consistency of activation across flip angles for each subject in both regions. The ratio of volume overlap for the full brain was Roverlap = 0.65 ± 0.06. When calculations are restricted to the left primary motor ROI, Roverlap increases to a value of 0.76 ± 0.09. When the ratio is computed considering all voxels within left and right visual ROIs, it reaches a value of 0.91 ± 0.04.
FIGURE 9.
Visual Cortex: significant activations and overlap maps. Columns one through nine show significantly active voxels (pFDR<0.05) within visual cortex on an axial slice centered at Talairach (1988) coordinate z = −11mm for four representative subjects. Column ten shows individual activation overlap maps for the same axial slice. The color of a voxel in these maps represents the frequency of that voxel being classified as significantly active across all runs for the different flip angles (see lower right scale).
FIGURE 10.
Motor Cortex: significant activations and overlap maps. Columns one through nine show significantly active voxels (pFDR<0.05) within visual cortex on a coronal slice centered at Talairach (1988) coordinate y = −27mm for four representative subjects. Column ten shows individual activation overlap maps for the same axial slice. The color of a voxel in these maps represents the frequency of that voxel being classified as significantly active across all runs for the different flip angles (see lower right scale).
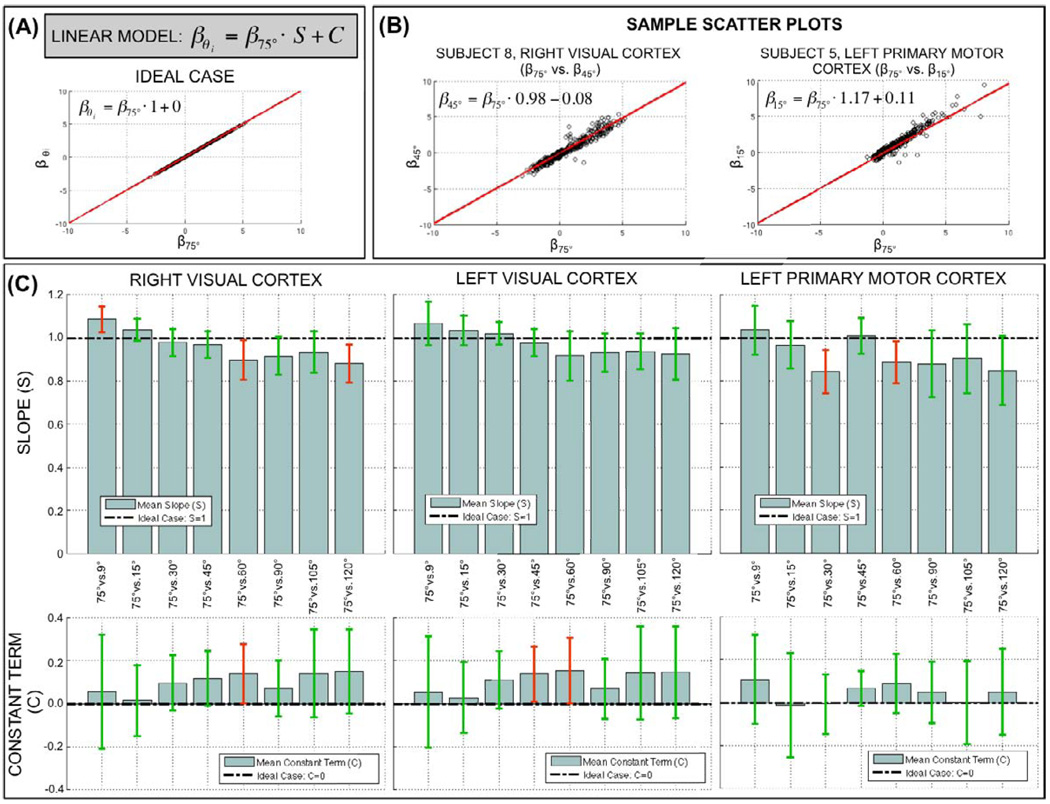
Finally, Figure 11 shows results for the voxel-wise β-coefficient correlation analysis. Figure 11.A shows a scatter plot and linear fit for the ideal case where voxel-wise estimations of β are identical for two different flip angles. For this ideal situation to occur, there is the need for no flip angle effect (meaning beta values are the same across different flip angles) and no uncounted inter-run variance. Figure 11.B shows two representative scatter plots computed for two different subjects (Sbj8, Sbj5) and two different ROIs (right visual cortex, left primary motor cortex). A clear linear relationship exists between the β-coefficients at θ=75° and other flip angles (θ=45°, θ=15°). Moreover, the slope (S=0.98, S=1.17) and constant terms (C=−0.08, C=0.11) of these two representative cases do not greatly differ from the ones associated with the ideal case (S=1, C=0). To evaluate if deviations from the ideal case were significant, we computed averaged values of S and C for each angle-pair comparison within each ROI. Figure 11.C shows a summary of these average values (bar height = average value, error bar = 95% confidence interval). The slope of the linear fits was significantly different (pUncorrected<0.05) from the ideal case (S=1) in three cases for the right visual ROI (red error bars), two cases for the left primary motor cortex (red error bars), and no cases for the left visual cortex. When corrected for multiple comparisons (pBonferroni<0.05) none of these cases survive the threshold. With respect to the constant term, a similar situation arises. The constant term was significantly different (pUncorrected<0.05) from the ideal case (C=0) for one case in the right visual cortex (red error bars), two cases in the left visual cortex (red error bars) and no cases for the left primary motor cortex. When corrected for multiple comparisons (pBonferroni<0.05) none of these cases survived the threshold.
FIGURE 11.
(A) Linear model for the scatter plot analysis and scatter plot for ideal case in which voxel-wise β estimations are identical for two different flip angles. (B) Sample scatter plots and linear fits for two different subjects (Sbj8, Sbj5) and two different ROIs (Right Visual Cortex, Left Primary Motor Cortex). (C) Summary of slope (upper row) and constant terms (bottom row) of the linear fits generated for each available scatter plot. Bars represent across-subjects averaged values for each scatter plot. Error bars represent 95% confidence intervals. Error bars in red color shows the cases in which either value (slope or constant term) are significantly different (p<0.05) from the ideal case. Green error bars are used for the cases where there is no significant deviation from the ideal case.
Tissue Contrast dependence with Flip Angle
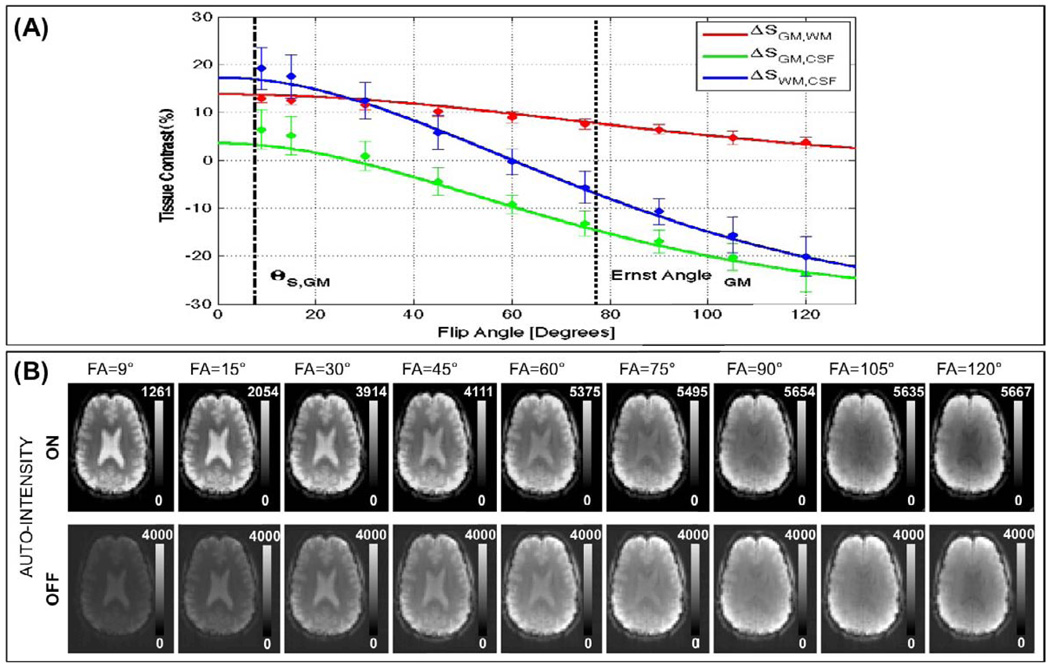
Figure 12.A shows simulations of Eq. 12 for three tissue contrasts of interest; namely GM vs. WM (ΔSWM,GM), GM vs. CSF (ΔSGM,CSF) and WM vs. CSF (ΔSWM,CSF). These simulations correspond to a TR=2s and experimental measures of So and T1 reported in Table 2. Mean and standard deviation measures of tissue contrast at imaged flip angles are also presented in the figure. Agreement between experimental measures and theoretical curves can be observed in the figure. Moreover, it can be observed that contrast between WM and CSF is higher at lower flip angles in the vicinity of θS,GM (black dashed line; ΔSGM,CSF≈16%) than at larger imaging angles in the vicinity of the Ernst angle for GM (black dotted line; ΔSGM,CSF≈−8%). Figure 12.B shows axial slices, after steady-state have been reached, for an exemplary subject. This figure allows us to visually appreciate how better contrast at lower flip angles translates in easier segregation of tissue compartments.
FIGURE 12.
(A) Experimental and Theoretical curves describing dependence of tissue contrast with flip angle for three tissue contrast of interest: GM vs. WM (ΔSGM,WM), GM vs. CSF (ΔSGM,CSF), and WM vs. CSF (ΔSWM,CSF). (B) Axial slices, after steady-state has been reached, for all acquired flip angles for an exemplary subject.
Discussion
Physiological noise is a major source of undesired variance in BOLD fMRI time courses in a vast majority of experimental situations (Kruger et. Al. 2001a, 2001b, Triantafyllou et al., 2006, Bodurka et al., 2007). We have investigated, both theoretically and experimentally the effect that MR-signal strength-dependent physiological noise exerts on BOLD fMRI temporal signal to noise ratio (TSNR) as a function of the flip angle in situations where physiological noise constitutes a dominant source of time course variance. We have scanned 8 subjects at a commonly used BOLD fMRI voxel volume of 3.75×3.75×4 mm3, where physiological noise is the dominant source of time course variance (Bodurka et al., 2007); and physiological noise introduces a non-linear dependence in TSNR, which translates into a flattening of the TSNR vs. flip angle curve. We have also demonstrated that this TSNR behavior can be exploited to perform BOLD-fMRI at flip angles other than the Ernst angle with no detrimental effects in our ability to detect statistically significant neuronal activations.
Our results show that TSNR behavior, as a function of flip angle (θ), diverges when different levels of physiological noise are present in the data. Using mathematical formulations (Eq. 4 and 7) and computer simulations (Figures 1 and 2), we predicted two different situations. Under null or low levels of physiological noise, SNR(θ) and TSNR(θ) exhibit similar flip angle dependence. Both metrics reach a maximum value for θ=Ernst angle, and both metrics rapidly decrease as we move away from that angle. Conversely, under higher levels of physiological noise, SNR(θ) and TSNR(θ) no longer behave in a similar manner and two different imaging regimes can be defined. At low flip angles, and consequently low SNR levels, SNR and TSNR vary abruptly with flip angle (Figure 3). On the other hand, at higher angles around the Ernst angle, which correspond to higher SNR levels, we enter a different imaging regime in which TSNR dependence with flip angle flattens and TSNR values are close to the maximal TSNR (TSNR at the Ernst angle) for a wide range of flip angles. This set of theoretical predictions was confirmed experimentally using data collected for eight normal subjects using a motor/visual task. As Figure 6 shows, theoretical simulations and experimental data agree. TSNR curves show flattening effects for the three tissue compartments under consideration (GM, WM and CSF). Moreover, as expected (Bodurka et al 2007), the degree of flatness is larger for the two tissue compartments (GM and CSF) with the bigger contributions of physiological noise (λGM=0.92%, λCSF=1.58%).
In addition, a way to estimate the minimum flip angle to use without entering the low SNR regime was provided in Eq. 10. This equation uses as input experimental SNR levels (in the form of SNRo) and physiological noise characteristics of the target imaging tissue (in the form of λ), normally grey matter. This expression is valid only when exp−TR/T1,GM≪1, which is the case for most BOLD fMRI whole brain studies conducted with TR of 2–3 seconds. Using our experimental measures of SNRo and λGM the suggested flip angle for our experimental conditions is 7.63 ± 1.73°. As Figure 6 shows, this flip angle is located slightly to the right of the angle for which SNR and TSNR curves as a function of flip angle start to diverge. Moreover, at the suggested angle it can be observed that while TSNR in grey matter has a negligible decrease as compared to its maximum value, SNR is well below half its maximum value. This is so, because at this flip angle, physiological noise is still equal to non-physiological noise. In other words, physiological noise is not the dominant source of noise anymore, but still an important contributor (at least at the same level as the thermal noise). It is for this reason that the provided formulation of the suggested flip angle provides us with a conservative estimate for researchers to calculate a minimum flip angle, that will allow benefiting from many advantages associated with imaging at low flip angles (see below) without incurring in large losses of TSNR or ability to detect BOLD activation.
As stated in the Methods section, physiological noise correction techniques were not employed in the present study to allow full assessment of physiological noise contributions. When in place, physiological noise correction techniques (e.g., (Birn et al., 2006; Glover et al., 2000)) are expected to reduce the amount of physiological noise present in the data and therefore affect the TSNR vs. flip angle behavior studied in these experiments. Initially, after physiological noise corrections are in place, lambda (λ) values for a given tissue compartment are expected to decrease. This should translate into a reduction of the flip angle range for which TSNR stays fairly constant and close to its maximum. It should also lead to larger suggested imaging flip angles (θS). However, the actual extent to which different physiological noise correction schemes will affect the TSNR behavior described in this work needs to be evaluated in detail—as it is expected to strongly depend on the specificity and efficiency of each particular physiological noise removal technique—and it is beyond the scope of the present document.
An additional objective of the present work was to evaluate if the non-linear behavior of TSNR described above translates into the opportunity to perform BOLD-fMRI at angles other than the Ernst angle with no detrimental effects in our ability to detect neuronal activation. Our experimental results confirm that the use of angles as low as θ=9°—which is slightly above the suggested flip angle for GM (θS,GM)—does not affect recorded hemodynamic responses, nor introduce significant changes in CNR, and ultimately has no negative effect on the detection of BOLD-related activations.
Hemodynamic response estimations associated with task epochs were reliably detected in all subjects for both bilateral visual cortex and left primary motor cortex. Prior to intensity normalization, estimated hemodynamic responses show differences across flip angles. Responses for smaller flip angles [θ=9°, 15°, 30°] have appreciably smaller positive and negative deflections during task and rest periods, respectively, than at the rest of the angles. This is an expected result for steady-state gradient-echo fMRI in which available transverse magnetization, and therefore signal intensity, is a direct function of flip angle. Conversely, after intensity normalization, no appreciable difference exists between the detected hemodynamic responses at all flip angles under consideration. This result suggests that, even though absolute signal levels differ across flip angles, the signal percent change that accompanies task-related neuronal activation has negligible dependence on flip angle. A similar result was obtained in terms of CNR measures (Figure 8). While BOLD-contrast (prior to intensity normalization) and noise levels, both showed significant effects with flip angle, its ratio (CNR) did not showed any significant effect.
Detected spatial patterns of activation, i.e. statistically thresholded activation maps, in visual and motor cortex were consistent across flip angles for all subjects. Although some level of variability can be observed in the overlap maps (Figures 10 and 11), the amount of variability does not exceed previously reported test-retest within-subject variability levels for similar visual and motor tasks. For example, Miki et al. (2001) has previously reported intra-session Roverlap ranging from 0.56 to 0.66 for a flashing checkerboard task at 4T. Roverlap values for finger tapping tasks range from 0.41 to 0.50 (Gountouna et al., 2010; Tegeler et al., 1999). All this values are lower than the Roverlap values computed in this study. Although a direct quantitative comparison of Roverlap across studies is difficult given differences in task, hardware, analysis methodology, statistical threshold, volume considered in the analysis, subject demographics, and/or elapsed time between scans; they provide support for the claim that using angles other than the Ernst angle do not cause any disadvantage when attempting to detect BOLD related activations, at least for the task and the range of angles under consideration in this study.
Evaluation of plausible flip angle effects on the estimation of regression coefficients (β) at single-subject statistical analysis also rendered not significant. This result suggests that second level statistical analysis (group analysis), which uses as input β coefficients from individual subjects, should not be negatively affected by the use of angles other than the Ernst angle. Scatter plot and correlation analysis results show that a voxel-wise linear relation exists between β coefficients at θ=75°(closest available angle to the Ernst angle for GM at 3T and TR=2 s) and all other angles. Moreover, we showed that the slope (S) and constant term (C) of this linear relationship are not significantly different from the ideal case (S=1, C=0) in which voxel-wise β coefficients would be identical across flip angles. Although deviations from the ideal case exists, the fact that these are not significant or consistent across ROIs, suggest that these variations are solely the result of random inter-scan variations not accounted for by the regression analysis; and not a systematic effect attributable to changes in the flip angle.
Although the analysis on how imaging flip angle affects hemodynamic response, CNR, activation extent and â coefficients was performed on data collected using a specific experimental sensorimotor epoch design, we believe that the main conclusion of such analysis—namely that flip angle has no systematic effect on the ability to detect BOLD-based neuronal activity—remains valid for other types of fMRI experimental paradigms such as event-related designs, high-order cognitive tasks, etc. We construct this claim on the base that changes to the experimental task are not expected to modify the TSNR vs. flip angle non-linear relationship described in this work. Nonetheless, prior to adoption of a low imaging angle for a set of experiments, researchers are encouraged to confirm that physiological noise is the dominant source of noise in their setting (σp/σo ≫1) and that SNR levels are sufficiently high. One way to obtain such confirmation is to compute the suggested imaging flip angle using Eq. 10 (or its non-approximated version Eq. 9). Inputs to these formulas include experimental measures of physiological noise and SNR levels specific to the experimental settings under consideration. If both requirements are satisfied, the suggested flip angle will be lower than the Ernst angle. On the other hand, if one or both of these requirements are not satisfied the computed suggested angle will be equal or greater than the Ernst angle (see Figure 4 for a case when physiological noise decreases to levels in which it is no longer the dominant noise source) and researchers should consider using the Ernst angle. As a general guideline, experiments conducted at field strengths equal or greater than 3 Tesla, using receiver array-coils of eight or more elements and voxels size in the vicinity of 50 mm3 (3.75 × 3.75 × 4.00 mm) will lead to suggested imaging flip angles well below the Ernst angle.
We believe these results have important implications for experimental fMRI, as the use of small flip angles provides important additional benefits such as better tissue contrast, less inflow effects (Gao et al., 1996), less through-plane motion artifacts, lower physiological noise levels, shorter scanning times, and reduced levels of radio-frequency (RF) energy deposition. All these benefits arise through the following mechanisms. The flip angle for an MR experiment is computed by:
The most common method of modulating flip angle is by changing by RF pulse amplitude. RF pulse amplitude determines the power delivered to the excited volume, and then net energy deposited in that volume over time. The energy deposited to an excited region is proportional to the time-averaged square of the RF pulse amplitude. Reducing the amplitude of the RF waveform therefore reduces the energy deposited thereby correspondingly reducing SAR issues. Because of the quadratic dependence of instantaneous power and total energy deposition on RF amplitude, a reduction in RF amplitude by a factor of approximately 10 (from and Ernst angle of approximately 77° for H1 imaging at 3T, to approximately 7.6° here) corresponds to a reduction in SAR by a factor of approximately 100.
Reducing the flip angle also improves robustness against through-plane motion artifacts (Frahm et al., 1994). When a slab of tissue is subject to an RF pulse for imaging, its magnetization is perturbed away from equilibrium (infinite TR) state. Through-plane motion artifacts arise from the RF-excited slab of tissue being in a different state of saturation of relaxation relative to the neighboring tissue. Use of a smaller flip angle perturbs the excited slice by a smaller amount, and reduces the saturation/relaxation differences between excited and non-excited tissue. Therefore any motion of spins into or out of the excited region should have a smaller effect, due to the relatively smaller difference between the excited and equilibrium states of a region of tissue when excited by smaller flip angle RF pulses.
Another potential benefit associated with the use of low flip angles is the reduction of inflow-effects, which translates in improved ability to localize true activation sites (Gao et al., 1996; Glover et al., 1996; Liu et al., 2008). Inflow effects can induce both an amplitude change (Gao et al., 1996; Glover et al., 1996) and a change in rise-time latency (Liu et al., 2008) of the measured MRI signal, that superimposes on signal changes due to pure BOLD effect. Both of these artifacts are lessened when using flip angles well below the Ernst angle (Glover et al., 1996; Liu et al., 2008). In our data, signal changes associated with task activation show no apparent differences in amplitude or rise-time latency as flip angles increases (bottom panel in Figure 7). This suggests that inflow effects were negligible for all flip angles under consideration. This is most likely due to the long TR (Glover et al., 1996), the multi-slice acquisition scheme (Howseman et al., 1999), and fewer task repetitions used in our experiments.
Finally, improvement in tissue contrast between GM, WM and CSF for low flip angles was predicted theoretically (Eq. 12, Figure 12.A) and observed experimentally (Figure 12.B). Higher contrast between GM, WM and SCF has potential to improve the outcome of both registration and tissue segmentation algorithms.
Among all these potential benefits, the reduction of physiological noise contribution and RF energy deposition are of extreme importance in the context of fMRI at ultra-high imaging fields (Bo ≥ 4 T), as the higher physiological noise levels (Triantafyllou et al., 2005), the higher amounts of RF-induced heating (Vaughan et al., 2001), and flip angle non-uniformities (Wang et al., 2006) present at these higher fields often limit experimental designs and quality of data. The results presented here suggest that for vast majority of BOLD fMRI studies at ultra-high fields, where physiological noise dominates, the use of lower flip angles can help overcome these difficulties without any tradeoff in the ability to detect BOLD activations.
Conclusions
We have shown that it is possible to use a much lower flip angles than the Ernst angle for gray matter in typical gradient echo BOLD fMRI studies without any tradeoff, as long as physiological noise dominates. We have provided a way to estimate the minimum flip angle to use given experimental values of SNR and physiological noise levels. We have also argued about a series of benefits that accompany imaging at low flip angles, some of which are of great importance to overcome some of the current limitations of performing fMRI at ultra-high imaging fields.
Research highlights
Physiological Noise dominates & SNR is high → TSNR vs. Flip Angle curve flattens
Lowering Flip Angle (≪Ernst Angle) causes minimal loss in TSNR
Lowering Flip Angle (≪Ernst Angle) does not affect BOLD sensitivity
Lowering Flip Angle (≪Ernst Angle) improves tissue contrast, reduce inflow effects
Footnotes
Publisher's Disclaimer: This is a PDF file of an unedited manuscript that has been accepted for publication. As a service to our customers we are providing this early version of the manuscript. The manuscript will undergo copyediting, typesetting, and review of the resulting proof before it is published in its final citable form. Please note that during the production process errors may be discovered which could affect the content, and all legal disclaimers that apply to the journal pertain.
References
- Amunts K, Malikovic A, Mohlberg H, Schormann T, Zilles K. Brodmann's areas 17 and 18 brought into stereotaxic space-where and how variable? Neuroimage. 2000;11:66–84. doi: 10.1006/nimg.1999.0516. [DOI] [PubMed] [Google Scholar]
- Bandettini PA, Jesmanowicz A, Wong EC, Hyde JS. Processing strategies for time-course data sets in functional MRI of the human brain. Magn Reson Med. 1993;30:161–173. doi: 10.1002/mrm.1910300204. [DOI] [PubMed] [Google Scholar]
- Bellgowan PS, Bandettini PA, van Gelderen P, Martin A, Bodurka J. Improved BOLD detection in the medial temporal region using parallel imaging and voxel volume reduction. Neuroimage. 2006;29:1244–1251. doi: 10.1016/j.neuroimage.2005.08.042. [DOI] [PubMed] [Google Scholar]
- Birn RM, Diamond JB, Smith MA, Bandettini PA. Separating respiratory-variation-related fluctuations from neuronal-activity-related fluctuations in fMRI. Neuroimage. 2006;31:1536–1548. doi: 10.1016/j.neuroimage.2006.02.048. [DOI] [PubMed] [Google Scholar]
- Bodurka J, Bandettini PA. Physiological Noise Effects on the Flip Angle Selection in BOLD fMRI. 17th Scientific Meeting International Society for Magnetic Resonance in Medicine; Honolulu. 2009. p. S184. [DOI] [PMC free article] [PubMed] [Google Scholar]
- Bodurka J, Ye F, Petridou N, Murphy K, Bandettini PA. Mapping the MRI voxel volume in which thermal noise matches physiological noise--implications for fMRI. Neuroimage. 2007;34:542–549. doi: 10.1016/j.neuroimage.2006.09.039. [DOI] [PMC free article] [PubMed] [Google Scholar]
- Cox RW. AFNI: software for analysis and visualization of functional magnetic resonance neuroimages. Comput Biomed Res. 1996;29:162–173. doi: 10.1006/cbmr.1996.0014. [DOI] [PubMed] [Google Scholar]
- de Zwart JA, Ledden PJ, van Gelderen P, Bodurka J, Chu R, Duyn JH. Signal-to-noise ratio and parallel imaging performance of a 16-channel receive-only brain coil array at 3.0 Tesla. Magn Reson Med. 2004;51:22–26. doi: 10.1002/mrm.10678. [DOI] [PubMed] [Google Scholar]
- Edelstein WA, Glover GH, Hardy CJ, Redington RW. The intrinsic signal-to-noise ratio in NMR imaging. Magn Reson Med. 1986;3:604–618. doi: 10.1002/mrm.1910030413. [DOI] [PubMed] [Google Scholar]
- Eickhoff SB, Stephan KE, Mohlberg H, Grefkes C, Fink GR, Amunts K, Zilles K. A new SPM toolbox for combining probabilistic cytoarchitectonic maps and functional imaging data. Neuroimage. 2005;25:1325–1335. doi: 10.1016/j.neuroimage.2004.12.034. [DOI] [PubMed] [Google Scholar]
- Ernst RR, Anderson WA. Application of Fourier Transform Spectroscopy to Magnetic Resonance. Review of Scientific Instruments. 1996;37:93–102. [Google Scholar]
- Frahm J, Merboldt KD, Hanicke W, Kleinschmidt A, Boecker H. Brain or vein--oxygenation or flow? On signal physiology in functional MRI of human brain activation. NMR Biomed. 1994;7:45–53. doi: 10.1002/nbm.1940070108. [DOI] [PubMed] [Google Scholar]
- Gao JH, Miller I, Lai S, Xiong J, Fox PT. Quantitative assessment of blood inflow effects in functional MRI signals. Magn Reson Med. 1996;36:314–319. doi: 10.1002/mrm.1910360219. [DOI] [PubMed] [Google Scholar]
- Geyer S, Ledberg A, Schleicher A, Kinomura S, Schormann T, Burgel U, Klingberg T, Larsson J, Zilles K, Roland PE. Two different areas within the primary motor cortex of man. Nature. 1996;382:805–807. doi: 10.1038/382805a0. [DOI] [PubMed] [Google Scholar]
- Gilbert G. Measurement of signal-to-noise ratios in sum-of-squares MR images. J Magn Reson Imaging. 2007;26:1678. doi: 10.1002/jmri.21171. author reply 1679. [DOI] [PubMed] [Google Scholar]
- Glover GH, Lemieux SK, Drangova M, Pauly JM. Decomposition of inflow and blood oxygen level-dependent (BOLD) effects with dual-echo spiral gradient-recalled echo (GRE) fMRI. Magn Reson Med. 1996;35:299–308. doi: 10.1002/mrm.1910350306. [DOI] [PubMed] [Google Scholar]
- Glover GH, Li TQ, Ress D. Image-based method for retrospective correction of physiological motion effects in fMRI: RETROICOR. Magn Reson Med. 2000;44:162–167. doi: 10.1002/1522-2594(200007)44:1<162::aid-mrm23>3.0.co;2-e. [DOI] [PubMed] [Google Scholar]
- Gountouna VE, Job DE, McIntosh AM, Moorhead TW, Lymer GK, Whalley HC, Hall J, Waiter GD, Brennan D, McGonigle DJ, Ahearn TS, Cavanagh J, Condon B, Hadley DM, Marshall I, Murray AD, Steele JD, Wardlaw JM, Lawrie SM. Functional Magnetic Resonance Imaging (fMRI) reproducibility and variance components across visits and scanning sites with a finger tapping task. Neuroimage. 2010;49:552–560. doi: 10.1016/j.neuroimage.2009.07.026. [DOI] [PubMed] [Google Scholar]
- Havel P, Braun B, Rau S, Tonn JC, Fesl G, Bruckmann H, Ilmberger J. Reproducibility of activation in four motor paradigms. An fMRI study. J Neurol. 2006;253:471–476. doi: 10.1007/s00415-005-0028-4. [DOI] [PubMed] [Google Scholar]
- Howseman AM, Grootoonk S, Porter DA, Ramdeen J, Holmes AP, Turner R. The effect of slice order and thickness on fMRI activation data using multislice echo-planar imaging. Neuroimage. 1999;9:363–376. doi: 10.1006/nimg.1998.0418. [DOI] [PubMed] [Google Scholar]
- Kruger G, Glover GH. Physiological noise in oxygenation-sensitive magnetic resonance imaging. Magn Reson Med. 2001;46:631–637. doi: 10.1002/mrm.1240. [DOI] [PubMed] [Google Scholar]
- Kruger G, Kastrup A, Glover GH. Neuroimaging at 1.5 T and 3.0 T: comparison of oxygenation-sensitive magnetic resonance imaging. Magn Reson Med. 2001;45:595–604. doi: 10.1002/mrm.1081. [DOI] [PubMed] [Google Scholar]
- Lin C, Bernstein M, Huston J, Fain S. Measurements of T1 Relaxation times at 3.0T: Implications for clinical MRA. 9th Annual Meeting of the Society of Magnetic Resonance in Medicine; Berkeley, CA. 2001. p. 1391. [Google Scholar]
- Liu HL, Wei PS, Wai YY, Kuan WC, Huang CM, Wu CW, Buckle C, Wan YL, Gao JH. Inflow effects on hemodynamic responses characterized by event-related fMRI using gradient-echo EPI sequences. Med Phys. 2008;35:4300–4307. doi: 10.1118/1.2975141. [DOI] [PubMed] [Google Scholar]
- Miki A, Liu GT, Englander SA, Raz J, van Erp TG, Modestino EJ, Liu CJ, Haselgrove JC. Reproducibility of visual activation during checkerboard stimulation in functional magnetic resonance imaging at 4 Tesla. Jpn J Ophthalmol. 2001;45:151–155. doi: 10.1016/s0021-5155(00)00352-x. [DOI] [PubMed] [Google Scholar]
- Murphy K, Bodurka J, Bandettini PA. How long to scan? The relationship between fMRI temporal signal to noise ratio and necessary scan duration. Neuroimage. 2007;34:565–574. doi: 10.1016/j.neuroimage.2006.09.032. [DOI] [PMC free article] [PubMed] [Google Scholar]
- Ogawa S, Menon RS, Tank DW, Kim SG, Merkle H, Ellermann JM, Ugurbil K. Functional brain mapping by blood oxygenation level-dependent contrast magnetic resonance imaging. A comparison of signal characteristics with a biophysical model. Biophys J. 1993;64:803–812. doi: 10.1016/S0006-3495(93)81441-3. [DOI] [PMC free article] [PubMed] [Google Scholar]
- Parrish TB, Gitelman DR, LaBar KS, Mesulam MM. Impact of signal-to-noise on functional MRI. Magn Reson Med. 2000;44:925–932. doi: 10.1002/1522-2594(200012)44:6<925::aid-mrm14>3.0.co;2-m. [DOI] [PubMed] [Google Scholar]
- Rombouts SA, Barkhof F, Hoogenraad FG, Sprenger M, Scheltens P. Within-subject reproducibility of visual activation patterns with functional magnetic resonance imaging using multislice echo planar imaging. Magn Reson Imaging. 1998;16:105–113. doi: 10.1016/s0730-725x(97)00253-1. [DOI] [PubMed] [Google Scholar]
- Rombouts SA, Barkhof F, Hoogenraad FG, Sprenger M, Valk J, Scheltens P. Test-retest analysis with functional MR of the activated area in the human visual cortex. AJNR Am J Neuroradiol. 1997;18:1317–1322. [PMC free article] [PubMed] [Google Scholar]
- Specht K, Willmes K, Shah NJ, Jancke L. Assessment of reliability in functional imaging studies. J Magn Reson Imaging. 2003;17:463–471. doi: 10.1002/jmri.10277. [DOI] [PubMed] [Google Scholar]
- Talairach J, Tornoux P. Co-planar stereotaxic atlas of the human brain : 3-dimensional proportional system : an approach to cerebral imaging. Stuttgart: Georg Thieme; 1988. [Google Scholar]
- Tegeler C, Strother SC, Anderson JR, Kim SG. Reproducibility of BOLD-based functional MRI obtained at 4 T. Hum Brain Mapp. 1999;7:267–283. doi: 10.1002/(SICI)1097-0193(1999)7:4<267::AID-HBM5>3.0.CO;2-3. [DOI] [PMC free article] [PubMed] [Google Scholar]
- Triantafyllou C, Hoge RD, Krueger G, Wiggins CJ, Potthast A, Wiggins GC, Wald LL. Comparison of physiological noise at 1.5 T, 3 T and 7 T and optimization of fMRI acquisition parameters. Neuroimage. 2005;26:243–250. doi: 10.1016/j.neuroimage.2005.01.007. [DOI] [PubMed] [Google Scholar]
- Vaughan JT, Garwood M, Collins CM, Liu W, DelaBarre L, Adriany G, Andersen P, Merkle H, Goebel R, Smith MB, Ugurbil K. 7T vs. 4T: RF power, homogeneity, and signal-to-noise comparison in head images. Magn Reson Med. 2001;46:24–30. doi: 10.1002/mrm.1156. [DOI] [PubMed] [Google Scholar]
- Wang J, Qiu M, Kim H, Constable RT. T1 measurements incorporating flip angle calibration and correction in vivo. J Magn Reson. 2006;182:283–292. doi: 10.1016/j.jmr.2006.07.005. [DOI] [PubMed] [Google Scholar]
- Wansapura JP, Holland SK, Dunn RS, Ball WS., Jr NMR relaxation times in the human brain at 3.0 tesla. J Magn Reson Imaging. 1999;9:531–538. doi: 10.1002/(sici)1522-2586(199904)9:4<531::aid-jmri4>3.0.co;2-l. [DOI] [PubMed] [Google Scholar]
- Zur Y, Wood ML, Neuringer LJ. Spoiling of transverse magnetization in steady-state sequences. Magn Reson Med. 1991;21:251–263. doi: 10.1002/mrm.1910210210. [DOI] [PubMed] [Google Scholar]


