Abstract
The thymidylate synthase (TS) gene, which is induced at the G1–S transition in growth-stimulated cells, encodes an enzyme that is essential for DNA replication and cell survival. Here we demonstrate that LSF (LBP-1c, CP2) binds to sites within the TS promoter and intronic regions that are required for this induction. Mutation of the LSF binding sites inhibits G1–S induction of mRNA derived from a TS minigene. Furthermore, expression of dominant-negative LSF (LSFdn) prevents the increase in TS enzyme levels during G1–S, and induces apoptosis in growth- stimulated mouse and human cell lines. Such apoptosis can be prevented either by circumventing the TS requirement through addition of low concentrations of thymidine, or by coexpression of the TS gene driven by a heterologous promoter. Induction of apoptosis by LSFdn parallels the process known as thymineless death, which is induced by the TS inhibitor and chemotherapeutic drug 5-fluorodeoxyuridine. Thus, LSF is a novel regulatory factor that supports progression through S-phase by targeting a single gene that is critical for cell survival.
Keywords: apoptosis/cell cycle progression/G1–S transition/LSF/thymidylate synthase
Introduction
Transcription factors integrate environmental signals and genetic information to control cell cycle progression. As cells reach the restriction point in late G1 phase, the decision is made either to progress to DNA replication or revert to quiescence. If cells continue through the cell cycle, preparation for DNA replication requires changes in the pattern of gene expression, including activation of genes that encode enzymes necessary for deoxynucleotide biosynthesis and DNA replication. While key cell cycle regulators that function at the restriction point, such as the G1 cyclins, have been identified, the identity of transcriptional regulators that link cell growth control to transcriptional regulation at the G1–S transition have not yet been fully elucidated. There are at least two parallel regulatory pathways that drive progression into S-phase, one involving cyclin D–kinase complexes (Matsushime et al., 1992; Xiong et al., 1992; Baldin et al., 1993) and the other involving a cyclin E–kinase complex (Dulic et al., 1992; Koff et al., 1992; Resnitzky et al., 1994; Ohtsubo et al., 1995; Resnitzky and Reed, 1995; Lukas et al., 1997). Until now, the major transcriptional regulator known to function in late G1 is E2F, which is directly targeted by the cyclin D pathway (Johnson, 1995; Nevins et al., 1997; Dyson, 1998). It is likely that there are additional regulatory factors that are critical during the G1–S transition.
The ability of the mammalian transcription factor, LSF, to transactivate a DNA tumor virus promoter (Kim et al., 1987), as does E2F, suggested a potential role for LSF in cell growth control. LSF (Shirra et al., 1994), a 63 kDa protein also known as LBP-1c (Yoon et al., 1994) and CP2 (Lim et al., 1992), stimulates gene expression from the Simian Virus 40 (SV40) major late promoter (Kim et al., 1987; Huang et al., 1990), which is coordinated with the onset of host cell DNA replication (Acheson, 1976). The consensus DNA-binding site for LSF consists of two direct repeats, with a center-to-center spacing of 10 bp corresponding to adjacent turns of the DNA helix (Lim et al., 1993; Yoon et al., 1994; Shirra, 1995). While LSF is primarily dimeric in solution, it binds its DNA site as an obligate tetramer (Murata et al., 1998; Shirra and Hansen, 1998). Furthermore, LSF is ubiquitously expressed in mouse embryos and adult tissues (Swendeman et al., 1994), suggesting a global role for this transcription factor.
We now demonstrate that LSF impacts gene expression at the G1–S transition, through regulation of the gene that encodes thymidylate synthase (TS). TS is an essential enzyme that is responsible for the de novo synthesis of thymidylic acid (Danenberg, 1977), a nucleotide precursor for DNA replication. Inhibition of TS enzyme activity by substrate analogs causes either growth arrest or programmed cell death (Houghton et al., 1994). Regulated expression of TS mRNA requires both promoter and intron sequences within the TS gene (Ash et al., 1993, 1995; Ke et al., 1996). We show that mutation of LSF binding sites in the TS gene inhibits the induction of mRNA from a minimal TS minigene at the G1–S transition. Furthermore, by using dominant-negative LSF (LSFdn) to block endogenous LSF activity, we show that LSF is critical for the S-phase induction of TS enzyme levels. LSFdn expression induces apoptosis in both mouse fibroblast cells and a human prostate cancer cell line, DU145. Using several experimental approaches, we show that this apoptotic phenotype is directly linked to the inhibition of TS expression.
Results
Identification of LSF DNA-binding sites within TS cell cycle regulatory regions
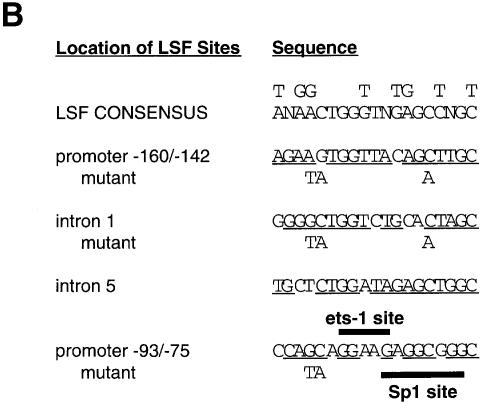
Given the ability of LSF to transactivate the SV40 major late promoter in vitro, we performed a database search for S-phase-regulated genes that contained LSF binding sites. Sequence analysis of the mouse TS gene (Figure 1A), whose mRNA levels increase 10-fold during G1 to S-phase progression in growth-stimulated cells (Jenh et al., 1985), revealed potential LSF binding sites (Figure 1B) in both promoter and intronic cell cycle regulatory regions (inverted triangles, Figure 1A). One site (–93/–75) was located in a region of the promoter that is essential for regulated expression of the gene (Ash et al., 1995) and is highly conserved among mammalian TS genes (Takeishi et al., 1989; Dong et al., 2000).
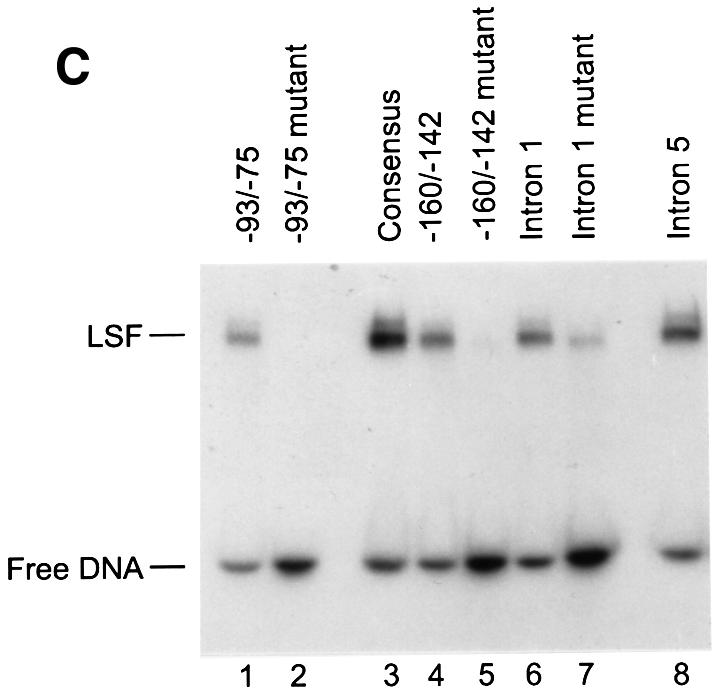
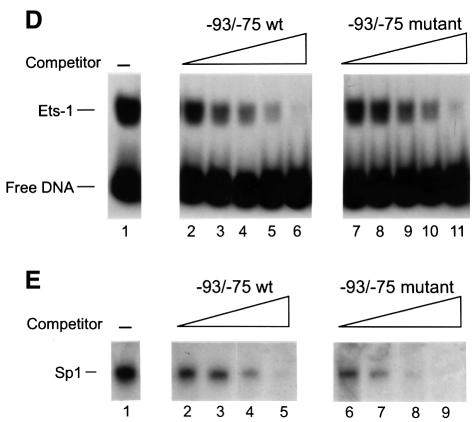
Fig. 1. LSF binds within regulatory regions of the mouse TS gene. (A) LSF sites located in promoter and intron regulatory regions of the mouse TS gene. Inverted triangles represent LSF binding sites; black boxes, coding regions; thick lines, promoter region; thin lines, introns; arrows, the positions of the multiple major transcriptional start sites (Deng et al., 1986); the gray bracket from –92 to –14, transcriptional initiation window; and the black bracket from –104 to –75, the essential promoter region (Geng and Johnson, 1993). Position +1 represents the A residue of the codon for translational initiation. The pTTT DNA probe used for S1 analysis (Ash et al., 1993) is indicated below. This probe extends from the BglII site to the XbaI site in the TS gene and lacks introns. The two BamHI sites mark the endpoints of the small 57 bp deletion in the minigenes that enables differentiation of the endogenous and minigene TS mRNAs in the S1 analysis. (B) Sequences of LSF wild-type binding sites in the mouse TS promoter and intron regulatory regions, and of the mutations generated in these sites. Underlined nucleotides in each site represent bases that match the LSF consensus binding site (Shirra, 1995). The locations of Ets-1 and Sp1 binding sites in the promoter –93/–75 region are indicated. The –160/–142 site is written in an inverted orientation relative to its position in the promoter in order to align the site with the consensus sequence. The base pair substitutions generated to mutate each site are indicated below the respective wild-type sequences. (C) EMSA of recombinant LSF with wild-type and mutant mouse TS sites, and the consensus LSF binding site, as indicated. Binding reactions contained either 400 ng of His-LSF (lanes 1 and 2) or 100 ng of His-LSF (lanes 3–8). (D) Mutant TS essential promoter region retains Ets-1 binding activity. Purified recombinant Ets-1 protein and the radiolabeled wild-type –93/–75 DNA were incubated with increasing amounts of wild-type (lanes 2–6) or mutant (lanes 7–11) competitor oligonucleotides, added at the same time as the radiolabeled DNA. The molar excess of competitor DNA was as follows: lanes 2 and 7, 2-fold; lanes 3 and 8, 5-fold; lanes 4 and 9, 10-fold; lanes 5 and 10, 20-fold; lanes 6 and 11, 50-fold. (E) Mutant TS essential promoter region retains Sp1 binding activity. Recombinant Sp1 and the radiolabeled wild-type –93/–75 DNA were incubated with increasing amounts of either wild-type (lanes 2–5) or mutant (lanes 6–9) competitors. The molar excess of competitor DNA was: lanes 2 and 6, 2-fold; lanes 3 and 7, 5-fold; lanes 4 and 8, 20-fold; lanes 5 and 9, 50-fold.
To test the relevance of LSF for TS expression, we first demonstrated by electrophoretic mobility shift assay (EMSA) that purified recombinant histidine-tagged LSF specifically bound all of the anticipated sites (Figure 1C, lanes 1, 4, 6 and 8). The ability of cellular LSF to bind these sites was confirmed by EMSA with nuclear extracts from mouse 3T6 fibroblasts, and by DNA footprinting analysis with LSF purified from HeLa cells (data not shown).
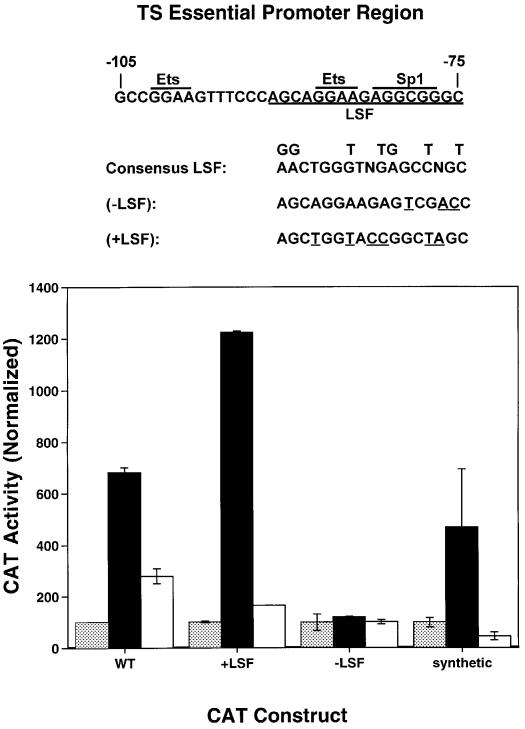
To determine whether LSF could activate transcription from the TS promoter, an LSF expression construct was transiently cotransfected with a CAT reporter gene driven by the TS promoter region, and the level of gene expression assayed (Figure 2). Expression from the wild-type TS promoter increased 7-fold in the presence of LSF (see Figure 2, compare WT gray bar and black bar). The stimulation was similar to that observed with a synthetic promoter that contained four copies of an LSF binding site (synthetic). Expression from a TS promoter with mutations that improved the LSF site in the essential promoter region (+LSF) increased 12-fold in the presence of LSF. However, expression from a TS promoter with mutations that weakened the LSF site (–LSF) was unaltered by the presence of LSF. Thus, we conclude that LSF can stimulate expression from the TS promoter and that this transactivation is substantially mediated by the LSF binding site within the essential region of the promoter.
Fig. 2. Transactivation of the TS promoter by wild-type LSF is inhibited by LSFdn. CAT reporter genes were driven by either the wild-type mouse TS promoter region (from –985 to –11 nt relative to the AUG start codon) (WT), the TS promoter region with an improved LSF binding site (+LSF), the TS promoter region with a weakened LSF binding site (–LSF), or a synthetic promoter consisting of four LSF binding sites upstream of a TATA box (synthetic). The sequences of the TS essential promoter region and of the mutations that were introduced (underlined) are shown at the top of the figure. Note that the mutations in the LSF binding site also affect the downstream Ets and Sp1 binding sites, which overlap the LSF binding site. The CAT reporter genes (0.2 µg) were transiently transfected into hamster V79 cells in the absence of an LSF or LSFdn expression construct (gray bars), in the presence of 0.2 µg of pEF-1α LSF alone (black bars), or in the presence of both 0.2 µg of pEF-1α LSF and 0.3 µg of pEF-1α LSFdn (white bars). The amount of transfected pEF-1α promoter was kept constant by adding appropriate amounts of pEF-1α empty vector to the transfection mixture. Cells were harvested 40–48 h after transfection and CAT activity was determined. CAT activity was normalized to the value observed in cells transfected in the absence of LSF or LSFdn, which was set at 100. The standard deviations obtained from duplicate samples are shown.
LSF DNA-binding sites are required for cell cycle regulation of TS mRNA levels
Due to the ability of LSF to bind cell cycle regulatory regions in the mouse TS gene, and to activate transcription through its binding site in the essential region of the promoter, we tested whether LSF contributed to G1–S stimulation of TS mRNA levels. In both murine and human cells, the coexistence of both the promoter region and an intron is required for normal regulation (Li et al., 1991; Kaneda et al., 1992; Takayanagi et al., 1992; Ash et al., 1993; Ke et al., 1996). In order to focus on contributions from the promoter and to minimize contributing regulatory effects from intron sequences (Ash et al., 1993, 1995; Korb et al., 1993; Ke et al., 1996), we used a minimal TS minigene containing a single internally deleted intron as the parental construct for studies of LSF site mutations. The TS minigene pTI1dT retains S-phase regulation although the fold induction of mRNA at the G1–S transition is reduced from that of the endogenous gene (Ash et al., 1993) (Figure 3A and B, left panels). Point mutations were generated in the –160/ –142 (triple base pair) and the –93/–75 (double base pair) LSF sites, which abolished binding of LSF to these promoter sites (Figure 1C, compare lanes 4 with 5 and 1 with 2). A similar triple base pair mutation of the remaining intron 1 binding site also substantially inhibited binding of LSF to this site in vitro (Figure 1C, compare lanes 6 and 7). The mutation of the –93/–75 site was designed to avoid inactivation of the binding sites for transcription factors Ets and Sp1 (Deng et al., 1989; Jolliff et al., 1991; Geng and Johnson, 1993), which overlapped the LSF site (Figure 1B). To test the relative affinities of these proteins for the wild-type versus mutated –93/–75 sequences, the binding of each of these proteins to the wild-type promoter site was competed in parallel with either the wild-type or the mutated sequence (Figure 1D and E). This type of analysis is the most sensitive in detecting differences in affinities for two different sequences. In contrast to the binding by LSF, the competition curves verified that the introduced point mutations did not prevent the interaction between the –93/–75 TS promoter region and Ets-1 or Sp1. Thus, the only identified factors in nuclear extracts, other than LSF, that bind to the –93/–75 TS promoter region (Ash et al., 1995) were still able to bind the mutated promoter sequences, whereas LSF was not. The situation was more simple at the other sites, as LSF was the only protein detected in nuclear extracts that bound to the –160/–142 site and the intron 1 site (data not shown). Finally, EMSA with nuclear extracts detected no new factors that could bind the mutated LSF sites (data not shown).
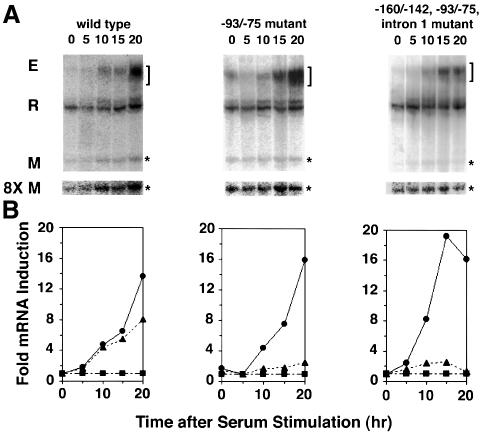
Fig. 3. Mutation of LSF binding sites inhibits G1–S stimulation of TS minigene mRNA levels. (A) Representative S1 analysis of mRNA from endogenous TS and TS minigenes. NIH 3T6 cells were stably transfected with the indicated minigene, and equal amounts of mRNA were analyzed by S1 nuclease protection assays. The number above each lane indicates the time after serum stimulation (in hours) at which mRNA was collected. The R band represents ribosomal protein L32 mRNA and serves as the internal control. The bracket marks the endogenous (E) TS products, which appear as a broad smear due to the protection of the S1 probe into the region of multiple start sites in the TS promoter (Geng and Johnson, 1993). The asterisks mark the minigene (M) products. For visualization purposes, the sections of the autoradiographs containing the TS minigene products were enhanced 8-fold (8× M) and displayed beneath the full-length autoradiographs. (B) Quantitation of the levels of minigene and endogenous TS mRNAs shown in (A). To correct for differences in RNA recovery, TS mRNA levels (E and M) were normalized to those of the control (R). The indicated fold increases were calculated by normalizing to the lowest mRNA levels. Circles represent endogenous TS mRNA levels, triangles represent TS minigene mRNA levels, and squares represent control ribosomal protein L32 mRNA levels.
TS minigenes that contained either the wild-type sequence or mutations in various LSF binding sites were transfected into mouse fibroblasts, and pools of stably transfected colonies were generated. RNA was prepared for S1 analysis from quiescent cells and from cells at various times following growth stimulation (Figure 3). A 57 bp deletion in exon 3 of each minigene enabled differentiation between endogenous (E and circles) and minigene (M and triangles) TS mRNA signals (Ash et al., 1993). In addition, a ribosomal protein mRNA was simultaneously analyzed (R and squares) to control for RNA recovery. The striking result was that simultaneous mutation of all LSF sites in the TS minigene regulatory regions nearly abolished cell cycle regulation (Figure 3A and B, right panels). Furthermore, mutation of only the –93/–75 LSF site in the promoter also dramatically inhibited G1–S activation of TS mRNA levels (Figure 3A and B, middle panels). Initial results (data not shown) also show that the mutation of the LSF binding site in intron 1 alone partially blocks the increase in TS mRNA levels as cells enter S-phase. These findings indicate that, whereas other promoter elements direct basal TS mRNA expression, the LSF binding sites are critical for G1–S-regulated TS mRNA expression in this minimal setting.
Thymidine overcomes apoptosis induced in S-phase by dominant-negative LSF
Because RNA analyses demonstrated that LSF binding sites were essential for the S-phase-specific induction of TS minigene expression, and because TS activity is essential for S-phase progression, the role of LSF in cell survival was investigated more directly. Dominant-negative LSF (LSFdn), a double amino acid substitution mutant of LSF initially named 234QL/236KE, is unable to bind DNA (Shirra et al., 1994). LSFdn also inhibits the DNA-binding activity of comparable levels of wild-type LSF in vitro. Consistent with this observation, LSFdn blocked the ability of LSF to stimulate expression of an LSF-dependent reporter gene in transient transfection experiments, using either human osteosarcoma U2OS cells (data not shown) or hamster V79 cells (Figure 2, synthetic). Furthermore, LSFdn inhibited the expression of a reporter gene driven by the TS promoter (Figure 2, WT), as well as the TS promoter containing an improved LSF binding site (Figure 2, +LSF). This ability of LSFdn to inhibit reporter gene expression was specific for LSF-responsive promoters. When the LSF binding site in the TS essential promoter region was weakened, inhibition by LSFdn was no longer observed (Figure 2, –LSF). Furthermore, expression of other control genes, such as the metallothionein promoter-driven human growth hormone gene, was unaffected by expression of LSFdn (data not shown). Therefore, LSFdn effectively and specifically blocks wild-type LSF function in vivo.
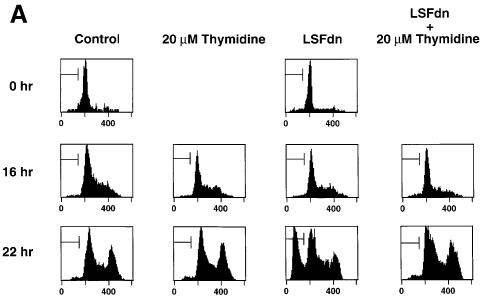
By transient coexpression of LSFdn with a cell-surface marker (CD7) (Frangioni et al., 1994), we tested the effects of LSFdn on cell survival in NIH 3T3 mouse fibroblasts. Growth of the transiently transfected cells was arrested by serum withdrawal. At various time points after serum stimulation, transfected cells (expressing the CD7 surface marker) were analyzed by flow cytometry for their cellular DNA content, which is reflective of progressing stages in the cell cycle. Through the beginning of S-phase (16 h), cells transfected with the LSFdn expression construct progressed through the cell cycle in a similar way to cells transfected with vector alone (Figure 4A, compare columns 3 and 1; Table I, compare lines 3 and 4). This was true even in the presence of 20 µM thymidine (see below). Cell cycle progression was represented by the shift in the G1 peak of cellular DNA (peak observed at 0 h) into the broad region of higher DNA content characteristic of S-phase. Control cells continued to progress normally into G2-phase at 22 h, as shown by the accumulation of the peak at double the G1 level of DNA. In stark contrast, a significant proportion of cells transfected with the LSFdn construct accumulated a sub-G1 DNA content at 22 h. The accumulation of sub-G1 DNA content (30% in this experiment) was accompanied by a corresponding decrease in the fraction of cells in the S- and G2/M-phases of the cell cycle (Table I, compare lines 7 and 8), indicating that LSFdn induces DNA fragmentation at some point during, or immediately following, S-phase of the cell cycle.
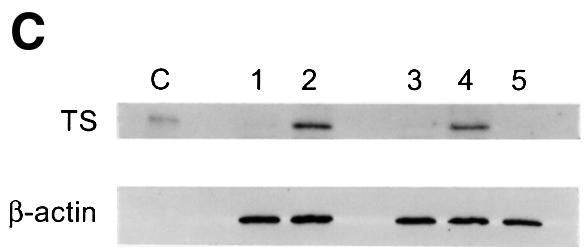
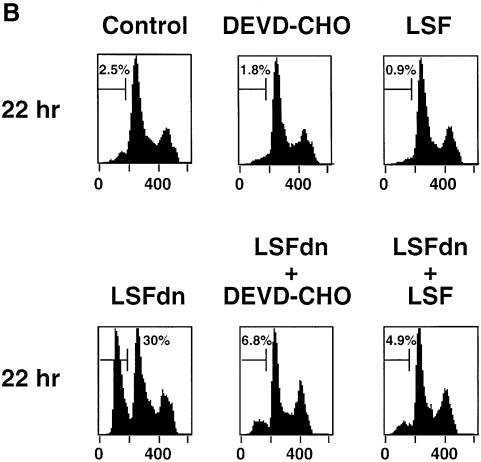
Fig. 4. LSFdn induces apoptosis, which is reversible by thymidine. (A) Flow cytometric analysis of the DNA content in transiently transfected NIH 3T3 cells either expressing LSFdn or not. Cells were transfected and growth arrested, as described in Materials and methods, with 2.5 µg of pMARK7 DNA and 12.5 µg of either pEF-1α or pEF-1α-LSFdn DNA. Cells were subsequently propagated in the absence or presence of 20 µM thymidine, which was added at the time of serum stimulation. The histograms represent relative measurements of DNA content in cells expressing exogenous CD7. The bracket indicates cells that contain less than the G1 DNA content, characteristic of apoptosis. Numbers on the left indicate the time (h) after serum stimulation. The number of cells represented in each histogram, left to right, is as follows. Top row: 623, 1023; middle row: 3618, 2419, 2447, 2201; bottom row: 7417, 13434, 6725, 6701. (B) DNA fragmentation in NIH 3T3 cells transfected by LSFdn is inhibited by a peptide caspase inhibitor and by coexpression of LSF. pEF-1α-LSF (or pEF-1α, in control samples) was cotransfected at a 3:1 ratio with pEF-1α-LSFdn (9.4 µg of pEF-1α-LSF DNA, 3.1 µg of either pEF-1α or pEF-1α-LSFdn DNA, and 2.5 µg pMARK7 DNA), as indicated. CD7-positive cells were analyzed 22 h after serum stimulation. The number of cells represented in each histogram, left to right, is as follows: 13347, 5112, 14500, 19124, 10232, 7572. The numbers above the brackets indicate the percentage of cells with a less than G1 cellular DNA content. (C) Induction of TS protein is reduced in cells transfected with LSFdn, even in the presence of the caspase (CPP32) peptide inhibitor, DEVD-CHO. Cytoplasmic extracts were prepared from CD7-positive cells, sorted by flow cytometry and analyzed by western blotting for TS. The blot was subsequently stripped and re-probed with an antibody against β-actin, as indicated. Lane C contains wild-type mouse recombinant TS (Zhang et al., 1989) used as a size marker. Lane 1, 5 µg of cytoplasmic extract from quiescent NIH 3T3 cells (starved 36 h); lane 2, 5 µg of extract from NIH 3T3 cells undergoing logarithmic growth; lane 3, 5 µg of extract from CD7-positive NIH 3T3 cells 22 h post-stimulation with pEF-1α-LSFdn; lane 4, 5 µg of extract from CD7-positive cells 22 h post-stimulation with pEF-1α; lane 5, identical to lane 3 with the exception that the cells were incubated with 2.0 µM DEVD-CHO from the time of serum stimulation.
Table I. LSFdn-induced apoptosis reduces the percentage of 3T3 cells in S + G2 phases of the cell cycle.
| Samplea | Time (h) | DNA content (range of channel numbers) |
||
|---|---|---|---|---|
| Sub-G1 (0–124) | G1 (125–242) | S ± G2 (243–558) | ||
| Control | 0 | 3.2 | 86 | 10 |
| LSFdn | 0 | 3.5 | 85 | 11 |
| Control | 16 | 0.6 | 55 | 44 |
| LSFdn | 16 | 0.9 | 59 | 40 |
| Control + 20 µM thymidine | 16 | 0.7 | 56 | 43 |
| LSFdn + 20 µM thymidine | 16 | 1.5 | 66 | 33 |
| Control | 22 | 0.8 | 33 | 66 |
| LSFdn | 22 | 30 | 33 | 37 |
| Control + 20 µM thymidine | 22 | 1.0 | 28 | 71 |
| LSFdn + 20 µM thymidine | 22 | 1.3 | 29 | 70 |
aCorresponding to the histograms in Figure 4A.
The cause of the sub-G1 cellular DNA content was tested by treating the cells transfected with the LSFdn construct with the caspase (CPP32) peptide inhibitor, DEVD-CHO (Lazebnik et al., 1994; Nicholson et al., 1995) (Figure 4B). This treatment reduced the percentage of cells with a sub-G1 DNA content at 22 h, demonstrating that expression of LSFdn induced an apoptotic program resulting in fragmentation of cellular DNA. Finally, when LSF was transiently coexpressed with LSFdn, the apoptotic phenotype was also circumvented (Figure 4B), suggesting that the induction of apoptosis was due to specific inhibition of wild-type LSF functions.
To determine whether the apoptotic phenotype induced by LSFdn was related directly to regulation of TS by LSF, we investigated whether apoptosis could be prevented by exogenous thymidine. Through the salvage pathway, thymidine can replenish the cellular thymidine triphosphate pools needed for DNA replication. Strikingly, 20 µM thymidine, added extracellularly, prevented cells transfected with LSFdn from undergoing DNA fragmentation (Figure 4A, column 4; Table I). This low concentration of thymidine, which is sufficient to overcome the cellular requirement for TS activity, did not significantly affect cell cycle progression of control cells (Figure 4A, compare columns 1 and 2; Table I). Induction of apoptosis by LSFdn therefore parallels a process known as thymineless death, which results from inhibition of TS activity and subsequent depletion of thymidine triphosphate pools (Houghton et al., 1994, 1997; Harwood et al., 1996).
To verify that LSFdn is directly regulating TS, the effect of LSFdn on the levels of cellular TS enzyme was measured. Growth-arrested NIH 3T3 cells, starved for 36 h, have extremely low levels of TS protein (Figure 4C, lane 1), as expected based on the 7 h half-life of TS protein (Kitchens et al., 1999). This permitted us to examine G1–S induction of TS gene expression by analysis of TS protein levels. Therefore, NIH 3T3 cells were transfected with either the LSFdn expression construct or the control vector, growth arrested, and stimulated with serum to re-enter the cell cycle. Twenty-two hours after stimulation, transfected cells were sorted on the basis of expression of the CD7 cell-surface marker, to select for cells expressing high levels of LSFdn. Western blotting analysis revealed that TS protein levels in cells expressing high levels of LSFdn remained at the levels observed in quiescent cells (Figure 4C, compare lanes 3 and 1). In contrast, TS protein levels in cells transfected with the control vector (lane 4) were similar to those undergoing logarithmic growth (lane 2). The levels of β-actin remained constant in all cases (Figure 4C). Thus, expression of LSFdn prevented the increase in the level of cellular TS protein during the G1–S transition. To ascertain whether the ability of LSFdn to block induction of TS protein was related to the induction of apoptosis by LSFdn, cells transfected with LSFdn were also treated with the caspase inhibitor DEVD-CHO at the time of serum stimulation. The levels of TS protein in cells transfected with LSFdn, but inhibited from undergoing apoptosis (see Figure 4B), remained at the levels observed in quiescent cells (Figure 4C, compare lanes 1, 3 and 5) or in cells expressing LSFdn but not treated with the apoptotic inhibitor. Thus, the ability of LSFdn to block the induction of TS is a direct effect, independent of the resulting apoptosis.
LSFdn-mediated induction of apoptosis across species is due to inhibition of TS
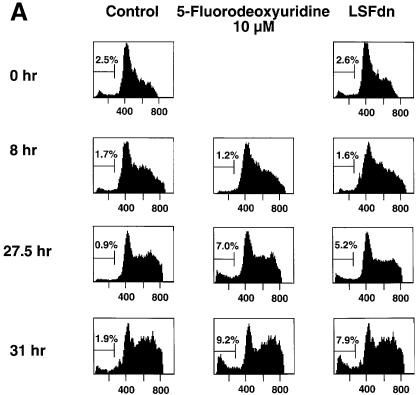
Given the general requirement for TS for growth in all cells, we sought to determine whether LSF played a general role in TS regulation across species. Although the human TS promoter is substantially divergent in sequence from the mouse promoter, the essential region of the mouse TS promoter, which contains the LSF binding site shown to be necessary for proper cell cycle regulation, is conserved in humans (Dong et al., 2000). In order to test the relevance of this LSF site for human TS expression, we utilized the human prostate adenocarcinoma cell line DU145, which has been reported to be growth regulated by serum starvation (Hobeika et al., 1997). In confirmation of such partial synchrony, the majority of these cells had progressed into DNA synthesis by 27.5 and 31 h after serum stimulation of a starved population (Figure 5A, see column 1). Upon transfection with LSFdn (column 3), but not with vector (column 1), a portion of the DU145 cells displayed a sub-G1 DNA content at these two time points. Generation of the sub-G1 DNA content reflected apoptosis, as it was inhibited by incubation of the LSFdn-transfected DU145 cells with the caspase inhibitor DEVD-CHO (data not shown). DU145 cells that were transfected with vector alone but treated at the time of serum stimulation with 10 µM 5-fluorodeoxyuridine, a TS suicide inhibitor, also acquired fragmented DNA (Figure 5A, column 2). In both cases, fragmentation occurred only after cells progressed substantially into S-phase, similar to the phenotype in mouse NIH 3T3 fibroblasts (Table I).
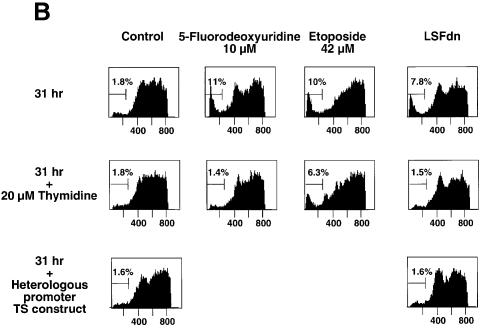
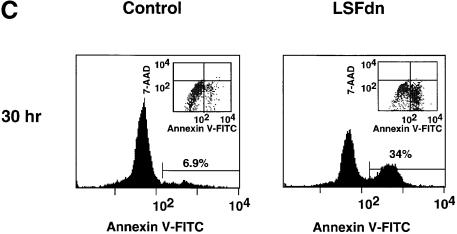
Fig. 5. LSFdn induces apoptosis in human prostate cancer cells by a mechanism dependent on thymidine metabolism. (A) Apoptosis induced by LSFdn in human prostate cancer DU145 cells mimics apoptosis induced by 5-fluorodeoxyuridine. Flow cytometric analysis of the DNA content in transiently transfected DU145 cells at 0, 8, 27.5 and 31 h after serum stimulation. The experiment was conducted as in Figure 4A. Cells were propagated in the absence or presence of 10 µM 5-fluorodeoxyuridine as indicated, added at the time of serum stimulation. The brackets indicate a less than G1 cellular DNA content, characteristic of apoptosis. The numbers above the brackets indicate the percentage of cells fluorescing in this range. The number of cells represented in each histogram, left to right, is as follows. 0 h: 8767, 8819; 8 h: 10614, 15867, 17429; 27.5 h: 19634, 23496, 22584; 31 h: 6598, 12909, 7181. (B) Apoptosis induced by LSFdn in human prostate cancer cells is prevented by the presence of 20 µM thymidine or by the expression of TS driven by a heterologous promoter. The experiment was conducted as in (A), with the DNA content of transiently transfected DU145 cells analyzed by flow cytometry 31 h after serum stimulation. Enzyme inhibitors and thymidine were added at the time of serum stimulation in the indicated concentrations. Where indicated, the TS gene driven by a heterologous promoter was cotransfected with either pEF-1α-LSFdn or pEF-1α DNA (specifically, 2.5 µg of pMARK7 DNA, 9.4 µg of pSTI56T DNA and 3.1 µg of pEF-1α or pEF-1α-LSFdn DNA). The brackets indicate a less than G1 cellular DNA content, characteristic of apoptosis. The numbers above the brackets indicate the percentage of cells that contain less than the G1 DNA content. The number of cells represented in each histogram, left to right, is as follows. Top row: 10729, 10201, 10409, 10822; middle row: 10171, 10737, 10414, 10396; bottom row: 10612, 10629. (C) LSFdn induces apoptosis in human prostate cancer cells as shown by annexin V–FITC binding. The number of cells represented in each histogram and corresponding dot-plot, left to right, is as follows: 11062, 10140. Cells were transfected and growth arrested, as described in Materials and methods, with 2.5 µg of pMARK7 DNA and 12.5 µg of either pEF-1α or pEF-1α-LSFdn DNA. Cells were incubated with annexin V–FITC in a buffer containing 7-AAD and analyzed by flow cytometry. The brackets show levels of fluorescence indicative of annexin V–FITC binding. Many cells transfected with LSFdn were either undergoing apoptosis (annexin V–FITC positive, 7-AAD negative) or had died as a result of apoptosis (annexin V–FITC positive, 7-AAD positive).
As a further verification that this sub-G1 DNA content induced by LSFdn was a result of apoptosis, we tested for the changes in plasma membrane structure that occur early in apoptosis, specifically the translocation of the phospholipid phosphatidylserine from the inner to the outer plasma membrane surface (Martin et al., 1995). Annexin V, a 35–36 kDa Ca2+-dependent phospholipid binding protein with a high affinity for phosphatidylserine (Raynal and Pollard, 1994), will bind to cells with exposed phosphatidylserine (Vermes et al., 1995). The translocation of phosphatidylserine to the outer plasma membrane surface also occurs during necrosis. Therefore, transfected cells expressing a minimal level of the cotransfected CD7 marker were assayed simultaneously for annexin binding and for viability. The viability nucleic acid dye 7-amino- actinomycin (7-AAD) is excluded from living cells and apoptotic cells, but is taken up both by necrotic cells and by cells that have died via apoptosis (Schmid et al., 1992). Thirty hours after serum stimulation, a high proportion of DU145 cells transfected with LSFdn were positive for annexin V binding (34% in this experiment, which represented a 5-fold increase over background annexin V binding detected in cells transfected with an empty vector) (Figure 5C). As graphically represented in the dot-plot insert, nearly all of the cells positive for annexin V binding excluded 7-AAD. These data confirmed that the DU145 cells transfected with LSFdn were truly undergoing apoptosis.
Notably, a greater percentage of cells (up to 18%) transfected with CD7- and LSFdn-expressing plasmids contained fragmented DNA when cells expressing higher levels of transfected DNA were analyzed (by gating the flow cytometer on cells expressing more CD7 cell-surface marker; compare with the 7.8% in Figure 5B, column 4). We conclude that only the cells expressing the highest levels of LSFdn, which might be required to fully inhibit the endogenous LSF pool, were induced into programmed cell death.
Given the similar apoptotic phenotypes obtained upon inhibition of LSF and upon inhibition of TS (Figure 5A), we surmised that LSFdn caused apoptosis in the human cells as it did in the mouse cells, by inhibiting synthesis of TS. To test this hypothesis, the effect of 20 µM thymidine on LSFdn-induced apoptosis in DU145 cells was assessed (Figure 5B). At 31 h after serum stimulation, DU145 cells transfected with LSFdn contained significant sub-G1 DNA levels when grown in the absence of thymidine. In the presence of 20 µM thymidine, however, the sub-G1 DNA levels of LSFdn-transfected cells were within the range observed for control cells transfected with vector. The specificity of prevention of apoptosis by low concentrations of thymidine was investigated by treatment of DU145 cells with either the TS inhibitor 5-fluorodeoxyuridine or the topoisomerase inhibitor etoposide. As with LSFdn-induced apoptosis, apoptosis induced by 5-fluorodeoxyuridine was reduced to control levels by growing cells in 20 µM thymidine. A similar initial percentage of cells with sub-G1 DNA content resulted from treatment with etoposide; however, in this case a significant percentage of apoptotic cells persisted in the presence of thymidine. Thus, low concentrations of thymidine can efficiently block apoptosis if mediated by inhibition of TS activity, presumably by replenishing deoxythymidine triphosphate (dTTP) pools in cells, but it cannot prevent the apoptotic pathway that is induced by other agents leading to DNA damage.
As a final test of whether induction of apoptosis by LSFdn could be attributed solely to the regulation of cellular TS by LSF, we asked whether growth of LSFdn-expressing cells could be rescued by expression of exogenous TS. Cells transfected with an LSFdn expression construct were also transfected with a plasmid in which TS expression was driven by a heterologous promoter. Exogenous TS expression completely inhibited LSFdn-induced apoptosis, with cells containing sub-G1 DNA levels dropping to background levels (Figure 5B). Taken together, these results indicate that the ability of LSFdn to induce DNA fragmentation is a direct consequence of its ability to inhibit TS gene expression, thereby leading to a decrease in dTTP pools, which are required for cellular DNA replication.
Discussion
TS activity is crucial for DNA replication and subsequent cellular proliferation. Inactivation of this enzyme by inhibitors such as 5-fluorodeoxyuridine blocks cell cycle progression and, in a variety of cancer cell lines and solid tumors, leads to thymineless death, a form of apoptosis. As with a variety of enzymes required for nucleotide biosynthesis (e.g. thymidine kinase, dihydrofolate reductase, ribonucleotide reductase) (Bjorklund et al., 1990; Johnson, 1992), TS enzyme and mRNA levels increase as cells prepare to enter S-phase. While cell cycle regulatory regions in the TS gene have been previously defined, the factors controlling this regulation had not been identified. Our following findings argue that LSF is necessary for controlling the cell cycle regulation of TS expression: (i) mutation of LSF binding sites in the TS regulatory regions can abolish growth-dependent regulation of a TS minigene; (ii) expression of a dominant-negative LSF mutant protein can prevent the induction of TS gene expression; and (iii) apoptosis induced by LSFdn is reversible, either by the addition of thymidine to the cell medium or by coexpression of the TS gene driven by a heterologous promoter.
The linking of a mammalian regulatory factor to a single critical target gene is a unique finding. While it is possible that LSFdn may downregulate the expression of other genes during this portion of the cell cycle, apoptosis induced by LSFdn appears to result from inactivation of a single essential gene. Sequence analysis of other S-phase-regulated genes, such as thymidine kinase, dihydrofolate reductase, ribonuclease reductase and cdc6, yielded no putative LSF binding sites in the regulatory regions of these genes. Thus, it appears that LSF is not involved in the regulation of other S-phase genes that are controlled by the E2F transcription factor.
Role of E2F in TS gene regulation
The E2F transcription factor plays an important role in the regulation of a variety of genes that are induced during the G1–S-phase transition, including dihydrofolate reductase, thymidine kinase, ribonucleotide reductase and E2F-1. The role of E2F in regulating TS gene expression is less clear. Overexpression of E2F-1 in rat cells leads to an increase in mRNA for many proteins that are required for DNA replication, including TS mRNA (DeGregori et al., 1995). However, it is unresolved as to whether the increase in TS expression is a direct or indirect effect of E2F overexpression. The mouse TS promoter has a potential E2F element between nucleotides –112 and –105 immediately upstream of the essential promoter region. Deletion or mutation of the E2F element has no effect on TS mRNA accumulation in transient transfection assays (Geng and Johnson, 1993). Furthermore, inactivation of the E2F element does not prevent the S-phase-specific expression of stably transfected TS minigenes, although the magnitude of the increase is somewhat less than that observed with the wild-type TS promoter (Ash et al., 1995). However, the E2F element is required for activation of mouse TS gene expression following cytomegalovirus infection (Gribaudo et al., 2000). Thus, while E2F may regulate TS expression under certain conditions (such as viral infection or E2F overexpression), it appears that E2F does not play an essential role in increasing mouse TS gene expression in growth-stimulated cells. Under these conditions, LSF is more important for TS gene regulation.
Model for induction of apoptosis by LSFdn
Our proposed model for induction of apoptosis by LSFdn involves a process known as thymineless death (Cohen, 1971; Danenberg, 1977), which is the response of cells to deprivation of dTTP (Houghton et al., 1994). Thymineless conditions have been shown to generate DNA damage in the form of single- and double-strand breaks (Barclay et al., 1982). One proposed model for the generation of this DNA damage in cells undergoing thymineless stress is that reduced levels of dTTP result in misincorporation of uracil into DNA in place of thymidine. This misincorporation occurs with a low frequency in cells containing normal levels of dTTP; furthermore, any uracil misincorporated into the DNA is excised rapidly by uracil-DNA-glycosylase, leaving an apyrimidinic site that is subsequently repaired (Goulian et al., 1986). When the ratio of dUTP/dTTP becomes abnormally high following TS inhibition, the repair process becomes saturated, leading to a futile cycle of misincorporation, excision and further rounds of misincorporation, eventually resulting in gaps in the nascent DNA strands (Curtin et al., 1991).
We propose that LSF is required for TS gene expression as a consequence of binding to S-phase regulatory regions in the TS gene. Enhanced LSF activity in late G1 (data not shown) stimulates TS gene expression at the G1–S transition. Enhanced TS protein levels are essential for normal completion of S-phase. When LSFdn is expressed at sufficient levels in cells, it oligomerizes with wild-type LSF, preventing its binding to the TS regulatory regions. Thus, TS gene expression remains at basal levels and is not upregulated at the G1–S transition. This leads to a rapid depletion of dTTP as the cell begins to synthesize DNA, which results in the inhibition of DNA synthesis and subsequent apoptosis. However, if the deoxynucleoside thymidine is supplied in the growth medium and subsequently converted by the salvage enzyme thymidine kinase to deoxythymidylate, the cellular pool of dTTP remains adequate for normal DNA synthesis and cell cycle progression.
Similarity of apoptosis induced by LSFdn and by 5-fluorodeoxyuridine
As might be expected, inhibition of the TS enzyme by small molecules, such as 5-fluorodeoxyuridine, should also result in altered cell cycle progression and induction of apoptosis. In the human prostate cancer cell line DU145, the TS inhibitor and chemotherapeutic agent 5-fluorodeoxyuridine induces apoptosis as cells enter S-phase, which is similar to the kinetics of apoptosis that is caused by expression of LSFdn in these cells. Thus, the biological consequence of blocking the pathway that leads to the production of deoxythymidylate in this cancer cell line is programmed cell death, which can be triggered by inhibiting pre-existing quantities of TS enzyme via a small molecule, or by repressing the production of mRNA encoding for the TS enzyme via expression of a dominant-negative form of a regulatory factor. This raises the possibility that LSF may serve as a potential therapeutic target in the treatment of cancers responsive to TS inhibition.
Taken together, our results suggest that the TS gene is a critical target for LSF in late G1. Previously, LSF DNA-binding activity has been shown to be modulated by phosphorylation (Volker et al., 1997). Thus, it is likely that a protein modification such as phosphorylation may regulate the enhanced LSF activity observed in late G1 (data not shown). Given the timing of LSF activation, it is possible that LSF is a downstream target for one of the G1 cyclin–kinase pathways. LSF may serve as an important regulatory factor in a parallel pathway that is separate from the Rb/E2F pathway. Both of these pathways appear to be essential for progression of cells through S-phase of the cell cycle.
Materials and methods
Cell culture and synchronization
Mouse fibroblast 3T6 cells were maintained in Dulbecco’s modified Eagle’s medium (DMEM) supplemented with 10% calf serum, 2 mM glutamine, 100 U/ml penicillin and 100 µg/ml streptomycin. 3T6 cells were growth arrested by incubation for 7 days in DMEM containing 0.5% calf serum (Ash et al., 1995), and were stimulated to re-enter the cell cycle by the addition of calf serum to 10%. Mouse fibroblast NIH 3T3 cells were maintained in the same culture medium as the 3T6 cells; however, 3T3 cells were synchronized by incubation for 36 h in DMEM containing 0.5% calf serum followed by the addition of calf serum to 10%. Human prostate adenocarcinoma cells (DU145), obtained from American Type Culture Collection (ATCC, Rockville, MD), were maintained in Eagle’s minimal essential medium (EMEM) supplemented with 10% fetal bovine serum (FBS), 0.1 mM non-essential amino acids, 2 mM glutamine, 1 mM sodium pyruvate, 100 U/ml penicillin and 100 µg/ml streptomycin. Partial cell synchronization was achieved by starving DU145 cells in EMEM with 0.5% FBS for 24 h, and re-seeding the cells in EMEM containing 20% FBS.
Preparation of cell extracts and western blotting analyses
For western analysis of TS protein levels, cytoplasmic extracts of 3T3 cells were prepared by lysing 1 × 10⁶ cells in 20 µl of 100 mM Tris–HCl pH 7.2, 0.5% NP-40, 0.2 mM phenylmethylsulfonyl fluoride, 100 µg/ml aprotinin and 100 µg/ml leupeptin (Johnston et al., 1995). Five micrograms of each extract were resolved by SDS–PAGE through a 12% polyacrylamide gel (37.5:1 acrylamide:bisacrylamide), transferred to a nitrocellulose membrane and probed with a TS monoclonal Ab (TS106) (Johnston et al., 1991). The blots were stripped with 62.5 mM Tris pH 6.7, 2% sodium dodecyl sulfate and 100 mM β-mercaptoethanol for 1 h at 50°C, and re-probed with a β-actin monoclonal antibody (clone AC-15) (Sigma).
Electrophoretic mobility shift assays
The indicated amounts of recombinant His-LSF (Volker et al., 1997) were pre-incubated with 0.5 µg of poly d[(I-C)]d[(I-C)] at room temperature for 10 min in 20 mM HEPES pH 7.9, 127 mM KCl, 8 mM Tris pH 8.0, 8% glycerol, 2% polyvinyl alcohol, 0.2 mM EDTA and 0.9 mM dithiothreitol, in a final volume of 15 µl. Subsequently, 12 fmol of the 32P-labeled double-stranded oligonucleotide indicated above each lane were added to each reaction. The reactions were incubated for an additional 15 min. Samples were electrophoresed through a 5% polyacrylamide gel for 1 h at 12 V/cm in buffer containing 44.5 mM Tris base, 44.5 mM boric acid and 1 mM EDTA. For experiments with Sp1, 0.18 ng of human Sp1 (Promega) were added and no poly d[(I-C)]d[(I-C)] was included. For experiments with Ets-1, 1.2 ng of Ets-1 (D N331, which is active for DNA binding) were added, using conditions as described (Petersen et al., 1995).
Minigene mutagenesis, stable transfections and S1 analysis
The pTI1dT minigene, which consists of 1000 bp of the mouse TS promoter and 5′ flanking DNA, all the TS coding exons, a minimal TS intron 1 at its normal location, the TS polyadenylation signal and 3′-flanking region (Ash et al., 1993), all within the pUC18 vector, was the parental construct for the creation of the various LSF binding site mutants by site-directed mutagenesis using the Sculptor™ in vitro mutagenesis system (Amersham). All mutations were verified by dideoxy DNA sequencing of the entire region present during mutagenesis. NIH 3T6 cells were electroporated as described previously (Ash et al., 1995) with 100 µg of minigene DNA, which had been linearized at the ScaI site in the pUC18 vector, and 1 µg of pEF-1α-Neo DNA (Mizushima and Nagata, 1990). After 10 days of selection for G418-resistant clones in medium containing 400 µg/ml G418 sulfate (Gibco-BRL), between 200 and 400 colonies were pooled and grown for the remainder of the experiment as a mass culture. Mass cultures rather than individual clones were used in order to minimize possible artifacts caused by the integration sites of the minigenes. The pooled colonies were starved for 7 days and then stimulated to enter the cell cycle with 20% calf serum as described above.
At various time points following growth stimulation, cellular mRNA was isolated using the following protocol. Cells were washed with ice-cold phosphate-buffered saline (PBS) and scraped from the tissue culture plate. Cell pellets were collected by centrifugation and frozen in liquid nitrogen. mRNA was subsequently prepared from the cell pellets by lysing the cells and digesting proteins in 200 mM Tris pH 7.5, 200 mM NaCl, 1.5 mM MgCl2, 2% SDS and 0.125 mg/ml proteinase K for 60 min at 37°C. The lysate was adjusted to a final concentration of 0.5 M NaCl. DNA was sheared by passing the lysate through a 21 gauge needle four times. A 75 mg oligo(dT)–cellulose tablet (Invitrogen) was added to the lysate and the mRNA was purified per manufacturer’s instructions. S1 analysis was carried out as described previously using double-stranded, end-labeled pTTT and rpL32 DNA probes to analyze TS and ribosomal protein L32 mRNAs, respectively (Ash et al., 1995).
Transient transfection and CAT assays
TS-deficient V79 chinese hamster cells (Geng and Johnson, 1993) (1 × 10⁵) were plated in 35 mm dishes, allowed to attach to the dish overnight, and transiently transfected with 1.3 µg of total DNA using LipofectAMINE™ (Gibco-BRL Life Technologies). At 40–48 h after transfection, cells were harvested and CAT assays were performed using a two-phase extraction/liquid scintillation counter CAT Enzyme Assay System as described by the manufacturer (Promega). The CAT reporter genes were driven by wild-type or mutated versions of the TS promoter region, or by a synthetic promoter that contained four copies of the LSF binding site from the HIV-1 LTR upstream of the E1b TATA box (WT4bCAT) (Yoon et al., 1994).
Transient transfection assays and flow cytometric analysis
Fifteen micrograms of total DNA were transfected per 1 × 10⁶ NIH 3T3 cells or DU145 cells using LipofectAMINE™. The pEF-1α (Mizushima and Nagata, 1990), pEF-1α-LSFdn and/or pEF-1α-LSF plasmids (gifts of E.Drouin) were cotransfected at a 5:1 ratio with pMARK7, the construct encoding a minimal (cytoplasmic domain-deleted) human CD7 cell-surface marker (Frangioni et al., 1994). In the indicated experiments, pSTI56T, which consists of the SV40 early promoter driving the mouse TS coding region containing introns 5 and 6 in their normal locations (Li et al., 1991), was cotransfected at a 3:1 ratio with either pEF-1α or pEF-1α-LSFdn. Twenty-four hours after transfection, cells were starved in 0.5% serum for 36 h (NIH 3T3 cells) or 24 h (DU145 cells), and then stimulated with 10% serum for NIH 3T3 cells, or re-seeded in 20% serum for DU145 cells. Where indicated, thymidine, 2 µM cell-permeable caspase peptide inhibitor DEVD-CHO (Biomol), 10 µM 5-fluorodeoxy uridine (Sigma) or 42 µM etoposide (Sigma) was added at the time of serum stimulation. At each time point, cells were dissociated from the plates with trypsin and washed with PBS containing 1% bovine serum albumin (BSA), the buffer used for subsequent manipulations. Approximately 2 × 10⁶ cells in 100 µl were incubated with 10 µl of fluorescein isothiocyanate (FITC)-conjugated monoclonal anti-human CD7 (Sigma) for 30 min at room temperature. Cells were diluted with buffer, centrifuged at 1000 g for 5 min, washed twice, and fixed in 70% ethanol in PBS at 4°C for 30 min or longer. Following another wash in the absence of BSA, cells were treated with 10 µg/ml RNase A and then stained with 25 µg/ml propidium iodide. Flow cytometric analysis was accomplished by gating on cells of appropriate size and granularity in a forward scatter versus side scatter plot. Transfected cells were selected for analysis of DNA content (as measured by monitoring fluorescence from propidium iodide) by gating on FITC-positive cells at varying levels of FITC staining per cell. For cell sorting experiments, FITC-stained cells were resuspended in PBS and sorted based on a minimal level of FITC staining per cell.
For analysis of annexin V binding as a marker for apoptosis, DU145 cells were stained with R-phycoerythrin-conjugated monoclonal anti-human CD7 (Sigma) for 30 min at room temperature in PBS containing 1% BSA, then washed in PBS, and resuspended in annexin V binding buffer (10 mM HEPES pH 7.4, 140 mM NaCl, 2.5 mM CaCl2). Approximately 8 × 10⁵ cells in 200 µl of annexin V binding buffer were incubated with 10 µl of annexin V–FITC (PharMingen) and 20 µl of Via-Probe™ (PharMingen), a solution of 7-AAD, for 15 min at room temperature. The sample was diluted with 800 µl of annexin V binding buffer and analyzed by flow cytometry within 1 h. Transfected cells were selected for analysis of annexin V binding and viability (exclusion of 7-AAD) by gating on R-phycoerythrin-positive cells.
Acknowledgments
Acknowledgements
We thank G.Cooper for NIH 3T3 cells, C.J.Allegra for TS106 monoclonal antibody and E.Drouin for pEF-1α-LSFdn and pEF-1α-LSF. We also thank J.Volker, W.Kaelin, D.Fisher, P.Hinds, A.Pardee and G.Cooper for helpful discussions. This work was supported through grants from the National Cancer Institute (CA 38038 and CA 81157) and the Sandoz/DFCI Drug Discovery Program to U.H., and from the National Cancer Institute (CA 16058) and the National Institute of General Medical Sciences (GM 29356) to L.F.J. C.M.H.P. was supported in part by a National Science Foundation Graduate Fellowship and in part by an NIH training grant (T32-CA 09361). T.L.R. was supported by an NIH training grant (T32 CA09498).
References
- Acheson N. (1976) Transcription during productive infection with polyoma virus and simian virus 40. Cell, 8, 1–12. [DOI] [PubMed] [Google Scholar]
- Ash J., Ke,Y., Korb,M. and Johnson,L.F. (1993) Introns are essential for growth-regulated expression of the mouse thymidylate synthase gene. Mol. Cell. Biol., 13, 1565–1571. [DOI] [PMC free article] [PubMed] [Google Scholar]
- Ash J., Liao,W.C., Ke,Y. and Johnson,L.F. (1995) Regulation of mouse thymidylate synthase gene expression in growth-stimulated cells: upstream S-phase control elements are indistinguishable from the essential promoter elements. Nucleic Acids Res., 23, 4649–4656. [DOI] [PMC free article] [PubMed] [Google Scholar]
- Baldin V., Lukas,J., Marcote,M.J., Pagano,M. and Draetta,G. (1993) Cyclin D1 is a nuclear protein required for cell cycle progression in G1. Genes Dev., 7, 812–821. [DOI] [PubMed] [Google Scholar]
- Barclay B.J., Kunz,B.A., Little,J.G. and Haynes,R.H. (1982) Genetic and biochemical consequences of thymidylate stress. Can. J. Biochem., 60, 172–184. [DOI] [PubMed] [Google Scholar]
- Bjorklund S., Skog,S., Tribukait,B. and Thelander,L. (1990) S-phase-specific expression of mammalian ribonucleotide reductase R1 and R2 subunit mRNAs. Biochemistry, 29, 5452–5458. [DOI] [PubMed] [Google Scholar]
- Cohen S.S. (1971) On the nature of thymineless death. Ann. N Y Acad. Sci., 186, 292–301. [DOI] [PubMed] [Google Scholar]
- Curtin N.J., Harris,A.L. and Aherne,G.W. (1991) Mechanism of cell death following thymidylate synthase inhibition: 2′-deoxyuridine-5′-triphosphate accumulation, DNA damage and growth inhibition following exposure to CB3717 and dipyridamole. Cancer Res., 51, 2346–2352. [PubMed] [Google Scholar]
- Danenberg P.V. (1977) Thymidylate synthetase—a target enzyme in cancer chemotherapy. Biochim. Biophys. Acta, 473, 73–92. [DOI] [PubMed] [Google Scholar]
- DeGregori J., Kowalik,T. and Nevins,J.R. (1995) Cellular targets for activation by the E2F1 transcription factor include DNA synthesis- and G1/S-regulatory genes [published erratum appears in Mol. Cell. Biol., 15, 5846–5847]. Mol. Cell. Biol., 15, 4215–4224. [DOI] [PMC free article] [PubMed] [Google Scholar]
- Deng T.L., Li,D.W., Jenh,C.H. and Johnson,L.F. (1986) Structure of the gene for mouse thymidylate synthase. Locations of introns and multiple transcriptional start sites. J. Biol. Chem., 261, 16000–16005. [PubMed] [Google Scholar]
- Deng T., Li,Y., Jolliff,K. and Johnson,L.F. (1989) The mouse thymidylate synthase promoter: essential elements are in close proximity to the transcriptional initiation sites. Mol. Cell. Biol., 9, 4079–4082. [DOI] [PMC free article] [PubMed] [Google Scholar]
- Dong S., Lester,L. and Johnson,L.F. (2000) Transcriptional control elements and complex initiation pattern of the TATA-less bidirectional human thymidylate synthase promoter. J. Cell. Biochem., 77, 50–64. [DOI] [PubMed] [Google Scholar]
- Dulic V., Lees,E. and Reed,S.I. (1992) Association of human cyclin E with a periodic G1–S-phase protein kinase. Science, 257, 1958–1961. [DOI] [PubMed] [Google Scholar]
- Dyson N. (1998) The regulation of E2F by pRB-family proteins. Genes Dev., 12, 2245–2262. [DOI] [PubMed] [Google Scholar]
- Frangioni J.V., Moghal,N., Stuart-Tilley,A., Neel,B.G. and Alper,S.L. (1994) The DNA binding domain of retinoic acid receptor β is required for ligand-dependent suppression of proliferation. J. Cell Sci., 107, 827–838. [DOI] [PubMed] [Google Scholar]
- Geng Y. and Johnson,L.F. (1993) Lack of an initiator element is responsible for multiple transcriptional initiation sites of the TATA-less mouse thymidylate synthase promoter. Mol. Cell. Biol., 13, 4894–4903. [DOI] [PMC free article] [PubMed] [Google Scholar]
- Goulian M., Bliele,B.M., Dickey,L.M., Grafstrom,R.H., Ingraham,H.A., Neynaber,S.A., Peterson,M.S. and Tseng,B.Y. (1986) Mechanism of thymineless death. Adv. Exp. Med. Biol., 195, 89–95. [DOI] [PubMed] [Google Scholar]
- Gribaudo G., Riera,L., Lembo,D., De Andrea,M., Gariglio,M., Rudge,T., Johnson,L.F. and Landolfo,S. (2000) Murine cytomegalovirus stimulates cellular thymidylate synthase gene expression in quiescent cells and requires the enzyme for replication. J. Virol., 74, 4979–4987. [DOI] [PMC free article] [PubMed] [Google Scholar]
- Harwood F.G., Frazier,M.W., Krajewski,S., Reed,J.C. and Houghton,J.A. (1996) Acute and delayed apoptosis induced by thymidine deprivation correlates with expression of p53 and p53-regulated genes in colon carcinoma cells. Oncogene, 12, 2057–2067. [PubMed] [Google Scholar]
- Hobeika A.C., Subramaniam,P.S. and Johnson,H.M. (1997) IFNα induces the expression of the cyclin-dependent kinase inhibitor p21 in human prostate cancer cells. Oncogene, 14, 1165–1170. [DOI] [PubMed] [Google Scholar]
- Houghton J.A., Harwood,F.G. and Houghton,P.J. (1994) Cell cycle control processes determine cytostasis or cytotoxicity in thymineless death of colon cancer cells. Cancer Res., 54, 4967–4973. [PubMed] [Google Scholar]
- Houghton J.A., Harwood,F.G. and Tillman,D.M. (1997) Thymineless death in colon carcinoma cells is mediated via fas signaling. Proc. Natl Acad. Sci. USA, 94, 8144–8149. [DOI] [PMC free article] [PubMed] [Google Scholar]
- Huang H.C., Sundseth,R. and Hansen,U. (1990) Transcription factor LSF binds two variant bipartite sites within the SV40 late promoter. Genes Dev., 4, 287–298. [DOI] [PubMed] [Google Scholar]
- Jenh C.H., Geyer,P.K. and Johnson,L.F. (1985) Control of thymidylate synthase mRNA content and gene transcription in an overproducing mouse cell line. Mol. Cell. Biol., 5, 2527–2532. [DOI] [PMC free article] [PubMed] [Google Scholar]
- Johnson D.G. (1995) Regulation of E2F-1 gene expression by p130 (Rb2) and D-type cyclin kinase activity. Oncogene, 11, 1685–1692. [PubMed] [Google Scholar]
- Johnson L.F. (1992) G1 events and the regulation of genes for S-phase enzymes. Curr. Opin. Cell Biol., 4, 149–154. [DOI] [PubMed] [Google Scholar]
- Johnston P.G., Liang,C.M., Henry,S., Chabner,B.A. and Allegra,C.J. (1991) Production and characterization of monoclonal antibodies that localize human thymidylate synthase in the cytoplasm of human cells and tissue. Cancer Res., 51, 6668–6676. [PubMed] [Google Scholar]
- Johnston P.G., Lenz,H.J., Leichman,C.G., Danenberg,K.D., Allegra,C.J., Danenberg,P.V. and Leichman,L. (1995) Thymidylate synthase gene and protein expression correlate and are associated with response to 5-fluorouracil in human colorectal and gastric tumors. Cancer Res., 55, 1407–1412. [PubMed] [Google Scholar]
- Jolliff K., Li,Y. and Johnson,L.F. (1991) Multiple protein–DNA interactions in the TATAA-less mouse thymidylate synthase promoter. Nucleic Acids Res., 19, 2267–2274. [DOI] [PMC free article] [PubMed] [Google Scholar]
- Kaneda S., Horie,N., Takeishi,K., Takayanagi,A., Seno,T. and Ayusawa,D. (1992) Regulatory sequences clustered at the 5′ end of the first intron of the human thymidylate synthase gene function in cooperation with the promoter region. Somat. Cell Mol. Genet., 18, 409–415. [DOI] [PubMed] [Google Scholar]
- Ke Y., Ash,J. and Johnson,L.F. (1996) Splicing signals are required for S-phase regulation of the mouse thymidylate synthase gene. Mol. Cell. Biol., 16, 376–383. [DOI] [PMC free article] [PubMed] [Google Scholar]
- Kim C.H., Heath,C., Bertuch,A. and Hansen,U. (1987) Specific stimulation of simian virus 40 late transcription in vitro by a cellular factor binding the simian virus 40 21-base-pair repeat promoter element. Proc. Natl Acad. Sci. USA, 84, 6025–6029. [DOI] [PMC free article] [PubMed] [Google Scholar]
- Kitchens M.E., Forsthoefel,A.M., Rafique,Z., Spencer,H.T. and Berger,F.G. (1999) Ligand-mediated induction of thymidylate synthase occurs by enzyme stabilization: implications for autoregulation of translation. J. Biol. Chem., 274, 12544–12547. [DOI] [PubMed] [Google Scholar]
- Koff A. et al. (1992) Formation and activation of a cyclin E–cdk2 complex during the G1 phase of the human cell cycle. Science, 257, 1689–1694. [DOI] [PubMed] [Google Scholar]
- Korb M., Ke,Y. and Johnson,L.F. (1993) Stimulation of gene expression by introns: conversion of an inhibitory intron to a stimulatory intron by alteration of the splice donor sequence. Nucleic Acids Res., 21, 5901–5908. [DOI] [PMC free article] [PubMed] [Google Scholar]
- Lazebnik Y.A., Kaufmann,S.H., Desnoyers,S., Poirier,G.G. and Earnshaw,W.C. (1994) Cleavage of poly(ADP-ribose) polymerase by a proteinase with properties like ICE. Nature, 371, 346–347. [DOI] [PubMed] [Google Scholar]
- Li Y., Li,D., Osborn,K. and Johnson,L.F. (1991) The 5′-flanking region of the mouse thymidylate synthase gene is necessary but not sufficient for normal regulation in growth-stimulated cells. Mol. Cell. Biol., 11, 1023–1029. [DOI] [PMC free article] [PubMed] [Google Scholar]
- Lim L.C., Swendeman,S.L. and Sheffery,M. (1992) Molecular cloning of the α-globin transcription factor CP2. Mol. Cell. Biol., 12, 828–835. [DOI] [PMC free article] [PubMed] [Google Scholar]
- Lim L.C., Fang,L., Swendeman,S.L. and Sheffery,M. (1993) Characterization of the molecularly cloned murine α-globin transcription factor CP2. J. Biol. Chem., 268, 18008–18017. [PubMed] [Google Scholar]
- Lukas J., Herzinger,T., Hansen,K., Moroni,M.C., Resnitzky,D., Helin,K., Reed,S.I. and Bartek,J. (1997) Cyclin E-induced S-phase without activation of the pRb/E2F pathway. Genes Dev., 11, 1479–1492. [DOI] [PubMed] [Google Scholar]
- Martin J.S., Reutelingsperger,C.P.M., McGahon,A.J., Rader,J.A., van Shie,R.C.A.A., LaFace,D.M. and Green,D.R. (1995) Early redistribution of plasma membrane phosphatidylserine is a general feature of apoptosis regardless of the initiating stimulus: inhibition by overexpression of Bcl-2 and Abl. J. Exp. Med., 182, 1545–1556. [DOI] [PMC free article] [PubMed] [Google Scholar]
- Matsushime H., Ewen,M.E., Strom,D.K., Kato,J.Y., Hanks,S.K., Roussel,M.F. and Sherr,C.J. (1992) Identification and properties of an atypical catalytic subunit (p34PSK-J3/cdk4) for mammalian D type G1 cyclins. Cell, 71, 323–334. [DOI] [PubMed] [Google Scholar]
- Mizushima S. and Nagata,S. (1990) pEF-BOS, a powerful mammalian expression vector. Nucleic Acids Res., 18, 5322. [DOI] [PMC free article] [PubMed] [Google Scholar]
- Murata T., Nitta,M. and Yasuda,K. (1998) Transcription factor CP2 is essential for lens-specific expression of the chicken αA-crystallin gene. Genes Cells, 3, 443–457. [DOI] [PubMed] [Google Scholar]
- Nevins J.R., Leone,G., DeGregori,J. and Jakoi,L. (1997) Role of the Rb/E2F pathway in cell growth control. J. Cell. Physiol., 173, 233–236. [DOI] [PubMed] [Google Scholar]
- Nicholson D.W. et al. (1995) Identification and inhibition of the ICE/CED-3 protease necessary for mammalian apoptosis. Nature, 376, 37–43. [DOI] [PubMed] [Google Scholar]
- Ohtsubo M., Theodoras,A.M., Schumacher,J., Roberts,J.M. and Pagano,M. (1995) Human cyclin E, a nuclear protein essential for the G1-to-S-phase transition. Mol. Cell. Biol., 15, 2612–2624. [DOI] [PMC free article] [PubMed] [Google Scholar]
- Petersen J.M., Skalicky,J.J., Donaldson,L.W., McIntosh,L.P., Alber,T. and Graves,B.J. (1995) Modulation of transcription factor Ets-1 DNA binding: DNA-induced unfolding of an α helix. Science, 269, 1866–1869. [DOI] [PubMed] [Google Scholar]
- Raynal P. and Pollard,H.B. (1994) Annexins: the problem of assessing the biological role for a gene family of multifunctional calcium and phospholipid-binding proteins. Biochim. Biophys. Acta, 1197, 63–93. [DOI] [PubMed] [Google Scholar]
- Resnitzky D. and Reed,S.I. (1995) Different roles for cyclins D1 and E in regulation of the G1-to-S transition. Mol. Cell. Biol., 15, 3463–3469. [DOI] [PMC free article] [PubMed] [Google Scholar]
- Resnitzky D., Gossen,M., Bujard,H. and Reed,S.I. (1994) Acceleration of the G1/S-phase transition by expression of cyclins D1 and E with an inducible system. Mol. Cell. Biol., 14, 1669–1679. [DOI] [PMC free article] [PubMed] [Google Scholar]
- Schmid I., Krall,W.J., Uittenbogaart,C.H., Braun,J. and Giorgi,J.V. (1992) Dead cell discrimination with 7-amino-actinomycin D in combination with dual color immunofluorescence in single laser flow cytometry. Cytometry, 13, 204–208. [DOI] [PubMed] [Google Scholar]
- Shirra M.K. (1995) Characterization of DNA-Binding and Oligomerization Properties of the Mammalian Transcription Factor LSF. PhD thesis, Harvard University, Boston, MA. [Google Scholar]
- Shirra M.K. and Hansen,U. (1998) LSF and NTF-1 share a conserved DNA recognition motif yet require different oligomerization states to form a stable protein–DNA complex. J. Biol. Chem., 273, 19260–19268. [DOI] [PubMed] [Google Scholar]
- Shirra M.K., Zhu,Q., Huang,H.C., Pallas,D. and Hansen,U. (1994) One exon of the human LSF gene includes conserved regions involved in novel DNA-binding and dimerization motifs. Mol. Cell. Biol., 14, 5076–5087. [DOI] [PMC free article] [PubMed] [Google Scholar]
- Swendeman S.L., Spielholz,C., Jenkins,N.A., Gilbert,D.J., Copeland,N.G. and Sheffery,M. (1994) Characterization of the genomic structure, chromosomal location, promoter and developmental expression of the α-globin transcription factor CP2. J. Biol. Chem., 269, 11663–11671. [PubMed] [Google Scholar]
- Takayanagi A., Kaneda,S., Ayusawa,D. and Seno,T. (1992) Intron 1 and the 5′-flanking region of the human thymidylate synthase gene as a regulatory determinant of growth-dependent expression. Nucleic Acids Res., 20, 4021–4025. [DOI] [PMC free article] [PubMed] [Google Scholar]
- Takeishi K., Kaneda,S., Ayusawa,D., Shimizu,K., Gotoh,O. and Seno,T. (1989) Human thymidylate synthase gene: isolation of phage clones which cover a functionally active gene and structural analysis of the region upstream from the translation initiation codon. J. Biochem., 106, 575–583. [DOI] [PubMed] [Google Scholar]
- Vermes I., Haanen,C., Steffens-Nakken,H. and Reutelingsperger,C. (1995) A novel assay for apoptosis. Flow cytometric detection of phosphatidylserine expression on early apoptotic cells using fluorescein labelled Annexin V. J. Immunol. Methods, 184, 39–51. [DOI] [PubMed] [Google Scholar]
- Volker J.L., Rameh,L.E., Zhu,Q., DeCaprio,J. and Hansen,U. (1997) Mitogenic stimulation of resting T cells causes rapid phosphorylation of the transcription factor LSF and increased DNA-binding activity. Genes Dev., 11, 1435–1446. [DOI] [PubMed] [Google Scholar]
- Xiong Y., Zhang,H. and Beach,D. (1992) D type cyclins associate with multiple protein kinases and the DNA replication and repair factor PCNA. Cell, 71, 505–514. [DOI] [PubMed] [Google Scholar]
- Yoon J.B., Li,G. and Roeder,R.G. (1994) Characterization of a family of related cellular transcription factors which can modulate human immunodeficiency virus type 1 transcription in vitro. Mol. Cell. Biol., 14, 1776–1785. [DOI] [PMC free article] [PubMed] [Google Scholar]
- Zhang H.C., Cisneros,R.J., Dunlap,R.B. and Johnson,L.F. (1989) Efficient synthesis of mouse thymidylate synthase in Escherichia coli. Gene, 84, 487–491. [DOI] [PubMed] [Google Scholar]


