

Abstract
Phosphatidylserine (PS) is an essential constituent of biological membranes and plays critical roles in apoptosis and cell signaling. Because no information was available on transcriptional mechanisms that regulate PS biosynthesis in mammalian cells, we investigated the regulation of expression of the mouse PS synthase-1 (Pss1) gene. The Pss1 core promoter was characterized in vitro and in vivo through gel shift and chromatin immunoprecipitation assays. Transcription factor-binding sites, such as a GC-box cluster that binds Sp1/Sp3/Sp4 and N-Myc, and a degenerate E-box motif that interacts with Tal1 and E47, were identified. Pss1 transactivation was higher in brain of neonatal mice than in other tissues, consistent with brain being a major site of expression of Pss1 mRNA and PSS1 activity. Enzymatic assays revealed that PSS1 activity is enriched in primary cortical astrocytes compared with primary cortical neurons. Site-directed mutagenesis of binding sites within the Pss1 promoter demonstrated that Sp and N-Myc synergistically activate Pss1 expression in astrocytes. Chromatin immunoprecipitation indicated that Sp1, Sp3, and Sp4 interact with a common DNA binding site on the promoter. Reduction in levels of Sp1, Sp3, or N-Myc proteins by RNA interference decreased promoter activity. In addition, disruption of Sp/DNA binding with mithramycin significantly reduced Pss1 expression and PSS1 enzymatic activity, underscoring the essential contribution of Sp factors in regulating PSS1 activity. These studies provide the first analysis of mechanisms that regulate expression of a mammalian Pss gene in brain.
Keywords: Brain, Gene Transcription, Myc, Phosphatidylserine, Sp1
Introduction
Phosphatidylserine (PS)2 is an anionic phospholipid that accounts for 5–11% of phospholipids in mammalian cells (reviewed in Ref. 1). PS contributes to the physical properties of membranes and activates signaling enzymes such as protein kinase C (2), diacylglycerol kinase (3), c-Raf-1 protein kinase (4), and nitric-oxide synthase (5). PS also modulates the binding of some ligands to their receptors (6), and intriguingly, the anionic nature of PS targets positively charged proteins to endocytic/phagosomal membranes (7). In the plasma membrane of mammalian cells PS is normally highly enriched in the cytosolic leaflet but becomes exposed on the cell surface during several crucial physiological processes such as initiation of the blood-clotting cascade (reviewed in Ref. 8), sperm maturation (9), and apoptosis (10).
In higher eukaryotes, PS is synthesized by a calcium-dependent base-exchange reaction in which the head group of an existing phospholipid is exchanged for l-serine (11). Mammalian cells contain two distinct serine exchange enzymes: PS synthase-1 (PSS1) uses phosphatidylcholine, whereas PS synthase-2 (PSS2) uses phosphatidylethanolamine (12). PSS1 and PSS2 are largely absent from the bulk of endoplasmic reticulum membranes but are highly enriched in mitochondria-associated membranes (13), a specialized endoplasmic reticulum domain that facilitates PS import into mitochondria for decarboxylation to phosphatidylethanolamine (14). The importance of PS decarboxylation is underscored by the finding that elimination of PS decarboxylation in mice causes mitochondrial defects and embryonic lethality (15).
Our laboratory has previously demonstrated that although simultaneous elimination of both PSSs in mice is embryonic lethal, Pss1−/− mice and Pss2−/− mice are viable (16–18). Thus, the two PSSs appear to be partially functionally redundant. However, strict conservation of the two Pss genes in mammalian cells implies strong evolutionary pressure. The relative abundance of PSS1 and PSS2 isoforms varies among tissues (16, 19) and during development (20). Thus, expression of the two PSSs might be independently regulated so that PS levels could be differentially modulated in different cells and tissues. Pss1 mRNA and PSS1 activity are particularly high in brain (18, 19) consistent with the high PS content of this tissue (17). PS represents 11.1 and 7.2% of total phospholipids in rabbit cortical glial cells and neurons, respectively (21). PS appears to be important for functioning of the brain and the visual system (reviewed in Ref. 22).
Despite the involvement of PS in many fundamental physiological processes, the mechanisms that regulate the synthesis and degradation of PS in mammalian cells are largely unknown. Early experiments indicated that PS synthesis in brain is regulated by protein kinase C-mediated phosphorylation (23). PS synthesis is also regulated by a feedback mechanism in which PS synthesis declines when PS levels increase (24, 25). Overexpression of PSS2 activity in hepatoma cells failed to stimulate PS biosynthesis (26), whereas overexpression of PSS1 activity increased the rate of PS biosynthesis (27), suggesting that PSS1 is rate-limiting for PS synthesis. Thus, enhanced expression of PSS1 might stimulate PS synthesis in a physiological context. Because no information was available on how expression of either PSS is regulated we investigated the mechanisms by which the Pss1 gene is regulated at the transcriptional level. We show that Pss1 transcription is enhanced in neonatal brain relative to other tissues. Moreover, Pss1 expression and PSS1 activity are higher in astrocytes than in neurons. We also demonstrate in vitro and in intact astrocytes that N-Myc, Sp1, Sp3, Sp4, and Tal1/E47 interact with, and cooperatively transactivate, the murine Pss1 promoter. Moreover, impaired interaction of Sp with the promoter, or reduced levels of Sp1, Sp3, or N-Myc, significantly attenuate Pss1 promoter activity and decrease PSS1 enzymatic activity.
EXPERIMENTAL PROCEDURES
Materials
C3H10T1/2 cells were obtained from the American Type Tissue Culture Collection (Rockville, MD). Tissues were obtained from C57BL/6J mice. Glial cells and neurons were isolated from Sprague-Dawley rats and BALB/c mice. Fetal bovine serum (FBS) and tissue culture medium were from Invitrogen. The luciferase vector, pGL3-Basic (containing cDNA encoding Photinus pyralis), the pSV-β-galactosidase vector, the dual luciferase reporter assay system, and the β-galactosidase assay system were from Promega (Madison, WI). All DNA-modifying enzymes were from Invitrogen. Mithramycin A was from Sigma. [3-3H]Serine was from Amersham Biosciences. The following rabbit polyclonal antibodies were from Santa Cruz Biotechnology (Santa Cruz, CA): anti-Sp1 (sc-14027), anti-Sp3 (sc-644), anti-Sp4 (sc-13019), anti-E47 (sc-763), anti-Tal1 (sc-22809), and anti-C-Myc (sc-764). The mouse monoclonal anti-N-Myc antibody (NMYC1) was from Novus Biologicals (Littleton, CO). Rabbit anti-YY1 was from Active Motif (Carlsbad, CA).
Cell Culture
C3H10T1/2 fibroblasts were cultured in Dulbecco's modified Eagle's medium (DMEM) containing 10% FBS. Cortical glia were isolated from 1-day-old rats or mice (28) and cultured in 75-cm2 flasks (Falcon, BD Biosciences) in DMEM containing 10% FBS. Medium was changed every 3–4 days. After 7–10 days, cells were harvested by treatment with 0.125% trypsin and then replated in DMEM containing 10% heat-inactivated FBS. The glial cultures were highly enriched (>90%) in astrocytes (29). Microglia were isolated from mouse cortical glial cultures by mild trypsinization (30). Cortical neurons from 1-day-old rats were plated (5 × 10⁴ cells/cm2) on dishes coated with poly-d-lysine (Sigma) in Neurobasal A medium (Invitrogen) supplemented with B27 (Invitrogen) and glutamine (Sigma) and used within 3–5 days (31).
Mutation of Pss1 Promoter-Luciferase Reporters
The Pss1 promoter region −1408/+197 bp was isolated by PCR amplification using mouse liver genomic DNA as template and Platinum Pfx DNA polymerase (Invitrogen). Numbering is based on the transcriptional start site (+1) of the Pss1 gene (19). Forward and reverse primers (supplemental Table S1) contained restriction sites for HindIII and SmaI, respectively. Amplified promoter fragments were subjected to restriction digestion with HindIII or SmaI (New England BioLabs), purified from agarose gels using the Qiaex II gel extraction kit (Qiagen Inc., Mississauga, ON, Canada), then directionally ligated into double-digested (HindIII and SmaI) pGL3-Basic plasmid to generate luciferase constructs. Site-directed mutagenesis (supplemental Table S2) was performed using the −398 luciferase plasmid and the QuikChange® mutagenesis kit (Stratagene, La Jolla, CA). Identity of generated plasmids was confirmed by sequencing. C3H10T1/2 cells (2 × 10⁵ cells/12-well plate) and primary astrocytes (8 × 10⁵ cells/6-well plate) were transiently transfected with luciferase-reporter constructs (0.4 μg/cm2) and 0.1 μg/cm2 of pSV-β-galactosidase cDNA using LipofectamineTM 2000 (Invitrogen), then incubated with DNA-Lipofectamine in Opti-MEMI medium without serum for 6 h (for C3H10T1/2 cells) or 90 min (for astrocytes). Unincorporated complexes were removed and cells were incubated in growth medium. After 42–48 h luciferase activity was measured in cell lysates and normalized to β-galactosidase activity for transfection efficiency.
Nuclear Extracts and Electrophoretic Mobility Shift Assays (EMSAs)
Nuclear extracts were isolated from cells (32) and mouse tissues (33). Promoter-derived overlapping oligonucleotides (50–65 bp) were synthesized by the University of Alberta DNA Core Facility. Complementary oligonucleotides (0.5 nmol) containing 5′ overhangs were heated at 70 °C for 10 min in 100 μl of annealing buffer (10 mm Tris-HCl (pH 7.5), 100 mm NaCl, and 1 mm EDTA) then cooled to room temperature. Double-stranded oligonucleotides (10 pmol) were labeled with [α-32P]dCTP by filling end-recessed 3′-ends using Klenow fragment (Invitrogen). Complementary oligonucleotides corresponding to −308/−274- and −272/−251-bp promoter fragments were synthesized and annealed as above. Double-stranded oligonucleotides (5 pmol) were 5′-end labeled using T4 polynucleotide kinase (Invitrogen) and [γ-32P]ATP. All labeled probes were purified on G-25 Sephadex Quick Spin columns (Roche Applied Science). For each EMSA, 2 μg of poly(dI-dC)·poly(dI-dC), 20 μl of 2× binding buffer (20 mm Tris-HCl (pH 7.4), 2 mm MgCl2, 50 mm NaCl, 1 mm EDTA, 10% glycerol, 0.1% Nonidet P-40, 1 mm dithiothreitol), 5–20 μg of nuclear proteins and labeled probe (100,000–150,000 cpm) were incubated (40 μl volume) for 30 min at room temperature. For competitive EMSAs, unlabeled double-stranded oligonucleotides (10–200-fold molar excess relative to probe) were incubated with nuclear extracts for 10 min at room temperature before addition of probe. The wild-type (WT) and mutated (m) and consensus (cs) oligonucleotides were: wtSp1 cs, 5′-ATTCGATCGGGGCGGGGCGAGC-3′; mSp1 cs, 5′-ATTCGATCTCATGGGGGCGAGC-3′; wtMyc-Max cs, 5′-GGAAGCAGACCACGTGGTCTGCTTCC-3′; mMyc-Max cs, 5′-GGAAGCAGACCACGGAGTCTGCTTCC-3′; wtTal1 cs, 5′-ACCTGAACAGATGGTCGGCT-3′; mTal1 cs, 5′-ACCTGAACCGATTGTCGGCT-3′. For supershift assays, antibodies were added 15 min before the labeled probe and reactions were terminated with 8 μl of buffer (30% glycerol, 0.25% bromphenol blue, 0.25% xylene cyanol). Protein-DNA complexes were separated by 5 or 6% nondenaturing polyacrylamide gel electrophoresis in buffer containing 45 mm Tris, 45 mm borate, 1 mm EDTA (pH 8.3) at 4 °C and detected by autoradiography.
Chromatin Immunoprecipitation (ChIP)
Astrocyte growth medium was replaced with phosphate-buffered saline after which 1% formaldehyde was added for 10 min at room temperature followed by a 5-min incubation with 0.125 m glycine. Cross-linked products were washed with cold phosphate-buffered saline, then pelleted and resuspended in lysis buffer (1% SDS, 10 mm EDTA, 50 mm Tris-HCl (pH 8)) supplemented with protease inhibitors (complete Mini, Roche Applied Diagnostics) and 1 mm phenylmethylsulfonyl fluoride. Samples were sonicated on ice (4–5 pulses for 30 s, 40% setting on Sonicator Ultrasonic Processor XL (Misonix Farmingdale, New York)), then lysates were centrifuged at 10,000 × g for 10 min at 4 °C. Supernatants were diluted 5-fold in buffer A (0.1% SDS, 0.1% sodium deoxycholate, 1% Triton X-100, 1 mm EDTA, 0.5 mm EGTA, 140 mm NaCl, 10 mm Tris-HCl (pH 8)) supplemented with protease inhibitors and 1 mm phenylmethylsulfonyl fluoride. The products were used as input samples or aliquots were immunoprecipitated by incubation for 30 min at 4 °C with 2 μg of rabbit IgG (preimmune serum, sc-2027) or primary antibodies. Protein G-Sepharose 4B (Sigma) was incubated for at least 1 h at 4 °C with 1 mg/ml of bovine serum albumin (New England Biolabs) and 0.1 mg/ml of sonicated herring sperm DNA (Sigma), then washed with buffer A and resuspended in buffer A (1:1, v/v). Treated beads, 5 μg of herring sperm DNA, and 10 μg of bovine serum albumin were incubated for 16 h at 4 °C then washed 3 times with buffer A, 3 times with buffer A containing 1 m NaCl, 2 times with buffer containing 0.25 m LiCl, 1% Nonidet P-40, 1% SDS, 1 mm EDTA, 10 mm Tris-HCl (pH 8), and 2 times with 20 mm Tris-HCl (pH 8) + 1 mm EDTA at room temperature for 5 min each. Immune complexes were eluted with 200 μl of 1.5% SDS, then with 150 μl of buffer containing 1% SDS and 0.1 m NaHCO3 for 15 min at room temperature. Eluted fractions were incubated overnight at 65 °C to reverse cross-links, then treated with 50 μg/ml of proteinase K for 1 h at 55 °C. DNA was recovered from complexes by phenol/chloroform extraction with 10 μg of glycogen as carrier. After ethanol precipitation, DNA was resuspended in buffer containing 20 mm Tris-HCl (pH 8) and 1 mm EDTA, then amplified by PCR using Platinum Taq DNA polymerase (Invitrogen). The following primers surrounding the Sp, Myc, and non-canonical E-box binding sites of the mouse Pss1 promoter were used: forward 5′-CCT GCT TCA CAG CGA CCG TGC-3′ and reverse 5′-TCC CCA CAT TAC GGC GGA GTG ACT-3′. A region containing exon 2 and intron 2 of the mouse phosphatidylethanolamine N-methyltransferase (Pemt) gene was amplified with the following primers: forward, 5′-TTG CAG CTG ATC TCT TCG TT-3′; reverse, 5′-TGA CAG GCA TGG TGG GAA-3′ as negative control.
RNA Isolation and qPCR Analysis
Total RNA was isolated with TRIzol (Invitrogen), digested with amplification-grade RNase-free DNase, then RNA (2 μg) was reverse transcribed in a 20-μl volume containing oligo(dT) and Superscript II reverse transcriptase. Platinum SYBR Green qPCR Supermix-UDG (uracil-DNA glycosylase) was used to amplify genes in a Rotor-Gene RG-3000 thermocycler (Corbett Research, Mortlake, Australia). Each sample was analyzed in triplicate. Data from primary rat glial cells and neurons were analyzed using the standard curve method with normalization to cyclophilin A or β-actin. Primers for cyclophilin A were: forward, 5′-TCC AAA GAC AGC AGA AAA CTT TCG-3′; reverse, 5′-TCT TCT TGC TGG TCT TGC CAT TCC-3′. Primers for β-actin were: forward, 5′-ATG TTG CCC TAG ACT TCG AG-3′; reverse, 5′-GAT GCC ACA GGA TTC CAT AC-3′. Primers for rat Pss1 were: forward, 5′-CTT CCT CAT CAT CAG CGT GTT-3′; reverse, 5′-CTG CTT CTC TGG TGG CGT AT-3′. Primers for rat Pss2 were: forward, 5′-TAT CTG GTC CTT CTG CGT CTG-3′; reverse, 5′-TGA GTG TGT GCG GGT CAT AC-3′.
For comparison of Pss1 transcript levels in mouse tissues, triplicate samples were analyzed by real time qPCR. Three reference genes (cyclophilin A, β-actin, hypoxanthine phosphoribosyltransferase-1) were used for normalization using geNorm software. Primers for cyclophilin A and β-actin were as described above; primers used for mouse hypoxanthine phosphoribosyltransferase-1 were: forward, 5′-GTT GGA TAT GCC CTT GAC TA-3′; reverse, 5′-GGC CAC AGG ACT AGA ACA C-3′. Primers for mouse Pss1 were: forward, 5′-GCC TTG TTG ATC CGT AGT TAT-3′; reverse, 5′-CTC CAG AAA CCG GCA AAC GAC-3′.
Immunoblotting
Proteins were boiled at 90–100 °C for 5 min in 62.5 mm Tris-HCl (pH 6.8), 10% glycerol, 2% SDS, and 5% β-mercaptoethanol, then electrophoresed on 10% polyacrylamide gels containing 0.1% SDS and transferred to polyvinylidene difluoride membranes. Membranes were incubated with primary antibodies in 10 mm Tris-HCl (pH 7.4), 100 mm NaCl, 0.1% Tween 20 for 1 h at room temperature, then peroxidase-conjugated secondary antibodies (dilution 1:5,000, Pierce) were added for 1 h at room temperature. Immunoreactive proteins were detected by enhanced chemiluminescence (Pierce). Calnexin was detected with anti-calnexin antibodies (C5C9; Cell Signaling Technology (Pickering, ON)) as loading control.
PS Synthase Activity
Astrocyte lysates were prepared by sonication in 10 mm HEPES buffer (pH 7.5) containing 0.25 m sucrose. Serine-exchange activity was measured (50–100 μg of protein) in the presence of 10 mm calcium chloride, 4 mm hydroxylamine, 25 mm HEPES (pH 7.4), and [3-3H]serine (50 μCi/μmol, 0.4 mm) (26). The assay (200 μl) was performed for 20 min at 37 °C and terminated by addition of chloroform:methanol, 2:1 (v/v). The lower phase was washed 3 times with methanol:water (1:1, v/v) and radioactivity was measured. For competition assays, choline chloride (10 or 50 mm) was included.
RNA Interference
Dicer-substrate siRNAs (DsiRNAs) were from Integrated DNA Technologies (Coralville, IA). For targeting rat N-Myc, the pre-designed TriFECTa kit was used with 3 duplexes (antisense sequences for duplex 1, 5′-UUG AGG UAU UCU UAC AGU ACU UAG GUG-3′; duplex 2, 5′-AUU UAG UUA UGU AUC AGC AUC AUA CUA-3′; duplex 3, 5′-GUG GCA UUU GUG GAA CUU AAG CAC CAU-3′). For targeting rat Sp1, Sp3, and Sp4, two pairs of sense and antisense oligonucleotides/gene were designed using the Integrated DNA Technologies program. Oligonucleotides used for Sp1 were: antisense of duplex 1, 5′-AAA CAG AUU CCC UGG CUG AUG CUC CUA; antisense of duplex 2, 5′-UUC AUA AUU CCC AUG UUG CUG GUG GUG-3′; for Sp3, antisense of duplex 1, 5′-UCC CAU AGA CUU UAC CAC AUC CUG GUA-3′, antisense of duplex 2, 5′-GAU UGG UAC CUC UCC CAC CAC CUU CUU-3′; for Sp4, antisense of duplex 1, 5′-UUG UUG AAA CAU UGG GAG UUG CAG GAU-3′, antisense of duplex 2, 5′-UGG GCG UAG ACA CUA ACU GAU UUC CAU-3′. A scrambled oligonucleotide (5′-AUA CGC GUA UUA UAC GCG AUU AAC GAC-3′; DSscrambled Neg, Integrated DNA Technologies) that did not correspond to sequences in human, mouse, or rat genomes was used as negative control. Primary astrocytes were seeded at 40% confluence (8 × 10⁵ cells/well in 6-well plate) and 24 h later transfected with 10 nm control or 10 nm/pool of specific DsiRNA using OligofectamineTM (Invitrogen) in Opti-MEM I medium. Pss1 mRNA expression was analyzed 3 days later.
Other Methods
Protein content was determined by the BCA method (Pierce) with bovine serum albumin as standard. Statistically significant differences between samples were assessed by the two-tailed Student's t test. p values of <0.05 were considered statistically significant.
RESULTS
Identification of the Minimal Murine Pss1 Promoter
To define the functional promoter responsible for basal expression of the mouse Pss1 gene we cloned regions of the gene −1408/−99 bp upstream of the transcriptional initiation site into the promoterless pGL3-Basic plasmid vector upstream of the luciferase gene. Mouse embryonic fibroblasts (C3H10T1/2 cells) were transfected with either control vector (pGL3-Basic) alone or with the vector containing promoter fragments. Luciferase activity was measured (Fig. 1). Promoter fragments between −1408, −1008, −808, −508, −398, and −309 bp at the 5′ position, and +197 bp at the fixed 3′-position (+110 bp relative to A in the initiation codon) had promoter activities 7–14-fold higher than control vector. However, deletion of 100 bp between −309/−208 bp essentially abolished promoter activity. Moreover, the −99/+197-bp fragment exhibited no detectable activity. Thus, the most active region of the promoter is −309/−208 bp upstream of the transcriptional start site. In an attempt to identify functional cis-elements involved in promotion of Pss1 gene expression, four overlapping oligonucleotides spanning the −356/−150-bp region of the promoter (−356/−302 bp, −308/−250 bp, −260/−198 bp, and −213/−150 bp) were used as probes in electromobility shift assays (EMSAs). A preliminary experiment indicated that all four oligonucleotides bound nuclear proteins from C3H10T1/2 fibroblasts (supplemental Fig. S1). The −308/−250-bp fragment exhibited by far the highest binding.
FIGURE 1.

Promoter activity of Pss1-luciferase chimeras in C3H10T1/2 fibroblasts. 5′-Deletion promoter fragments between the indicated 5′-position and fixed +197-bp 3′-position relative to the transcriptional start site (designated as +1) were cloned into the pGL3-Basic vector (pGL3b(−)) upstream of the luciferase coding region. These DNA fragments were transiently co-transfected into murine C3H10T1/2 fibroblasts with the pSV-β-Gal vector for normalization to β-galactosidase activity. pGL3-Basic vector and the SV40 promoter-containing pGL3 (SV40) were negative and positive controls, respectively. Luciferase activity was measured 48 h after transfection and is expressed relative to β-galactosidase (relative luciferase units, RLU). All data are mean ± S.D. from triplicate measurements in one experiment representative of four independent experiments.
To gain physiologically relevant information regarding Pss1 expression, nuclear proteins from mouse tissues that express high levels of Pss1 transcripts (i.e. brain, kidney, liver, and heart) (18, 19) were examined for interaction with the −356/−150-bp region of the promoter. Nuclear proteins from neonatal brain formed complexes with all four promoter fragments, whereas complexes formed with proteins from liver, heart, and kidney were far less abundant (Fig. 2A). Consistent with these observations, brain showed the highest Pss1 transcript levels among tissues of newborn mice (Fig. 2B). Thus, the Pss1 promoter region between −356/−150 bp contains DNA sequences that bind nuclear proteins, particularly those from neonatal brain.
FIGURE 2.

Transcriptional regulation of Pss1 in brain. A, binding of nuclear proteins from mouse tissues to the −356/−150-bp fragment. Nuclear extracts were isolated from brain (B), liver (L), heart (H), and kidney (K) of neonatal mice. 20 μg of protein were used in EMSAs with 32P-labeled probes: −356/−302 bp, −308/−250 bp, −260/−198 bp, and −213/−150 bp. Protein-DNA complexes (arrows) were resolved by 6% non-denaturing polyacrylamide gel electrophoresis and detected by autoradiography. Lanes indicated by − lacked nuclear extract. Data are representative of three to four independent experiments with similar results. B, Pss1 transcript levels in neonatal mouse tissues were quantified relative to reference genes (cyclophilin A, CypA; β-actin, ActB; phosphoribosyltransferase-1, Hprt1) by real time qPCR and normalized using geNorm software.
Functional cis-Elements in the Pss1 Core Promoter
A computer-based transcription factor binding search program (TRANSFAC data base MatInspector) revealed that the −308/−250-bp region of the promoter contains a GC-box (putative Sp1-response element), an E-box (predicted binding motif for Myc/Hif), and a non-canonical E-box (predicted binding site for E protein and Tal1 transcription factors of the basic helix-loop-helix (bHLH) family; supplemental Fig. S2A). EMSAs with nuclear extracts from fibroblasts showed that the −308/−278-bp fragment interacted only with proteins of the Sp family of transcription factors (supplemental Fig. S2B). Mutation of either the Sp1 or non-canonical E-box elements reduced promoter activity by ∼60 and 45%, respectively (supplemental Fig. S2C) suggesting that both motifs transactivate the Pss1 promoter. Despite the in vitro binding of additional transcription factors, such as AP-2, AML-3, and IK-1, to the −260/−150-bp region according to EMSAs (data not shown), mutation of their corresponding binding sites did not significantly reduce promoter activity (supplemental Fig. S2C).
We also used comparative sequence analysis to identify conserved regulatory elements within the Pss1 gene. Sequences upstream of the transcriptional start site of the mouse, human, and rat Pss1 genes were aligned and several highly conserved sequence blocks were identified in the −398/−208-bp region of the gene (Fig. 3). A conserved Sp1 binding sequence was located close to, and upstream of, a cluster of sites of high homology. Within this region we identified the canonical E-box motif (CACGTG) predicted to mediate interaction with Myc and Hif. Sequence analysis of the promoter also revealed that the highest sequence identities are in a cluster immediately upstream of the non-canonical E-box (CANNTG). This conserved cluster of putative binding sites suggests that the −309/−208-bp sequence is a functional promoter of the mouse Pss1 gene with evolutionarily conserved transcriptional regulatory elements. Compared with other tissues from newborn mice the brain showed the highest binding of nuclear proteins to this fragment (Fig. 2A). Thus, transcriptional regulation of Pss1 expression appears to play a major role in brain. Consistent with this idea, PSS1 activity is highest in brain, in general agreement with the tissue distribution of Pss1 mRNA (19) and PS abundance in brain (17, 18).
FIGURE 3.

Conserved cis-elements in mouse, human, and rat Pss1 promoters. Alignment of the mouse Pss1 promoter (Mm) (−398/−208-bp upstream of transcriptional start site) with human (Hs) and rat (Rn) sequences. Position +1 refers to the transcriptional start site. Nucleotides conserved among species are highlighted in gray. Putative Sp1 binding sites are underlined; E-box elements are boxed.
E47 and Tal1 Bind the Pss1 Promoter in Brain
EMSAs were performed with fragments of the Pss1 promoter as probes and nuclear extracts from tissues of neonatal mice and mouse fibroblasts (Fig. 2A and supplemental Fig. S1). Mutagenesis experiments with nuclear extracts from C3H10T1/2 cells indicated that the −308/−250-bp region of the promoter is the most active (supplemental Fig. S2C). To identify transcription factors that interact with this region, we subdivided this sequence into two shorter oligonucleotides: −308/−274 bp and −272/−251 bp. First, we examined the −272/−251-bp region. The sequence between −262/−257 bp constitutes a degenerate E-box (5′-CAGATG-3′, minus strand) and contains the preferred recognition site (CAG) for E protein family members (class A bHLH factors, including E47) as well as a recognition site (ATG) for Tal1 (34). E47 is a ubiquitously distributed transcription factor that binds DNA as a homodimer. However, in the presence of the tissue-specific factor Tal1, which does not have intrinsic DNA binding capacity, E47 preferentially binds DNA as the Tal1-E47 heterodimer (34, 35). Incubation of neonatal mouse brain nuclear extracts with the −272/−251-bp probe (Fig. 4A) produced an intense protein-DNA complex (Fig. 4B, lane 1) that was abolished by competition with unlabeled probe (Fig. 4B, lane 2) and wild-type Tal1 consensus sequence (Fig. 4B, lane 3). The presence of the irrelevant anti-YY1 antibody did not alter the abundance or mobility of this complex (Fig. 4C, lane 3), whereas antibodies against E47 and/or Tal1 reduced formation of the complex in a dose-dependent manner (Fig. 4C, lanes 4–8). Moreover, a supershift was observed in the presence of anti-E47 antibodies (Fig. 4C, lanes 4, 5, and 8). A similar protein-DNA complex was formed when nuclear extracts from mouse cortical astrocytes were incubated with the −272/−251-bp fragment (Fig. 4D) and anti-E47 or anti-Tal1 antibodies also reduced this complex (Fig. 4D, lanes 3 and 4), whereas anti-YY1 antibodies had no effect (Fig. 4D, lane 5). Thus, in neonatal brain, E47 and Tal1 bind the Pss1 promoter.
FIGURE 4.

Binding of Tal1 and E47 to the mouse promoter. A, nucleotide sequence of the −272/−251-bp fragment showing the putative E47/Tal1 element. The minus strand is indicated by a minus sign. B–D, competition and supershift assays of proteins binding to the promoter were performed using 32P-labeled −272/−251-bp sequence as probe. B, nuclear extracts from brains of 1-day-old mice incubated with: probe alone (lane 1), unlabeled −272/−251-bp fragment (lane 2), or Tal1 consensus (cs) binding sequence (lane 3). Oligonucleotides were added at 100-fold molar excess relative to probe for 10 min before incubation with probe. C, probe alone (lane 1); nuclear extract from brains of 1-day-old mice was incubated with probe (lane 2) or preincubated with anti-YY1 antibody (lane 3), anti-E47 antibody (lanes 4 and 5), anti-Tal1 antibody (lanes 6 and 7), or both antibodies (lane 8), before addition of probe. D, probe alone (lane 1), nuclear extract from mouse primary astrocytes was incubated with probe (lane 2) or preincubated with anti-E47 (lane 3), anti-Tal1 (lane 4), or anti-YY1 (lane 5) antibodies. E, nuclear extracts (20 μg of protein) from brain (B), liver (L), heart (H), and kidney (K) of 1-day-old mice were used. Arrow, E47-Tal1/DNA complex; *, complex (presumably truncated Tal1 with E47) visible only when at least 20 μg of protein were used. F, nuclear extracts from brain (B), liver (L), heart (H), and kidney (K) of newborn mice were immunoblotted with antibodies against E47 and Tal1. Nuclear extract from C3H10T1/2 cells (10T1/2) was used as negative control. Ponceau Red staining indicates similar loading of proteins in each lane. M, molecular mass (kDa). Each experiment was repeated three to five times with similar results.
To determine the tissue specificity of complex formation between E47, Tal1, and the Pss1 promoter we performed EMSAs with nuclear extracts from neonatal mouse brain, liver, heart, and kidney. Nuclear proteins (20 μg/binding reaction) from neonatal brain, but not liver, heart, or kidney, formed a pronounced protein-DNA complex with the −272/−251-bp fragment (Fig. 4E). Nuclear extracts from liver, heart, and brain of 1- to 10-day-old mice reproduced this result (data not shown). Consistent with the ubiquitous tissue distribution of E47 mRNA (36), immunoblotting confirmed that E47 is expressed in mouse brain, liver, kidney, and heart (Fig. 4F). Distinct patterns of E47 isoforms were observed among tissues (Fig. 4F) possibly representing different phosphorylation states of E47 (37–39). However, immunoblotting revealed that Tal1 is expressed in brain but not in liver or heart (Fig. 4F). Tal1 exists as both full-length (42 kDa) and 22-kDa truncated polypeptides (40) both of which bind to class A bHLH proteins (77). The less abundant, but faster migrating, complex formed in the EMSA (asterisk, Fig. 4E) probably contains the smaller Tal1 isoform. The presence of Tal1 in this complex was confirmed by gel shift-Western blot experiments (data not shown). Thus, differential expression and post-translational modification of E47 and Tal1 among tissues might account for the brain-specific recruitment of these factors to the promoter.
N-Myc Binds the −292/−287-bp Motif of the Promoter in Brain
A TRANSFAC analysis of the −308/−274-bp sequence revealed a canonical E-box sequence (5′-CACGTG-3′) at −292/−287 bp that is highly conserved among species (Fig. 3). A Sp1 binding motif was also identified close to this sequence (−300/−295 bp). E-box motifs bind transcription factors of the bHLH/leucine zipper family, including Myc, which binds DNA as a heterodimer with its obligate partner, Max. Max is ubiquitously expressed and is present in excess of Myc (41–43). Thus, availability of endogenous Myc limits its binding to DNA. We determined that Myc binds to the canonical E-box motif within the Pss1 promoter using mouse brain nuclear extracts and the 32P-labeled promoter fragment −308/−274 bp (Fig. 5A). Two DNA-protein complexes were formed (Fig. 5B). Addition of the wild-type Myc-Max consensus oligonucleotide reduced formation of the faster migrating complex (Fig. 5B, lane 4 versus lane 1), whereas the mutated consensus sequence did not (Fig. 5B, lane 5), indicating that Myc binds to this region of the promoter. To establish which Myc protein is involved, we performed supershift assays with antibodies raised against N-Myc and c-Myc. N-Myc is strongly associated with proliferation and differentiation of neuronal progenitor cells (44) and is expressed in several, but not all, mouse tissues including brain after birth (45). In contrast, c-Myc is more widely expressed, primarily in dividing cells (reviewed in Ref. 46). Anti-c-Myc antibodies did not alter mobility of the Myc-DNA complex and resulted in only partial immunodepletion (Fig. 5B, lane 6), whereas anti-N-Myc antibodies supershifted the Myc complex (Fig. 5B, lane 8). Thus, N-Myc, but not c-Myc, binds the −292/−287-bp region of the promoter.
FIGURE 5.

Binding of N-Myc, Sp1, Sp3, and Sp4 to the proximal (−308/−278 bp) promoter. A, nucleotide sequence of probe showing location of Sp1 and N-Myc/Hif1 response elements. Plus and minus strands are indicated ((+) and (−)), respectively. B and C, competition and supershift assays were performed using 32P-labeled −308/−274-bp probe and nuclear extracts (10 μg of protein/reaction) from brains of 3-day-old mice and mouse astrocytes. B, protein-DNA complexes were resolved by 6% native polyacrylamide gel electrophoresis and visualized by autoradiography. Lane 1, probe + nuclear extract; lanes 2–5, nuclear extract preincubated for 10 min prior to addition of probe with consensus (cs) oligonucleotide (wt, wild-type; m, mutated; 200-fold molar excess of unlabeled competitor relative to probe); lanes 6 and 8, nuclear extract preincubated for 20 min with the indicated antibody (ab) prior to addition of probe (supershift); lanes 7 and 9, Sp1 consensus oligonucleotide incubated for 10 min with nuclear extract prior to 20 min incubation with antibodies (competition combined with supershift). Sp-DNA and N-Myc-DNA complexes are indicated by arrowheads. C, protein-DNA complexes were resolved by 5% non-denaturing polyacrylamide gel electrophoresis and visualized by autoradiography. Lanes 1 and 8, probe + nuclear extract; lanes 2-4 and 9–11, nuclear extracts preincubated with anti-Sp antibodies for 20 min prior to addition of probe (supershift); lanes 5–7, consensus E-box oligonucleotide incubated for 10 min with nuclear extract prior to 20 min incubation with the indicated antibodies (competition combined with supershift). D, immunoblot of Sp3 confirming the presence of Sp isoforms (115, 80, and 78 kDa, indicated by arrows) in mouse astrocytes (A) and brain (B). Data are representative of at least three independent experiments with similar results.
Addition of unlabeled Sp1 consensus oligonucleotide containing a canonical Sp1 site completely prevented formation of the slower-migrating complex confirming that Sp binds to this promoter region (Fig. 5B, lane 2), whereas mutated Sp1 consensus oligonucleotide did not alter the binding pattern (Fig. 5B, lane 3). Thus, Sp binds the Sp1 site within the −308/−274-bp fragment. To distinguish further between binding of N-Myc and c-Myc to DNA, supershift assays were performed in the presence of the unlabeled Sp1 consensus sequence to prevent formation of the Sp-containing complex. Anti-N-Myc antibodies essentially eliminated the Myc-containing complex (Fig. 5B, lane 9 versus 2), whereas neither the abundance nor mobility of the Myc-DNA complex was altered by anti-c-Myc antibodies (Fig. 5B, lane 7 versus 2). Thus, Sp and N-Myc bind to the Pss1 promoter.
Sp1, Sp3, and Sp4 Bind to the −300/−295-bp Motif
Sp1, Sp2, and Sp3 are ubiquitously expressed in mammalian cells, whereas in mouse Sp4 is restricted to brain (47). Sp1, Sp3, and Sp4 recognize and bind GC boxes with similar affinity (48). To determine which Sp factor(s) forms a complex with the Pss1 promoter in brain, we performed supershift analyses using the −308/−274-bp fragment as probe with nuclear proteins from neonatal mouse brains. Antibodies directed against Sp1, Sp3, or Sp4 partially supershifted the Sp-DNA complex on native 5% polyacrylamide gels (Fig. 5C, lanes 2–4 versus lane 1). Thus, Sp1, Sp3, and Sp4 form complexes with the −308/−274-bp sequence. Formation of a slowly migrating band (Sp/DNA in Fig. 5C) containing more than one Sp factor might be due to competition of each Sp factor for interaction with the same DNA motif. As previously reported (reviewed in Ref. 49) the mobilities and predicted sizes of Sp1, Sp4, and full-length Sp3 on polyacrylamide gels are similar. Consequently, it is difficult to distinguish among the Sp-DNA complexes by EMSA. The Sp/DNA band likely represents co-migrating complexes, each containing one type of Sp. Sp3 exists as a full-length isoform (115 kDa) and two shorter isoforms (80 and 78 kDa) that are products of alternative translational initiation. The shorter Sp3 isoforms have been reported to repress promoter activity (50). However, gel shift/supershift assays (Sp3/DNA in Fig. 5C) show much weaker in vitro binding of the short, compared with full-length Sp3 isoform although all three isoforms are present in mouse brain and astrocytes (Fig. 5D).
Competition of binding of Sp to the −308/−274 bp fragment with Sp1 consensus oligonucleotide did not prevent formation of Myc-DNA complexes (Fig. 5B, lane 2). Moreover, inhibition of Myc binding with the unlabeled Myc consensus oligonucleotide prevented formation of Myc-DNA complexes but not Sp-DNA complexes (Fig. 5B, lane 4). Thus, Sp and Myc bind independently to the promoter. However, a more slowly migrating ternary complex that contained both Sp and Myc (Fig. 5C, lanes 1 and 8) was detected on a 5% native gel that allowed greater resolution of bands than did the 6% gel (Fig. 5B). These data indicate that Sp and Myc bind in vitro to the same region of the promoter, suggesting that they might act cooperatively.
The ubiquitous expression of Sp1/Sp3 suggests that Sp binding might also regulate Pss1 promoter activity in other tissues. When nuclear extracts from livers and brains of mice between birth and 21 days of age were used in binding reactions with labeled −308/−274 fragment, changes in intensity of Sp-containing complexes correlated positively with changes in endogenous Pss1 levels (supplemental Fig. S3, A and B). In particular, increased binding to this region during aging of the mice paralleled the increase in endogenous Pss1 transcripts in liver (supplemental Fig. S3). Thus, Sp-mediated transactivation of the Pss1 promoter also appears to be functional in tissues other than brain and is likely to be responsible for the ubiquitous expression of Pss1.
Functional Analysis of Sp, Myc, and E47/Tal1 Binding Sites
Because the majority (60–90%) of cells in the brain are not neurons but glial cells (primarily astrocytes), we expected that astrocytes would exhibit the same mode of transcriptional regulation of Pss1 as brain. PSS1 and PSS2 are both present in mouse brain (18, 19). qPCR analysis indicated that the ratio of Pss1/Pss2 mRNA is higher in cortical glia than in cortical neurons (supplemental Fig. S4). We, therefore, compared PSS1 activity in primary cultures of cortical astrocytes and neurons. Serine-exchange activity, as measured in vitro with [3H]serine, reflects the combined activity of PSS1 and PSS2. PSS1 catalyzes the exchange of serine, choline, and ethanolamine with phospholipid in vitro, whereas PSS2 catalyzes the exchange of serine and ethanolamine but not choline (51). We measured PSS1 activity by taking advantage of the observation that choline inhibits the activity of PSS1 but not PSS2. We have previously shown that in brains of adult Pss1−/− mice serine-exchange activity is 62% lower than in Pss1+/+ mice (18). Fig. 6 shows that PSS1 activity (serine-exchange activity inhibited by 50 mm choline (51)) is negligible in primary cortical neurons but accounts for ∼60% of serine-exchange activity in cortical astrocytes. Thus, the majority of PSS1 activity in the brain appears to reside in astrocytes.
FIGURE 6.
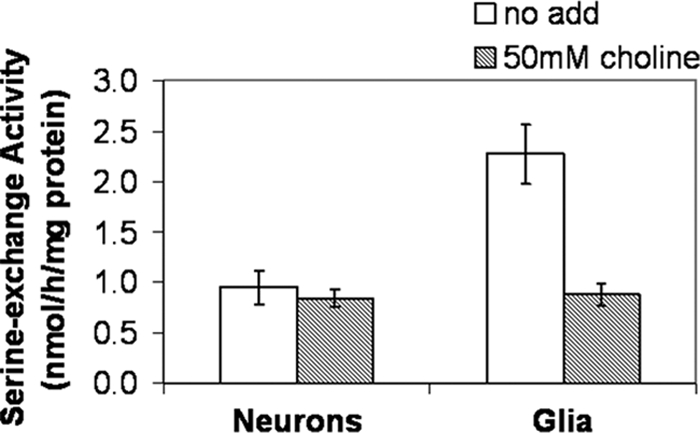
Serine-exchange activity in neurons and astrocytes. Lysates prepared from astrocytes (Glia; 80–95% confluent) and neurons were cultured for 3–4 days. Serine-exchange activity was measured in the absence (no add; white bars; PSS1 + PSS2) and presence (gray bars; PSS2 only) of 50 mm choline. Data are mean ± S.D. of three independent experiments.
EMSAs indicated that DNA binding of nuclear proteins from brains of rats and mice was similar (in both cerebral cortex and whole brain) (supplemental Fig. S5). Nuclear extracts from astrocytes mirrored the in vitro protein-DNA interactions of whole brain; nuclear extracts from microglia reacted only weakly with the Pss1 promoter (not shown). Sp-Myc-DNA complex formation with nuclear extracts from astrocytes paralleled that from brain (Fig. 5C, lane 8 versus 1). Moreover, supershift assays confirmed that Sp1, Sp3, and Sp4 form Sp-DNA complexes with nuclear extracts from both brain (Fig. 5C, lanes 2–7) and astrocytes (Fig. 5C, lanes 9–11). Similarly, the −272/−251-bp fragment displayed an identical binding pattern with nuclear extracts from brain and astrocytes (Fig. 4, C and D). Because transcriptional regulation of Pss1 in astrocytes appeared to recapitulate that in whole brain, we further examined the transcriptional regulation of Pss1 in cortical astrocytes.
To determine the functional importance of the GC-box cluster (adjacent Sp/Myc response elements) and the putative non-canonical E-box for regulation of Pss1 expression, we transfected astrocytes with plasmids carrying wild-type or mutated −398/+197-bp promoter sequences upstream of the luciferase coding sequence. Mutation of either the Sp- or Myc-binding sites reduced promoter activity by 37 and 22%, respectively (Fig. 7); mutation of the non-canonical E-box site reduced promoter activity by 70% (Fig. 7). Mutation of any two of these three binding sites further decreased promoter activity (overall decrease 80–87%) indicating that each element additively enhances Pss1 transcription. Simultaneous mutation of all three binding sites almost completely eliminated promoter activity (Fig. 7) underscoring the essential role of these elements for basal transcription of the Pss1 gene in astrocytes. Concomitant mutation of Sp- and Myc-binding motifs inhibited promoter activity to a greater extent than did the sum of each mutation separately (Fig. 7) suggesting that Sp and Myc synergistically promote Pss1 transcription in astrocytes.
FIGURE 7.

Mutational analysis of Pss1 promoter in astrocytes. Astrocytes were co-transfected with the β-galactosidase expression vector, pSV-β-Gal, or pGL3-Basic (pGL3b(−)), pGL3-Basic containing mouse wild-type −398/+197-bp sequence (WT), or the −398/+197-bp sequence mutated in Sp, Myc, and/or E47/Tal1 elements. Luciferase activity (relative luciferase units, RLU) was measured 48 h after transfection and normalized to β-galactosidase. Data are mean ± S.D. of three independent transfections/construct. Three experiments were performed with similar results. *, p < 0.001; **, p < 0.01; ***, p < 0.02 versus WT.
Chromatin Immunoprecipitation (ChIP) Analysis of Recruitment of Transcription Factors to the Promoter in Astrocytes
The above observations support the idea that N-Myc and Sp act together in a complex that activates the Pss1 promoter through binding to the −300/−287-bp motif. The data also indicate that bHLH factors (Tal1 and E47) activate the −262/−257-bp motif of the promoter. We, therefore, performed ChIP assays on mouse primary astrocytes using antibodies directed against Sp1, Sp3, Sp4, N-Myc, E47, and Tal1 to assess binding of these factors to this region of DNA in intact cells. Primers were selected so that both motifs were amplified (Fig. 8A). Sp1, Sp3, Sp4, N-Myc, E47, and Tal1 bound the −387/−142-bp region of the promoter (Fig. 8B). Binding was validated by the absence of amplification from the −387/−142-bp fragment when irrelevant anti-YY1 antibody was included (Fig. 8B). A genomic region of the phosphatidylethanolamine N-methyltransferase gene, which lacks GC-boxes and E-protein binding motifs according to the TRANSFAC data base, was used as a negative control at the DNA level (ChIP_NegCtrl, Fig. 8B). All three Sp factors bound in situ to the −387/−142-bp fragment (Fig. 8B). However, because ChIP assays cannot discriminate between direct and indirect interaction of proteins with DNA, and because only one Sp binding motif is present within the −387/−142-bp fragment, it is possible that different Sp factors compete for interaction with the promoter. In this case, the data would reflect a pool of Sp1-DNA, Sp3-DNA, and Sp4-DNA complexes formed at the same binding site in vivo.
FIGURE 8.

Functional binding of transcription factors assessed by ChIP. A, schematic representation of the −387/−142-bp region of the promoter (ChIP_387/142Pss1) amplified with primers flanking Sp, Myc, and E47-Tal1 binding sites. B, input sample and immunoprecipitation (IP) product with rabbit preimmune serum (IgG; negative control) or with antibodies against N-Myc, Sp1, Sp3, Sp4, E47, Tal1, or YY1 (a non-relevant antibody) performed on cross-linked chromatin from mouse astrocytes and amplified either with ChIP_F (forward, −385 relative to transcriptional start site) and ChIP_R (reverse, −142 relative to transcriptional start site) primers or with primers amplifying a region of the mouse phosphatidylethanolamine N-methyltransferase gene (ChIP_NegCtrl) as negative control at DNA level. Ld, DNA ladder.
Reduction of Sp Binding by Mithramycin A Inhibits Pss1 Transcription and PSS1 Enzymatic Activity
To assess further the functionality of Sp binding to the Pss1 promoter, rat astrocytes (65–75% confluence) were incubated for 24 h with mithramycin A, a compound that inhibits Sp binding to DNA (52). Pss1 mRNA was quantified relative to cyclophilin A mRNA by qPCR analysis. The level of cyclophilin A mRNA was unaltered by mithramycin, whereas the amount of Pss1 mRNA decreased in a dose-dependent manner (Fig. 9A) supporting the view that binding of Sp to the promoter enhances Pss1 expression. We next determined if inhibition of Sp binding reduced PSS1 enzymatic activity. Addition of 50 mm choline to astrocyte lysates reduced serine-exchange activity by 60% (Figs. 6 and 9B) suggesting that PSS1 accounts for ∼60% of PSS activity in astrocytes. Incubation of astrocytes with mithramycin for 48 or 72 h (Fig. 9, B and C) significantly decreased serine-exchange activity. Thus, consistent with the reduction of Pss1 mRNA by mithramycin (Fig. 9A), PSS1 activity was decreased by mithramycin in a dose-dependent manner after 48 and 72 h (Fig. 9, B and C); essentially all PSS1 activity was eliminated by incubation of astrocytes with 75 nm mithramycin for 72 h (Fig. 9C). The decrease in PSS1 activity in response to mithramycin indicates that Sp factors are indispensable regulators of Pss1 expression and activity in astrocytes.
FIGURE 9.

Mithramycin A reduces endogenous Pss1 transcription and PSS1 activity in astrocytes. Astrocytes from 1-day-old rats were treated with either with vehicle (Veh) or mithramycin A for 24 (A), 48 (B), or 72 h (C). A, Pss1 mRNA was quantified by qPCR relative to cyclophilin A mRNA. B and C, serine-exchange activity was measured in the absence (no add; white bars) and presence of 10 (light gray bars) or 50 mm (dark gray bars) choline. White bars, total serine-exchange activity; gray bars, PSS2 activity. Data are average ± S.D. of three independent experiments. *, p < 0.01; **, p < 0.05 versus vehicle.
RNA Silencing of Sp1, Sp3, or N-Myc Expression Attenuates Pss1 Promoter Activity
To confirm the role of Sp and N-Myc in regulating Pss1 promoter activity we used RNA interference (RNAi) to reduce expression of Sp1, Sp3, Sp4, and N-Myc. Rat primary astrocytes were transfected with 10 nm DsiRNA duplexes. Immunoblotting revealed that 72 h after transfection levels of Sp1, Sp3, and Sp4 proteins were reduced by ∼50, 45, and 35%, respectively, and N-Myc was decreased by >30% (Fig. 10, A and B). To determine whether attenuation of Sp and/or N-Myc reduced promoter activity, astrocytes were transfected with DsiRNAs for 24 h and then transfected for 48 h with plasmids containing the −398/+197-bp fragment upstream of the luciferase gene. Luciferase activity was significantly reduced by DsiRNAs specific for Sp1, Sp3, or N-Myc compared with control DsiRNA, whereas silencing of Sp4 did not reduce luciferase activity (Fig. 10C). Although these reductions are modest (15–30%) they are similar to the reductions caused by mutations of the Sp and Myc sites (25–35% in Fig. 7).
FIGURE 10.

RNA silencing of Sp1, Sp3, or N-Myc reduces promoter activity. Rat astrocytes were transfected with 10 nm DsiRNAs specific for Sp1, Sp3, Sp4, or N-Myc and 24 h later transfected with luciferase reporter plasmids containing the −398/+197-bp fragment. After 48 h, cell lysates were prepared and protein levels were assessed by immunoblotting (A and B) relative to calnexin. C, promoter activity (relative luciferase units, RLU) normalized for transfection efficiency by co-transfection with pSV-β-Gal vector. Data are mean ± S.D. from at least three independent experiments. *, p < 0.01; **, p < 0.02; ***, p < 0.05 versus negative control (non-targeting 27-mer RNA duplex (NegCtrl)).
Based on the homology between the rat and mouse Pss1 promoters (Fig. 3) we anticipated that transcriptional regulation of the rat and mouse promoters would be similar. We, therefore, determined if endogenous rat PSS1 activity was reduced by RNA silencing of N-Myc or Sp1/Sp3 (Fig. 10C). Surprisingly, attenuation of Sp1 expression in rat astrocytes by RNAi increased the amount of Sp3 by 15–35% (Fig. 10A) and, reciprocally, Sp1 protein increased when Sp3 protein was reduced (Fig. 10A). Levels of Sp4 protein were not changed by RNA silencing of Sp1 or Sp3 although levels of Sp1 and Sp3 increased when Sp4 was reduced (Fig. 10A). Despite the compensatory regulation of expression of Sp factors, and the apparent redundancy in their ability to enhance promoter activity (Fig. 10C), PSS1 enzymatic activity decreased slightly, but significantly, when expression of Sp1, Sp3, or N-Myc was attenuated (Fig. 11). All attempts to reduce the expression of multiple Sp factors simultaneously were unsuccessful as the cells did not survive.
FIGURE 11.

RNA silencing of Sp1, Sp3, and N-Myc modestly reduces serine-exchange activity. Rat astrocytes were transfected with DsiRNA duplexes targeting rat Sp1, Sp3, or N-Myc or with non-targeting 27-mer RNA duplex (NegCtrl). After 96 h cell lysates were prepared and serine-exchange activity was measured. White bars (no addition), total PSS activity; gray bars (+50 mm choline), PSS2 activity. Data are mean ± S.D. of triplicate analyses from one of three experiments with similar results. *, p < 0.05 versus NegCtrl.
DISCUSSION
The brain is a major site of expression of Pss1 mRNA and PSS1 activity (18, 19). We report that PSS1 activity is higher in primary astrocytes than in primary neurons, and that the ratio of Pss1/Pss2 mRNA in astrocytes is approximately double that in neurons. Nevertheless, we cannot eliminate the possibility that Pss1 expression and phospholipid metabolism in isolated neurons and astrocytes do not recapitulate the situation in the brain in vivo. Furthermore, we performed studies only with cortical neurons and cortical astrocytes that might not be representative of other types of neurons and glial cells in the brain.
We have characterized a transcriptional network that regulates Pss1 expression. Sp and Myc enhance Pss1 expression in neonatal brain. Moreover, EMSAs and ChIP analyses revealed that protein-DNA complexes were formed with the −309/−208-bp promoter region that contained binding sites for these factors. Mutation of the corresponding DNA-binding sequences, or RNA silencing of N-Myc or Sp, decreased promoter activity in astrocytes. Furthermore, inhibition of Sp binding to the promoter by mithramycin reduced Pss1 mRNA and PSS1 enzymatic activity.
It is well established that mammalian phospholipid synthesis is transcriptionally regulated (reviewed in Ref. 53). The majority of research has focused on CTP:phosphocholine cytidylyltransferase-α, which catalyzes the rate-limiting step of phosphatidylcholine synthesis via the CDP-choline pathway. CTP:phosphocholine cytidylyltransferase-α gene expression is regulated during the cell cycle by Sp1, retinoblastoma protein, and E2F (54–57). Moreover, Tef-4, Ets-1, and Net regulate CTP:phosphocholine cytidylyltransferase-α transcription during cell proliferation and embryogenesis (58–60). Transcription of choline kinase, the first enzyme of the CDP-choline pathway, is enhanced by a distal activating protein-1 element upon binding of c-Jun (61). Recently, transcriptional regulation of two additional phospholipid biosynthetic genes was explored: phosphatidylethanolamine N-methyltransferase, which methylates phosphatidylethanolamine to generate phosphatidylcholine, and CTP:phosphoethanolamine cytidylyltransferase, which catalyzes the rate-limiting step of phosphatidylethanolamine synthesis via the CDP-ethanolamine pathway. Interestingly, both genes are negatively regulated by Sp1 during cell differentiation (62, 63). The present studies identify PSS1 as another phospholipid biosynthetic activity that is transcriptionally regulated.
Sp and N-Myc Interact with, and Activate, the Pss1 Promoter in Astrocytes
Our experiments reveal a key role for a Sp-binding site (−300/−294 bp), an E-box motif (−292/−287 bp), and a non-canonical E-box motif (−262/−257 bp) in enhancing Pss1 transcription. We show that N-Myc and Sp bind the −300/−287-bp motif of the promoter and positively regulate Pss1 expression in brain and astrocytes. Sp and Myc are known to regulate cell cycle progression and differentiation (64, 65). Consistent with EMSAs and ChIP analyses demonstrating that N-Myc binds the −292/−287-bp motif, RNA silencing of N-Myc in astrocytes decreased promoter activity and PSS1 enzymatic activity. Thus, N-Myc appears to be a potent regulator of Pss1 expression in brain. Functionally, c-Myc and N-Myc are key regulators of cell proliferation, differentiation, and apoptosis (66–69). Alteration of their levels is thought to contribute to tumor formation. The frequently observed activation of c-Myc in tumors is consistent with expression of the gene in most embryonic and neonatal organs (45). In contrast, N-Myc has a more restricted expression with the highest levels in developing brain and >20-fold lower expression in other newborn tissues (45). Conditional inactivation of N-Myc in mice impairs regulation of neuronal progenitor cell proliferation, differentiation, and nuclear size (44). Our supershift assays demonstrate that N-Myc, rather than c-Myc, enhances Pss1 expression in the brain.
EMSAs also revealed a slowly migrating DNA-protein complex that contained Sp1, Sp3, and Sp4. We propose that this product contains co-migrating complexes of individual Sp factors with promoter elements. This speculation is based on ChiP assays in which the amplified promoter region contained only one Sp-binding site, yet demonstrated that the three Sp proteins associate in vivo with the promoter. Moreover, treatment of astrocytes with mithramycin A, an inhibitor of Sp/DNA binding, markedly reduced Pss1 transcript levels, and sustained mithramycin treatment reduced PSS1 activity, supporting the involvement of Sp in transactivation of the promoter. On the other hand, when levels of Sp1 or Sp3 in astrocytes were attenuated by RNA silencing, PSS1 enzymatic activity was only modestly reduced, most likely because of the compensatory increase in Sp1 that occurred upon reduction in Sp3, and vice versa. Thus, Sp1 and Sp3 appear to be functionally redundant in regulating Pss1 expression. Knockdown of either Sp1 or Sp3 reduced promoter activity indicating that both Sp factors increase Pss1 expression. Although decreased expression of Sp4 did not reduce promoter activity, we cannot rule out the possibility that the compensatory increase in Sp1/Sp3 masks a role for Sp4 in regulating Pss1 expression.
Sp1 and Sp3 have similar structures and their DNA binding domains are highly homologous. In vitro and in vivo studies have shown that Sp1 and Sp3 can either enhance or repress promoter activity depending on the promoter and cellular context (reviewed in Ref. 70). Although Sp1 and Sp3 are each required during mouse development (71, 72), our data imply redundancy in their ability to activate the Pss1 promoter. Because interaction of transcription factors with DNA is a highly dynamic process, each Sp might concurrently bind to the Pss1 promoter depending on Sp availability. The apparent redundancy of Sp factors in regulating Pss1 promoter activity via the same binding motif is consistent with the ubiquitous expression of Pss1 (19). Several reports indicate that activity of some promoters is regulated by the ratio of Sp1/Sp3, which could vary among cell types and during differentiation (73–75). Our data indicate, however, that the total amount of Sp1 + Sp3, rather than the ratio of Sp1/Sp3, regulates Pss1 promoter activity. Post-translational modification of Sp factors, such as phosphorylation, is also likely to modulate Pss1 expression.
Sp and N-Myc Cooperatively Activate the Pss1 Promoter
The EMSAs indicate that in astrocytes Sp and N-Myc form a ternary complex with DNA. Simultaneous mutation of the Sp-binding sequence and the E-box motif reduced Pss1 transcriptional activity to a greater extent than did the sum of each mutation individually, suggesting that these two factors cooperatively activate the promoter. ChIP experiments also show that both Sp and Myc bind to the Pss1 promoter in vivo. Evolutionary conservation of the Sp binding site upstream of the E-box motif in mouse, rat, and human Pss1 promoters also indicates a role for these sites in regulating Pss1 expression. Cooperative interaction between Sp and Myc has been reported previously. For example, Sp1 cooperates with c-Myc in transactivating the human telomerase reverse transcriptase gene (76), and synergistic regulation of expression of proliferation-associated human genes by Sp1 and c-Myc has been reported (77). Moreover, physical association between Sp1/Sp3 and c-Myc was observed, and interaction of c-Myc with the Sp1 DNA-binding domain was proposed to titrate Sp1 from the p21 promoter and represses transcription (78). Our data demonstrate that neither Sp availability nor a functional Sp-binding site is required for N-Myc binding to the promoter. We show that Sp binds to the promoter independently of Myc or a functional E-box. Thus, it seems unlikely that interaction between Sp and N-Myc is required for their binding to Pss1 DNA or for promoter activation. In tissues such as brain, where N-Myc is expressed, concomitant binding of both transcription factors would be expected to enhance Pss1 expression; accordingly, brain is the major site of Pss1 expression in newborn mice. Sp-mediated transactivation of Pss1 appears to operate in most cell types. Although in newborn mice Pss1 is much more highly expressed in brain than liver, Pss1 transcript levels increase markedly in liver between birth and adulthood, in parallel with significantly increased formation of complexes between nuclear proteins and the −308/−274-bp region of the promoter.
Brain-specific Interaction of E47/Tal1 with the Promoter
EMSAs revealed that E47 and Tal1 form a protein-DNA complex with the Pss1 promoter. Mutation of the corresponding DNA binding site decreased Pss1 promoter activity by 70% in astrocytes suggesting that this motif has the potential to transactivate Pss1. The E47/Tal1-containing complex was detected in brain but not in liver, heart, or kidney. Phosphorylation of E47 inhibits binding of E47 homodimers to DNA in vitro (38). In addition, casein kinase CKII positively regulates myogenesis by preventing E protein homodimers from binding to gene regulatory elements (37). In contrast, phosphorylation of E47 by p38 MAPK is required for formation of MyoD/E47 heterodimers and activation of muscle-specific transcription, because homodimers of neither E47 nor MyoD bind gene targets in muscle (39). Thus, the distinct tissue-specific phosphorylation of E47 that we observed, as well as the greater abundance of phosphorylated E47 isoforms in brain, might explain why E47 heterodimers bind the Pss1 promoter in brain but not other tissues. Because E47 binds the promoter as a heterodimer with Tal1, it is likely that Tal1 availability determines DNA binding. Tal1 homodimers bind DNA poorly (79), whereas Tal1 forms heterodimers with class A bHLH members such as E47 for binding to E-boxes with high affinity (79). The tissue-restricted expression of Tal1 plays a pivotal role in development of the endothelium and hematopoietic cells (80). Tal1 is also present in adult, post-mitotic neurons (81) and determines the specification of astrocytes in a restricted region of the neural tube (82). In the present study, we demonstrate that Tal1 interacts with the Pss1 promoter in brain. Nevertheless, future studies are required to elucidate the precise role of interaction of E47/Tal1 with the Pss1 promoter and in regulating Pss1 transcription in brain.
In conclusion, Pss1 expression in the brain is enhanced by N-Myc and Sp1/Sp3. Further characterization of mechanisms that regulate Pss1 expression, and comparison with mechanisms that regulate Pss2 expression, are likely to shed light on why two PS synthase genes have been evolutionarily conserved in mammals.
Supplementary Material
Acknowledgments
We thank Randy Nelson for advice on designing oligonucleotides and Russ Watts for technical assistance.
This work was supported by the Canadian Institutes for Health Research.

The on-line version of this article (available at http://www.jbc.org) contains supplemental Tables S1 and S2 and Figs. S1–S5.
- PS
- phosphatidylserine
- bHLH
- basic helix loop helix
- PSS
- phosphatidylserine synthase
- DsiRNA
- dicer-substrate siRNA.
REFERENCES
- 1. Vance J. E., Steenbergen R. (2005) Prog. Lipid Res. 44, 207–234 [DOI] [PubMed] [Google Scholar]
- 2. Nishizuka Y. (1992) Science 258, 607–614 [DOI] [PubMed] [Google Scholar]
- 3. Abe T., Lu X., Jiang Y., Boccone C. E., Qian S., Vattem K. M., Wek R. C., Walsh J. P. (2003) Biochem. J. 375, 673–680 [DOI] [PMC free article] [PubMed] [Google Scholar]
- 4. Ghosh S., Xie W. Q., Quest A. F., Mabrouk G. M., Strum J. C., Bell R. M. (1994) J. Biol. Chem. 269, 10000–10007 [PubMed] [Google Scholar]
- 5. DiNapoli M. R., Calderon C. L., Lopez D. M. (1997) J. Immunol. 158, 1810–1817 [PubMed] [Google Scholar]
- 6. Gagné J., Giguère C., Tocco G., Ohayon M., Thompson R. F., Baudry M., Massicotte G. (1996) Brain Res. 740, 337–345 [DOI] [PubMed] [Google Scholar]
- 7. Yeung T., Heit B., Dubuisson J. F., Fairn G. D., Chiu B., Inman R., Kapus A., Swanson M., Grinstein S. (2009) J. Cell Biol. 185, 917–928 [DOI] [PMC free article] [PubMed] [Google Scholar]
- 8. Zwaal R. F., Comfurius P., Bevers E. M. (2004) Biochim. Biophys. Acta 1636, 119–128 [DOI] [PubMed] [Google Scholar]
- 9. Gadella B. M., Harrison R. A. (2000) Development 127, 2407–2420 [DOI] [PubMed] [Google Scholar]
- 10. Fadok V. A., Voelker D. R., Campbell P. A., Cohen J. J., Bratton D. L., Henson P. M. (1992) J. Immunol. 148, 2207–2216 [PubMed] [Google Scholar]
- 11. Hübscher H. G., Dils R. R., Pover W. F. (1959) Biochim. Biophys. Acta 36, 518–528 [DOI] [PubMed] [Google Scholar]
- 12. Kuge O., Nishijima M., Akamatsu Y. (1991) J. Biol. Chem. 266, 24184–24189 [PubMed] [Google Scholar]
- 13. Stone S. J., Vance J. E. (2000) J. Biol. Chem. 275, 34534–34540 [DOI] [PubMed] [Google Scholar]
- 14. Vance J. E. (1990) J. Biol. Chem. 265, 7248–7256 [PubMed] [Google Scholar]
- 15. Steenbergen R., Nanowski T. S., Beigneux A., Kulinski A., Young S. G., Vance J. E. (2005) J. Biol. Chem. 280, 40032–40040 [DOI] [PMC free article] [PubMed] [Google Scholar]
- 16. Bergo M. O., Gavino B. J., Steenbergen R., Sturbois B., Parlow A. F., Sanan D. A., Skarnes W. C., Vance J. E., Young S. G. (2002) J. Biol. Chem. 277, 47701–47708 [DOI] [PubMed] [Google Scholar]
- 17. Steenbergen R., Nanowski T. S., Nelson R., Young S. G., Vance J. E. (2006) Biochim. Biophys. Acta 1761, 313–323 [DOI] [PubMed] [Google Scholar]
- 18. Arikketh D., Nelson R., Vance J. E. (2008) J. Biol. Chem. 283, 12888–12897 [DOI] [PubMed] [Google Scholar]
- 19. Sturbois-Balcerzak B., Stone S. J., Sreenivas A., Vance J. E. (2001) J. Biol. Chem. 276, 8205–8212 [DOI] [PubMed] [Google Scholar]
- 20. Mozzi R., Buratta S., Goracci G. (2003) Neurochem. Res. 28, 195–214 [DOI] [PubMed] [Google Scholar]
- 21. Goracci G., Francescangeli E., Mozzi R., Woelk H., Porcellati G. (1976) Adv. Exp. Med. Biol. 72, 123–129 [DOI] [PubMed] [Google Scholar]
- 22. Salem N., Jr., Litman B., Kim H. Y., Gawrisch K. (2001) Lipids 36, 945–959 [DOI] [PubMed] [Google Scholar]
- 23. Kanfer J. N., McCartney D., Hattori H. (1988) FEBS Lett. 240, 101–104 [DOI] [PubMed] [Google Scholar]
- 24. Nishijima M., Kuge O., Akamatsu Y. (1986) J. Biol. Chem. 261, 5784–5789 [PubMed] [Google Scholar]
- 25. Kuge O., Hasegawa K., Saito K., Nishijima M. (1998) Proc. Natl. Acad. Sci. U.S.A. 95, 4199–4203 [DOI] [PMC free article] [PubMed] [Google Scholar]
- 26. Stone S. J., Vance J. E. (1999) Biochem. J. 342, 57–64 [PMC free article] [PubMed] [Google Scholar]
- 27. Stone S. J., Cui Z., Vance J. E. (1998) J. Biol. Chem. 273, 7293–7302 [DOI] [PubMed] [Google Scholar]
- 28. Gong J. S., Kobayashi M., Hayashi H., Zou K., Sawamura N., Fujita S. C., Yanagisawa K., Michikawa M. (2002) J. Biol. Chem. 277, 29919–29926 [DOI] [PubMed] [Google Scholar]
- 29. Hayashi H., Campenot R. B., Vance D. E., Vance J. E. (2004) J. Biol. Chem. 279, 14009–14015 [DOI] [PubMed] [Google Scholar]
- 30. Saura J., Tusell J. M., Serratosa J. (2003) Glia 44, 183–189 [DOI] [PubMed] [Google Scholar]
- 31. Michikawa M., Gong J. S., Fan Q. W., Sawamura N., Yanagisawa K. (2001) J. Neurosci. 21, 7226–7235 [DOI] [PMC free article] [PubMed] [Google Scholar]
- 32. Andrews N. C., Faller D. V. (1991) Nucleic Acids Res. 19, 2499. [DOI] [PMC free article] [PubMed] [Google Scholar]
- 33. Deryckere F., Gannon F. (1994) BioTechniques 16, 405. [PubMed] [Google Scholar]
- 34. Hsu H. L., Huang L., Tsan J. T., Funk W., Wright W. E., Hu J. S., Kingston R. E., Baer R. (1994) Mol. Cell Biol. 14, 1256–1265 [DOI] [PMC free article] [PubMed] [Google Scholar]
- 35. Hsu H. L., Wadman I., Tsan J. T., Baer R. (1994) Proc. Natl. Acad. Sci. U.S.A. 91, 5947–5951 [DOI] [PMC free article] [PubMed] [Google Scholar]
- 36. Watada H., Kajimoto Y., Umayahara Y., Matsuoka T., Morishima T., Yamasaki Y., Kawamori R., Kamada T. (1995) Gene 153, 255–259 [DOI] [PubMed] [Google Scholar]
- 37. Johnson S. E., Wang X., Hardy S., Taparowsky E. J., Konieczny S. F. (1996) Mol. Cell. Biol. 16, 1604–1613 [DOI] [PMC free article] [PubMed] [Google Scholar]
- 38. Sloan S. R., Shen C. P., McCarrick-Walmsley R., Kadesch T. (1996) Mol. Cell. Biol. 16, 6900–6908 [DOI] [PMC free article] [PubMed] [Google Scholar]
- 39. Lluís F., Ballestar E., Suelves M., Esteller M., Muñoz-Cánoves P. (2005) EMBO J. 24, 974–984 [DOI] [PMC free article] [PubMed] [Google Scholar]
- 40. Cheng J. T., Hsu H. L., Hwang L. Y., Baer R. (1993) Oncogene 8, 677–683 [PubMed] [Google Scholar]
- 41. Amati B., Brooks M. W., Levy N., Littlewood T. D., Evan G. I., Land H. (1993) Cell 72, 233–245 [DOI] [PubMed] [Google Scholar]
- 42. Amati B., Littlewood T. D., Evan G. I., Land H. (1993) EMBO J. 12, 5083–5087 [DOI] [PMC free article] [PubMed] [Google Scholar]
- 43. Grandori C., Cowley S. M., James L. P., Eisenman R. N. (2000) Annu. Rev. Cell Dev. Biol. 16, 653–699 [DOI] [PubMed] [Google Scholar]
- 44. Knoepfler P. S., Cheng P. F., Eisenman R. N. (2002) Genes Dev. 16, 2699–2712 [DOI] [PMC free article] [PubMed] [Google Scholar]
- 45. Zimmerman K. A., Yancopoulos G. D., Collum R. G., Smith R. K., Kohl N. E., Denis K. A., Nau M. M., Witte O. N., Toran-Allerand D., Gee C. E., et al. (1986) Nature 319, 780–783 [DOI] [PubMed] [Google Scholar]
- 46. Marcu K. B., Bossone S. A., Patel A. J. (1992) Annu. Rev. Biochem. 61, 809–860 [DOI] [PubMed] [Google Scholar]
- 47. Hagen G., Müller S., Beato M., Suske G. (1992) Nucleic Acids Res. 20, 5519–5525 [DOI] [PMC free article] [PubMed] [Google Scholar]
- 48. Lania L., Majello B., De Luca P. (1997) Int. J. Biochem. Cell Biol. 29, 1313–1323 [DOI] [PubMed] [Google Scholar]
- 49. Suske G. (1999) Gene 238, 291–300 [DOI] [PubMed] [Google Scholar]
- 50. Kennett S. B., Udvadia A. J., Horowitz J. M. (1997) Nucleic Acids Res. 25, 3110–3117 [DOI] [PMC free article] [PubMed] [Google Scholar]
- 51. Saito K., Nishijima M., Kuge O. (1998) J. Biol. Chem. 273, 17199–17205 [DOI] [PubMed] [Google Scholar]
- 52. Miller D. M., Polansky D. A., Thomas S. D., Ray R., Campbell V. W., Sanchez J., Koller C. A. (1987) Am. J. Med. Sci. 294, 388–394 [DOI] [PubMed] [Google Scholar]
- 53. Sugimoto H., Banchio C., Vance D. E. (2008) Prog. Lipid Res. 47, 204–220 [DOI] [PubMed] [Google Scholar]
- 54. Banchio C., Schang L. M., Vance D. E. (2003) J. Biol. Chem. 278, 32457–32464 [DOI] [PubMed] [Google Scholar]
- 55. Banchio C., Schang L. M., Vance D. E. (2004) J. Biol. Chem. 279, 40220–40226 [DOI] [PubMed] [Google Scholar]
- 56. Banchio C., Lingrell S., Vance D. E. (2006) J. Biol. Chem. 281, 10010–10015 [DOI] [PubMed] [Google Scholar]
- 57. Banchio C., Lingrell S., Vance D. E. (2007) J. Biol. Chem. 282, 14827–14835 [DOI] [PubMed] [Google Scholar]
- 58. Sugimoto H., Bakovic M., Yamashita S., Vance D. E. (2001) J. Biol. Chem. 276, 12338–12344 [DOI] [PubMed] [Google Scholar]
- 59. Sugimoto H., Sugimoto S., Tatei K., Obinata H., Bakovic M., Izumi T., Vance D. E. (2003) J. Biol. Chem. 278, 19716–19722 [DOI] [PubMed] [Google Scholar]
- 60. Sugimoto H., Okamura K., Sugimoto S., Satou M., Hattori T., Vance D. E., Izumi T. (2005) J. Biol. Chem. 280, 40857–40866 [DOI] [PubMed] [Google Scholar]
- 61. Aoyama C., Ishidate K., Sugimoto H., Vance D. E. (2007) Biochim. Biophys. Acta 1771, 1148–1155 [DOI] [PubMed] [Google Scholar]
- 62. Zhu L., Michel V., Bakovic M. (2009) Gene 447, 51–59 [DOI] [PubMed] [Google Scholar]
- 63. Cole L. K., Vance D. E. (2010) J. Biol. Chem. 285, 11880–11891 [DOI] [PMC free article] [PubMed] [Google Scholar]
- 64. Menssen A., Hermeking H. (2002) Proc. Natl. Acad. Sci. U.S.A. 99, 6274–6279 [DOI] [PMC free article] [PubMed] [Google Scholar]
- 65. Fernandez P. C., Frank S. R., Wang L., Schroeder M., Liu S., Greene J., Cocito A., Amati B. (2003) Genes Dev. 17, 1115–1129 [DOI] [PMC free article] [PubMed] [Google Scholar]
- 66. Amati B., Land H. (1994) Curr. Opin. Genet. Dev. 4, 102–108 [DOI] [PubMed] [Google Scholar]
- 67. Secombe J., Pierce S. B., Eisenman R. N. (2004) Cell 117, 153–156 [DOI] [PubMed] [Google Scholar]
- 68. Adhikary S., Eilers M. (2005) Nat. Rev. Mol. Cell Biol. 6, 635–645 [DOI] [PubMed] [Google Scholar]
- 69. Meyer N., Kim S. S., Penn L. Z. (2006) Semin. Cancer Biol. 16, 275–287 [DOI] [PubMed] [Google Scholar]
- 70. Li L., He S., Sun J. M., Davie J. R. (2004) Biochem. Cell Biol. 82, 460–471 [DOI] [PubMed] [Google Scholar]
- 71. Marin M., Karis A., Visser P., Grosveld F., Philipsen S. (1997) Cell 89, 619–628 [DOI] [PubMed] [Google Scholar]
- 72. Bouwman P., Göllner H., Elsässer H. P., Eckhoff G., Karis A., Grosveld F., Philipsen S., Suske G. (2000) EMBO J. 19, 655–661 [DOI] [PMC free article] [PubMed] [Google Scholar]
- 73. Chadjichristos C., Ghayor C., Herrouin J. F., Ala-Kokko L., Suske G., Pujol J. P., Galéra P. (2002) J. Biol. Chem. 277, 43903–43917 [DOI] [PubMed] [Google Scholar]
- 74. Le Goff W., Guerin M., Petit L., Chapman M. J., Thillet J. (2003) J. Lipid Res. 44, 1322–1331 [DOI] [PubMed] [Google Scholar]
- 75. Lee L. T., Tan-Un K. C., Pang R. T., Lam D. T., Chow B. K. (2004) Mol. Endocrinol. 18, 1740–1755 [DOI] [PubMed] [Google Scholar]
- 76. Kyo S., Takakura M., Taira T., Kanaya T., Itoh H., Yutsudo M., Ariga H., Inoue M. (2000) Nucleic Acids Res. 28, 669–677 [DOI] [PMC free article] [PubMed] [Google Scholar]
- 77. Parisi F., Wirapati P., Naef F. (2007) Nucleic Acids Res. 35, 1098–1107 [DOI] [PMC free article] [PubMed] [Google Scholar]
- 78. Gartel A. L., Ye X., Goufman E., Shianov P., Hay N., Najmabadi F., Tyner A. L. (2001) Proc. Natl. Acad. Sci. U.S.A. 98, 4510–4515 [DOI] [PMC free article] [PubMed] [Google Scholar]
- 79. Hsu H. L., Cheng J. T., Chen Q., Baer R. (1991) Mol. Cell. Biol. 11, 3037–3042 [DOI] [PMC free article] [PubMed] [Google Scholar]
- 80. Bradley C. K., Takano E. A., Hall M. A., Göthert J. R., Harvey A. R., Begley C. G., van Eekelen J. A. (2006) Eur. J. Neurosci. 23, 1677–1689 [DOI] [PubMed] [Google Scholar]
- 81. van Eekelen J. A., Bradley C. K., Göthert J. R., Robb L., Elefanty A. G., Begley C. G., Harvey A. R. (2003) Neuroscience 122, 421–436 [DOI] [PubMed] [Google Scholar]
- 82. Muroyama Y., Fujiwara Y., Orkin S. H., Rowitch D. H. (2005) Nature 438, 360–363 [DOI] [PubMed] [Google Scholar]
Associated Data
This section collects any data citations, data availability statements, or supplementary materials included in this article.