Abstract
GRP78, a well characterized chaperone in the endoplasmic reticulum, is critical to the unfolded protein response. More recently, it has been identified on the cell surface, where it has many roles. On cancer cells, it functions as a signaling receptor coupled to proproliferative/antiapoptotic and promigratory mechanisms. In the current study, we demonstrate that ligation of prostate cancer cell surface GRP78 by its natural ligand, activated α2-macroglobulin (α2M*), results in a 2–3-fold up-regulation in the synthesis of prostate-specific antigen (PSA). The PSA is secreted into the medium as an active proteinase, where it binds to native α2M. The resultant α2M·PSA complexes bind to GRP78, causing a 1.5–2-fold increase in the activation of MEK1/2, ERK1/2, S6K, and Akt, which is coupled with a 2–3-fold increase in DNA and protein synthesis. PSA is a marker for the progression of prostate cancer, but its mechanistic role in the disease is unclear. The present studies suggest that PSA may be involved in a signal transduction-dependent feedback loop, whereby it promotes a more aggressive behavior by human prostate cancer cells.
Keywords: Akt PKB, Apoptosis, Cell Migration, DNA Synthesis, Protein Synthesis, Akt PKB, GRP78 Interaction with alpha2-Macroglobulin·PSA Complexes, PSA and Prostate Cancer Progression, alpha2-Macroglobulin·PSA Complexes and Prostate Cancer, Regulation of Prostate Cancer Cell Proliferation
Introduction
Prostate-specific antigen (PSA)2 is a serine proteinase that complexes with serum proteinase inhibitors, including α2-macroglobulin (α2M) (1). Monitoring of PSA is generally recommended in men over 50 years old to screen for prostate cancer; however, there is significant controversy with respect to its use as a marker for the appearance of the disease (1–6). By contrast, substantial data support its use in monitoring progression and metastasis (1, 2, 5). Recently, a Phase II controlled trial suggested that immunization against PSA prolongs patient survival, suggesting a direct role for PSA in the pathobiology of the disease (7). Studies have shown that PSA produced by metastatic prostate cancer cells is involved in bone remodeling, a common feature in the bony metastasis of this disease (8). There is, however, little other evidence indicating a direct role for PSA in disease progression. α2M is synthesized by many tissues, particularly the liver; however, it is also produced locally in prostate stromal tissue, where it is available to complex with PSA (9). When a proteinase attacks the so-called “bait region,” thiol esters in each of the four α2M subunits rupture, and the protein undergoes a very large conformational change, exposing receptor recognition sites in each subunit (10). Two receptors have been identified for activated forms of α2M (α2M*), namely the LDL receptor-related protein (LRP) and cell surface-associated GRP78 (glucose-regulated protein of Mr ∼78,000) (10, 11). In addition to proteinases, exposure of α2M to small primary amines or ammonia, by direct attack on the thiol esters, produces α2M* (10). Although GRP78 is primarily known as a resident endoplasmic reticulum chaperone, it appears on the cell surface of many types of malignant cells, including human prostate cancer (12–16). Here it has many functions, including serving as an α2M* signaling receptor linked to proproliferative, promigratory, and antiapoptotic signaling cascades (12–16). Patients with many forms of cancer, including prostate, may develop autoantibodies that bind to the NH2-domain of GRP78 where α2M* binds (16–18). These antibodies are receptor agonists linked to a poor outcome for patients with prostate cancer (16). In the present study, we demonstrate that ligation of GRP78 on the surface of human prostate cancer cells causes increased production and secretion of PSA, which is functional and complexes with native α2M. These complexes bind to cell surface GRP78, triggering ERK and Akt activation and increased DNA and protein synthesis. We hypothesize that ligation of cell surface GRP78 on prostate cancer cells may drive an autoregulatory feedback loop wherein reaction of α2M with PSA generates more α2M*, thus further activating proproliferative/antiapoptotic signaling mechanisms.
EXPERIMENTAL PROCEDURES
Materials
Receptor-recognized α2M* was produced by reaction of α2M with methylamine as described previously (11). Culture media were purchased from Invitrogen. Antibodies against α2M* and PSA were purchased from Santa Cruz Biotechnology, Inc. (Santa Cruz, CA). Antibodies against phosphorylated and unphosphorylated MEK1/2Ser-217/221, ERK1/2Thr-202/Tyr-204, p38 MAPKThr-180/Tyr-182, AktThr-308, Ser-473, and S6KThr-379 were purchased from Cell Signaling Technology, Inc. (Danvers, MA). Antibodies against the COOH-terminal domain of GRP78 (anti-CTD antibody) were from Aventa Biopharmaceutical Corp. (San Diego, CA). 35S-Labeled amino acids, ExpressS35S35®, and [3H]leucine (specific activity 115.4 Ci/mmol) were from PerkinElmer Life Sciences, and [3H]thymidine (specific activity 71.5 Ci/mmol) was from American Radiochemicals Inc. (St. Louis, MO). PSA was purchased from Innovative Research of America (Sarasota, FL). Other reagents of the highest available purity were procured locally.
Cancer Cell Lines
In preliminary experiments, we used two prostate cancer cell lines, 1-LN and DU-145, which express GRP78 on their cell surface, and the PC-3 prostate cancer line, which does not express GRP78 on the cell surface (11–15). The highly metastatic 1-LN cell line is derived from the less metastatic PC-3 line and was a kind gift of Dr. Phil Walther (Duke University Medical Center, Durham, NC). The PC-3 and DU-145 cell lines were obtained from the American Type Culture Collection. These cells were grown in 6-well plates (500 × 103 cells/well) to confluence in RPMI 1640 medium containing 10% fetal bovine serum, 2 mm glutamine, 12.5 units/ml penicillin, 6.5 μg/ml streptomycin, and 10 mm insulin in a humidified CO2 (5%) incubator. At 90% confluence, the medium was aspirated, the monolayers were washed with ice-cold HHBSS, a fresh volume of medium was added, and the cells used for the experiments described below.
Measurement of α2M·Methylamine-induced Expression of PSA Protein in 1-LN, DU-145, and PC-3 Prostate Cancer Cells
In initial experiments, we determined the effect of varying concentrations of α2M·methylamine on PSA levels by Western blotting. 1-LN DU-145 and PC-3 cells grown to confluence were incubated in the RPM1640 medium used above in 6-well plates (3 × 10⁶ cells/well). The cells were stimulated with varying concentrations of α2M·methylamine and then incubated at 37 °C in a humidified CO2 (5%) incubator for 20 min. The reaction was terminated by aspirating the medium. The cells were lysed in lysis buffer A containing 50 mm Tris·HCl (pH 7.5), 12 mm NaCl, 1% Nonidet P-40, 2.5 mm sodium fluoride, 1 mm sodium pyrophosphate, 0.1 mm sodium orthovanadate, 1 mm PMSF, 1 mm benzamidine, and leupeptin (20 μg/ml) over ice for 20 min. Cell lysates were scraped into new Eppendorf tubes and centrifuged for 5 min at 800 × g at 4 °C, and protein contents of lysates were determined (19). To equal amounts of lysate protein, a volume of 4× sample buffer was added, and samples were boiled for 5 min. Samples were electrophoresed on 10% gel, transferred to PDVF membrane, and membranes were immunoblotted with anti-PSA antibodies. Protein bands on the immunoblot were visualized and quantified by ECF and phosphorimaging. The membrane was reprobed for actin as a protein loading control.
Measurement of PSA mRNA Levels by Reverse Transcription
Total RNA from 1-LN, DU145, and PC-3 prostate cancer cells treated with buffer or α2M* was extracted by a single method using an RNeasy minikit (Qiagen, Chatsworth, CA) according to the manufacturer's instructions. Total RNA was reverse-transcribed with 1 μg of RNA in a 20-μl reaction mixture, using Moloney murine leukemia virus reverse transcriptase (200 units) and oligo(dT) as primer for 1 h at 4 °C. The resulting cDNA (5 μg) was used as a template, and a 225-bp segment of the PSA cDNA was amplified using a 20-mer upstream primer (5′-CCA ACA CCC GCT CTA CGA TA-3′) and a 22-mer downstream primer (5′-ACC TTC TGA CGG TGA ACT TGC G-3′). A 302-bp segment of mouse β-actin (constitutive internal control) cDNA was co-amplified using a set of PCR primers provided in an R&D Systems kit (Minneapolis, MN). Amplification was carried out in a Biometra T3 thermocycler for 28 cycles (one cycle: 94 °C for 45 s, 60 °C for 45 s, and 70 °C for 45 s). PCR products were analyzed on a 1.2% (w/v) agarose/ethidium bromide) gel. The gels were photographed, and the intensity of individual PSA and β-actin mRNA bands was quantified as PSA/β-actin ratios.
Measurement of the Effects of Silencing GRP78 Gene Expression by RNAi in 1-LN, DU-145, and PC-3 Cells on α2M·methylamine-induced PSA Synthesis
To determine the requirement of cell surface GRP78 for α2M·methylamine-induced up-regulation of PSA, we silenced the expression of GRP78 by RNAi. In our earlier publications we have used two GRP78 targeting mRNA sequences for silencing its gene expression and found identical effects on GRP78 expression as well as downstream signaling (15). We also found that transfection of cells with GRP78 dsRNA down-regulates both the total cellular GRP78 pool and cell surface-localized GRP78 (20). Therefore, in this investigation, we have used only one GRP78 targeting mRNA sequence for silencing the expression of GRP78. The chemical synthesis of dsRNA homologous in sequence to the target GRP78 370K1QQLVK376 mRNA sequence. 5′-AAA ATA CAG CAA TTA GTA AAG-3′ (Swiss Prot GRP primary sequence accession number P11021) were performed by Ambion (Austin, TX). For making GRP78 dsRNA, sense (5′-AAU ACA GCA AUU AGU AAA GTT-3′) and antisense (5′-CUU UAC UAA UUG CUG UAU UTT-3′) oligonucleotides were annealed by Ambion. Transfection of 1-LN, DU-145, and PC-3 cells with GRP78 dsRNA was done as described previously (15). Briefly, confluent 1-LN DU-145 and PC-3 cell monolayers (1.5 × 10⁶ cells/well in 6-well plates) were incubated as described above and transfected with 75 nm annealed GRP78 dsRNA and control cells were transfected with Lipofectamine as described previously (15). Forty-eight h after transfection, the control cells were stimulated with either buffer or α2M·methylamine (50 pm for 20 min). Cells transfected with scrambled dsRNA and treated with α2M* were used as the control. The reactions were terminated by aspirating the medium, and cells were lysed in lysis buffer A over ice for 15 min. Lysates were then transferred to tubes and centrifuged, and proteins in the supernatant were determined. Equal amounts of lysate protein were electrophoresed, transferred to membrane, and immunoblotted with PSA antibodies. Protein bands on the membrane were detected and quantified by ECF and phosphorimaging. The membrane was reprobed for protein loading control actin.
Measurement of α2M*-induced Synthesis of PSA in Prostate Cancer Cells
Confluent 1-LN cells incubated in the RPMI 1640 medium described above in 6-well plates (4 × 10⁶ cells/well) were labeled with [35S]-Express S35S35 protein labeling mixture (PerkinElmer Life Sciences) (250 μCi/ml) for 2 h at 37 °C in a humidified CO2 (5%) incubator. The labeling was stopped by aspirating the medium; monolayers were washed four times with cold Hanks' balanced salt solution containing 10 mm HEPES, pH 7.4, and 3.5 mm NaHCO3 buffer; a volume of the RPMI medium was added; and cells were incubated at 37 °C for temperature equilibration. Cells in the wells were treated with anti-CTD antibody (2 μg/ml) or buffer for 1 h before adding α2M* (50 pm for 20 min), and the cells were incubated as above. The reactions were stopped by aspirating the medium; a volume of lysis buffer containing 50 mm Tris·HCl (pH 7.5), 120 mm NaCl, 1% Nonidet P-40, 25 mm sodium fluoride, 1 mm sodium pyrophosphate, 0.1 mm sodium orthovanadate, 1 mm PMSF, 1 mm benzamidine, and leupeptin (20 μg/ml) was added to each well; and cells were lysed for 15 min over ice. Cell lysates were scraped into respective tubes and centrifuged for 5 min at 800 × g at 4 °C, and protein contents of lysates were determined (19). Equal amounts of lysate proteins were immunoprecipitated with anti-PSA antibodies (1:50) in the presence of Protein A-agarose overnight at 4 °C with rotation. PSA immunoprecipitates were washed three times with the above lysis buffer by centrifuging at 2500 rpm at 4 °C for 5 min. Thirty μl of 4× sample buffer was added to each immunoprecipitate; samples were boiled for 5 min and centrifuged for 4 min; an equal volume of supernatant was electrophoresed (10% gel) and transferred onto PVDF membranes; and the membranes were autoradiographed in a PhosphorImager and quantified.
Measurement of Formation of α2M*·PSA Complex from Secreted PSA and Exogenous Native α2M* in 1-LN Cells Stimulated with α2M*
1-LN cells incubated overnight in serum-free RPMI 1640 medium in 6-well plates (4 × 10⁶ cells/well) were stimulated with either buffer or α2M* (50 pm) and incubated as described above. At 12 h of incubation, another dose of α2M* (50 pm) was added, and the cells were incubated for an additional 11 h. At this time 50 nm native α2M was added to the medium, and cells were incubated for 1 h. At the end of the incubation, medium from both groups was carefully collected and centrifuged at 800 × g for 5 min at 4 °C. The respective supernatants were pooled and concentrated to small volume by centrifugation in Amicon ultracentrifuge units (Millipore Corp., Billerica, MA) at 2500 rpm at 4 °C for the desired period of time. The concentrates were carefully removed, a volume of the above lysis buffer was added to each concentrate, and their protein contents were determined (19). Equal amounts of concentrate proteins were immunoprecipitated with anti-PSA antibody (1:50) in the presence of Protein A-agarose overnight with 4 °C with gentle buffer. The PSA immunoprecipitates were washed three times with lysis buffer at 2500 rpm for 5 min at 4 °C. A volume of Laemmli 2× sample buffer without DTT was added to each immunoprecipitate; each sample was boiled for 5 min and centrifuged for 4 min; and an equal volume of supernatant was electrophoresed (10% gel), transferred to PVDF membrane, and immunoblotted with anti-PSA antibodies overnight at 4 °C with gentle shaking. The detection and quantitation of immunoblots were performed by ECF and phosphorimaging. The membranes were reprobed for α2M.
Synthesis of α2M·PSA Complex
The synthesis of human α2M·PSA complexes was performed according to Otto et al. (21). α2M was isolated and purified from human plasma as described previously (11). Native α2M was incubated with a 5-fold molar excess of PSA at 37 °C for 1 h in PBS. The α2M·PSA complex was isolated by chromatography on a HiPrep Sephacryl 16/60 S300 HR column (GE Healthcare) equilibrated in PBS. The α2M·PSA complex, which eluted first, was collected, and fractions were pooled and concentrated in a Pierce (Rockford, IL) iCon® concentrator to a final concentration of 2–4 mg/ml. Eluates of unincorporated PSA, which eluted later, were also collected, pooled, and concentrated. The formation of α2M·PSA complex was analyzed by native gel electrophoresis. Two-μg samples of methylamine-activated α2M or α2M·PSA complex were loaded onto a 7% Tris-acetate gel and electrophoresed with TBE extended range (Bio-Rad) running buffer for 1.5 h. The protein bands were detected with Coomassie staining.
Determination of the Effects of α2M·PSA Complex on DNA Synthesis in 1-LN, DU-145, or PC-3 Cells
In preliminary experiments, we determined the effect of incubating 1-LN cells with varying concentrations of α2M·methylamine and premade α2M·PSA on incorporation of [3H]thymidine into DNA, as described previously (22, 23). After determining the optimal concentrations of α2M·methylamine and α2M·PSA required for maximal incorporation of [3H]thymidine into cells, we used this concentration to examine the modulation of α2M*-induced DNA synthesis. 1-LN cells (300 × 103 cells/well) in 48-well plates were grown in RPMI medium in a humidified CO2 (5%) incubator at 37 °C. At ∼90% confluence, the medium was aspirated, and a volume of RPMI was added, followed by the addition of either buffer, native α2M (50 pm), PSA (50 pm), cell-free medium, α2M·methylamine (50 pm), premade α2M·PSA (50 pm) or complex obtained by adding α2M (5 μg/ml) to 1-LN tumor cells in culture, anti-CTD antibody (2 μg/ml), anti-CTD antibody and then α2M·methylamine, anti-CTD antibody and then premade α2M·PSA, anti-CTD antibody and then α2M·PSA made in culture, actinomycin D and then premade α2M·PSA, actinomycin D (5 μg/1 ml) and then α2M·methylamine (50 pm), actinomycin D and then premade α2M·PSA, or actinomycin D and then α2M·PSA made in the medium as above. [3H]thymidine (2 μCi/ml) was added to each well, and the cells were incubated overnight. The reactions were terminated by aspirating the medium, and monolayers were washed twice with ice-cold 5% TCA, followed by three washings with ice-cold PBS. Cells were lysed in a volume of 1 n NaOH (40 °C/2 h), lysate protein was estimated, and the samples were counted in a liquid scintillation counter (14). To further examine the requirement of cell surface GRP78 expression for cell-proliferative effects of α2M-NH2, we measured [3H]thymidine uptake in DU-145 cells, which express cell surface GRP78, and on PC-3 cells, which do not. DU-145 and PC-3 cells were grown in 48-well plates in RPMI medium as described above. At about ∼90% confluence, the medium was aspirated, and a volume of RPMI medium was added, followed by the addition of either buffer, native α2M (50 pm), α2M·methylamine (50 pm), premade α2M·PSA (50 pm) complex obtained by adding α2M (5 μg/ml) to 1-LN tumor cells in culture or anti-CTD antibody (2 μg/ml) added 1 h before adding α2M·methylamine, or α2M·PSA complexes as above. The effects of anti-CTD antibody alone were also studied. [3H]thymidine (2 μCi/ml) was added to each well, and the cells were incubated overnight. The incubations were then processed as described for 1-LN cells.
Determination of the Effects of α2M·PSA Complex on Protein Synthesis in 1-LN Cells
1-LN cells (300 × 103 cells/well in 48-well plates were grown in RPMI medium in a humidified CO2 (5%) incubator at 37 °C. At ∼90% confluence, the medium was aspirated, and a volume of RPMI was added, followed by the addition of either buffer, native α2M (50 pm), PSA (50 pm), cell-free medium, α2M·methylamine (50 pm), α2M·PSA complexes as above, anti-CTD antibody (2 μg/ml), anti-CTD antibody and then α2M·methylamine (50 pm), anti-CTD antibody and then α2M·PSA as above, actinomycin D (5 μg/ml) and then α2M·methylamine (50 pm), or actinomycin D and then α2M·PSA as above. To the wells was then added [3H]leucine (2 μCi/ml), and cells were incubated overnight as above. The reactions were terminated by aspirating the medium, and monolayers were washed twice with ice-cold 5% TCA, followed by three washings with ice-cold PBS. Cells were lysed in a volume of 1 n NaOH (40 °C/2 h), protein was estimated, and the lysates were counted in a liquid scintillation counter (14).
Measurement of α2M·PSA-induced Increase in Levels of PSA, GRP78, phospho-MEK1/2, phospho-ERK1/2, phospho-p38 MAPK, phospho-S6K, phospho-AktThr-308, and phospho-AktSer-473 in 1-LN, DU-145, and PC-3 Prostate Cancer Cells
These prostate cancer cells (3 × 10⁶ cells/well) in separate 6-well plates were grown in the RPMI medium used above in a humidified CO2 (5%) incubator at 37 °C. At ∼90% confluence, the medium was aspirated, and a volume of RPMI was added, followed by the addition of either buffer, native α2M (50 pm for 20 min), α2M·methylamine (50 pm for 20 min), premade α2M·PSA (50 pm for 20 min), or tumor tissue culture-derived α2M·PSA (α2M, 5 μg/ml for 20 min) in the respective wells. The reaction was terminated by aspirating the medium, and a volume of lysis buffer A was added. Cells were lysed over ice for 15 min and scraped into tubes, and tubes were centrifuged for 5 min at 800 × g at 4 °C. The supernatants were transferred to new tubes, their protein contents were estimated, and equal amounts of protein were electrophoresed (10 or 12.5% gels). Protein bands were transferred to PVDF membrane and membrane-immunoblotted for PSA, GRP78, phospho-MEK1/2, phospho-ERK1/2, phospho-p38 MAPK, phospho-AktThr-308, phospho-AktSer-473, and phospho-S6K with their specific antibodies. The respective immunoblots were probed for their protein loading control actin and respective unphosphorylated protein. Protein bands were detected by ECF and quantified using a PhosphorImager.
Statistical Analysis
Statistical significance of the data were determined by Student's t test.
RESULTS
α2M·Methylamine Up-regulates Expression of PSA Protein in 1-LN and DU-145 but Not in PC-3 Prostate Cancer Cells
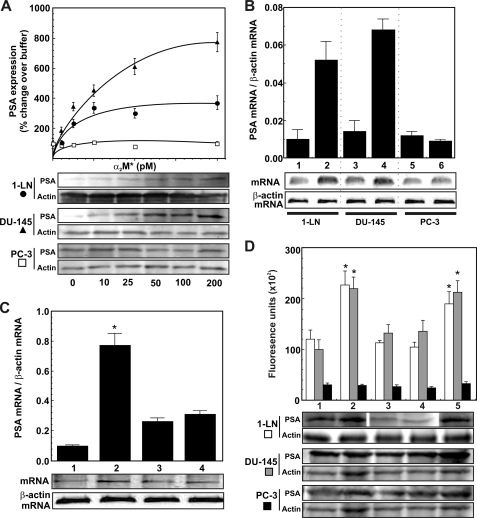
Treatment of 1-LN or DU-145 prostate cancer cells with varying concentrations of α2M·methylamine for 20 min caused a concentration-dependent increase in PSA protein, as determined by Western blotting (Fig. 1A). The maximum increase occurred at about 50 pm α2M·methylamine; therefore, we have used this concentration of α2M·methylamine in the experiments described below. This same treatment had no effect on PC-3 cells. Both 1-LN and DU145 cells express GRP78 on their cell surfaces, whereas PC-3 cells do not (12). 1-LN prostate cancer cells are derived from the less metastatic PC-3 line.
FIGURE 1.
α2M*-induced transcriptional and translational up-regulation of PSA in prostate cancer cells. A, effect of varying concentrations of α2M* on PSA protein expression in 1-LN (●), DU-145 (▴), and PC-3 (□) cancer cells. A representative immunoblot of PSA from three experiments along with the protein loading control actin is shown below the graph. Changes in PSA expression are shown in arbitrary fluorescence units and are the mean ± S.E. from three independent experiments, each assayed in triplicate. B, PSA mRNA levels in 1-LN, DU-145, or PC-3 prostate cancer cells stimulated with α2M* (50 pm for 20 min). Lanes 1, 3, and 5 on the mRNA gel are buffer-treated, and lanes 2, 4, and 6 are α2M*-treated. Changes in PSA mRNA levels shown above the RNA gel are representative of three independent experiments performed in triplicate and are expressed as PSA mRNA/β-actin mRNA. C, modulation in 1-LN prostate cancer cells of α2M*-induced PSA transcription by antibody directed against the COOH-terminal domain of GRP78. The lanes in the mRNA gel are treated with buffer (lane 1), α2M* (50 pm for 20 min) (lane 2); antibody (2 μg/ml for 1 h) (lane 3); or antibody (2 μg/ml for 1 h then α2M* (50 pm for 20 min) (lane 4). Changes in PSA mRNA levels are expressed as the ratio of PSA mRNA/β-actin mRNA, are shown above a representative RNA gel, and are expressed as the mean ± S.E. (error bars) from three independent studies, each assayed in triplicate. Values significantly different from buffer or antibody-treated cells at the 5% level are marked with an asterisk. D, modulation of α2M*-induced expression of PSA protein by GRP78 in 1-LN (black bars), DU-145 (dark gray bars), and PC-3 (light gray bars) cancer cells. See “Experimental Procedures” for details. The lanes in the representative PSA immunoblot are treated with Lipofectamine and then buffer (lane 1), Lipofectamine and then α2M* (50 pm for 20 min) (lane 2), GRP78 dsRNA (75 nm/48 h) (lane 3), GRP78 dsRNA (75 nm for 48 h) and then Lipofectamine and α2M* (50 pm for 20 min) (lane 4), and scrambled dsRNA (75 nm for 48 h) and then Lipofectamine and α2M* (50 pm for 20 min) (lane 5). The changes in PSA protein expression are shown in the bar diagram above the immunoblot and are expressed as the mean ± S.E. of fluorescence units from three independent experiments, each assayed in triplicate. Values significantly different from buffer and GPR78 dsRNA transfected cells at the 5% level are marked with an asterisk.
α2M·Methylamine Up-regulates PSA mRNA Levels in 1-LN and DU-145 but Not PC-3 Cancer Cells
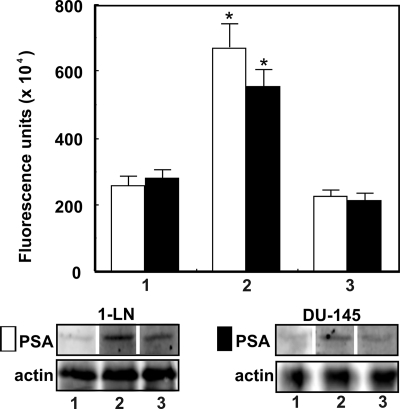
Treatment of 1-LN and DU145 prostate cancer cells with α2M·methylamine caused transcriptional up-regulation of PSA as determined by mRNA levels, which were about 2-fold higher compared with the buffer-treated cells (Fig. 1A). Pretreatment of 1-LN cells with anti-CTD antibody also inhibited α2M*-induced transcriptional up-regulation of PSA as judged by mRNA levels (Fig. 1B). Likewise, α2M·methylamine treatment of 1-LN and DU145 cells also increased PSA levels as determined by Western blotting (Fig. 2). Pretreatment of these cells with anti-CTD antibody significantly attenuated the expression of PSA protein (Fig. 2).
FIGURE 2.
α2M*-induced up-regulation of PSA protein in prostate cancer cells. The lanes in the immunoblots are treated with buffer (lane 1), α2M* (50 pm for 20 min) (lane 2), and anti-CTD antibody (2 μg/ml for 30 min) and then α2M* (50 pm for 20 min) (lane 3). The changes in PSA levels in 1-LN (□) and DU-145 (■) cells are shown as fluorescence units (× 104) above the immunoblot and are expressed as the mean ± S.E. (error bars) from three individual experiments assayed in triplicate. Values significantly different at the 5% level are marked with an asterisk.
Down-regulating GRP78 Expression by RNAi Inhibits α2M·Methylamine-induced Increase in PSA in 1-LN and DU-145 Cells
Ligation of cell surface GRP78 in 1-LN human prostate cancer cells triggers the synthesis of GRP78 and cell proliferation and prevents apoptosis as a result of activating several antiapoptotic signaling pathways (10–16). We have previously shown that under our experimental conditions, silencing GRP78 gene expression reduces GRP78 mRNA and cellular protein levels by about 60–65% (15). We hypothesized that if activated α2M* promotes PSA synthesis consequent to its binding to cell surface GRP78, then down-regulation of cell surface GRP78 by RNAi in cancer cells expressing GRP78 on their cell surface should decrease PSA synthesis in these cells. Indeed, silencing GRP78 expression by RNAi in 1-LN and DU-145 cells, but not PC-3 cells, significantly decreased α2M·methylamine-induced synthesis of PSA (Fig. 1D).
α2M·Methylamine Induces Increased Synthesis of PSA in 1-LN Prostate Cancer Cells
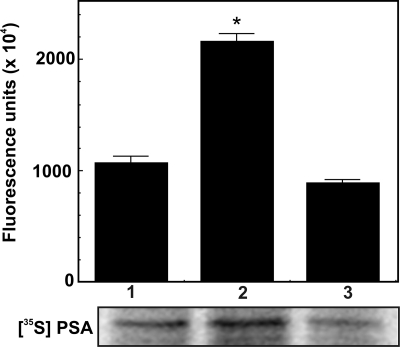
To further demonstrate α2M·methylamine-induced up-regulation of PSA transcription in 1-LN cells, we next determined PSA synthesis by measuring the incorporation of 35S-labeled precursor amino acids (Fig. 3). α2M·methylamine-stimulated cells caused a 2–3-fold increased synthesis of PSA compared with buffer-treated cells (Fig. 3). Pretreatment of cells with anti-CTD antibody nearly abolished α2M*-induced PSA synthesis (Fig. 3). Anti-CTD antibody exerted a similar effect on PSA mRNA levels (Fig. 1C).
FIGURE 3.
α2M*-induced synthesis of PSA in 1-LN prostate cancer cells. Cells were prelabeled with [35S]amino acids for 2 h. After washing with fresh RPMI-S medium to remove free label, the indicated additions were made. The lanes in the autoradiograph are treated with buffer (lane 1), α2M* (50 pm for 20 min) (lane 2), and anti-CTD antibody (2 μg/ml for 1 h) and then α2M* (50 pm for 20 min) (lane 3). 35S incorporation into PSA was determined by phosphorimaging of the autoradiogram. Values are shown as fluorescence units (× 104) and are the mean ± S.E. (error bars) from three independent experiments performed in duplicate. Values significantly different from buffer and anti-CTD antibody-treated cells at the 5% level are marked with an asterisk.
Secretion of Newly Synthesized PSA into Media and Its Interaction with Exogenous Added Native α2M* in α2M·methylamine-treated 1-LN Cells
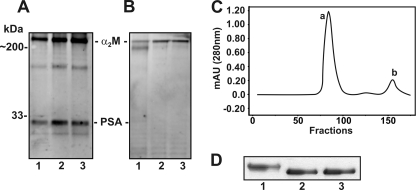
In the next series of experiments, we measured the secretion of PSA by 1-LN cells treated with α2M*·methylamine and interaction of secreted PSA with exogenously added native α2M (Fig. 4, A and B). Secreted PSA reacted with added α2M, as is evident from the immunoblot showing the reactivity of PSA (∼33 kDa) and native α2M subunits (∼200 kDa) protein bands with antibody against PSA (Fig. 4A). The PSA band on the immunoblot upon reprobing did not react with anti-α2M antibody, but the α2M band did (Fig. 4B), confirming α2M·PSA complex formation between secreted PSA and α2M. Pretreatment of cells with anti-CTD antibody inhibited α2M·PSA complex formation. This effect appears to be dependent on anti-CTD antibody-induced inhibition of PSA synthesis, resulting in its diminished secretion and thus α2M·PSA complex formation (Fig. 4A).
FIGURE 4.
Formation of α2M·PSA complex in 1-LN cells. See details under “Experimental Procedures.” A, immunoblot showing the immune reactivity of PSA antibody with PSA and α2M in tissue culture. B, immunoblot of A reprobed for α2M, showing the reactivity of α2M antibody with only the α2M subunits. The lanes in both of the immunoblots are treated with buffer (lane 1), premade α2M·methylamine (lane 2), and premade α2M·PSA made in culture (lane 3). C, elution profile of α2M·PSA (a) and free PSA (b) from the column. The absorbance was measured at wavelength = 280 nm and is plotted in milliabsorbance units (mAU). D, an immunoblot of α2M·PSA eluted from the column. The lanes in the immunoblot are treated with native α2M standard (lane 1), α2M·methylamine standard (lane 2), and α2M·PSA from the first peak a (lane 3).
Synthesis of α2M·PSA Complex
We also premade α2M·PSA and purified and characterized the complex. Nearly all of the PSA reacted with α2M. The α2M·PSA complex eluted first from a HiPrep Sephacryl 16/60 S300 HR column, followed by unreacted PSA (Fig. 4C). Upon electrophoresis, the synthesized α2M·PSA complex showed faster mobility than the native α2M, similar to that observed with α2M·methylamine (Fig. 4D). These are the expected properties of an α2M-proteinase complex (12).
Secreted and Synthesized α2M·PSA Complex Enhances [3H]Thymidine and [3H]Leucine Uptake by 1-LN Cells
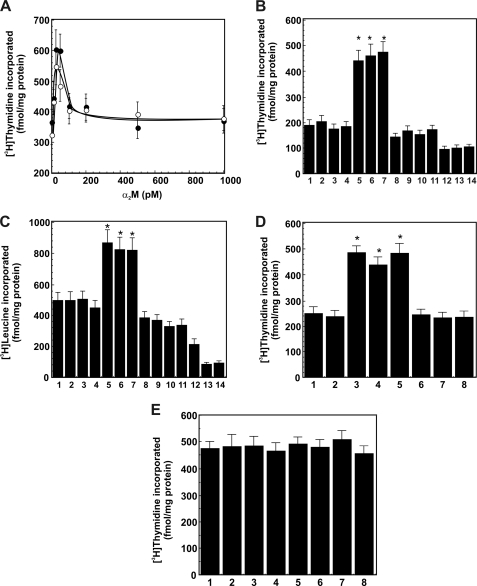
In preliminary experiments, we first studied the effect of varying concentrations of α2M·methylamine and synthesized α2M·PSA complexes on [3H]thymidine incorporation into 1-LN prostate cancer cells (Fig. 5A). The maximum incorporation of [3H]thymidine (fmol/mg cellular protein) into cells was observed at about a 50 pm concentration of both α2M·methylamine and premade α2M·PSA (Fig. 5A). Treatment of cells with higher concentrations of both forms of α2M* resulted in loss of [3H]thymidine incorporation (Fig. 5A). The observed kinetics of [3H]thymidine incorporation into cells is similar to that reported earlier (22). Therefore, in experiments described below, we employed 50 pm α2M*. In the next series of experiments, we measured DNA synthesis in 1-LN, DU-145, and PC-3 prostate cancer cells stimulated with premade α2M·PSA or α2M·PSA derived from the 1-LN cultured cells to which native α2M was added (Fig. 5, B–D). Both α2M·PSA preparations up-regulated DNA (Fig. 5, B and C) by about 2-fold in 1-LN and DU-145 cells compared with cells treated with buffer, native α2M, PSA, or medium (Fig. 5, B–D). In contrast, DNA synthesis in PC-3 cells was unaltered upon treatment with α2M* or anti-CTD antibody (Fig. 5E). Furthermore, the effects of α2M·PSA complexes on DNA and protein synthesis were nearly identical to those of α2M·methylamine (Fig. 5, B–D) observed here and reported elsewhere (11–14). Pretreatment of cancer cells with anti-CTD antibody nearly abolished DNA and protein synthesis induced by all activated α2M* preparations in prostate cancer cells (Fig. 5, B–D). Likewise, pretreatment of cells with actinomycin D abrogated all activated α2M-induced DNA synthesized (Fig. 5B). A similar effect of α2M·PSA preparations on protein synthesis comparable with that of α2M·methylamine was observed in these cells (Fig. 5C). Like DNA synthesis, increased protein synthesis in 1-LN cells induced by all activated α2M preparations was abolished by pretreatment of cells with either anti-CTD antibody or actinomycin D (Fig. 5C).
FIGURE 5.
α2M·PSA complexes up-regulate the incorporation of [3H]thymidine or [3H]leucine into 1-LN prostate cancer cells. See “Experimental Procedures” for details. A, effect of concentration of premade α2M·PSA (○) and α2M·methylamine (●) on [3H]thymidine incorporation into 1-LN prostate cancer cells. [3H]Thymidine incorporation into cells is expressed as fmol of [3H]thymidine incorporated/mg of protein and is mean ± S.E. (error bars) from three independent experiments, each assayed in quadruplicate. B, α2M·PSA complexes up-regulate [3H]thymidine incorporation into 1-LN cancer cells. The values are mean ± S.E. from three independent experiments assayed in quadruplicate and expressed as fmol of [3H]thymidine incorporated/mg of protein. C, α2M·PSA complexes up-regulated [3H]leucine incorporation into cellular protein. The values are mean ± S.E. from three independent experiments performed in quadruplicate and are expressed as fmol/[3H]leucine incorporated/mg of protein. The lanes in B and C are treated with buffer (lane 1), native α2M (lane 2), PSA (lane 3), media (lane 4), α2M·methylamine (lane 5), premade α2M·PSA (lane 6), α2M·PSA made in culture (lane 7), anti-CTD antibody (lane 8), anti-CTD antibody and then α2M·methylamine (lane 9), anti-CTD antibody and then premade α2M·PSA synthesized (lane 10), antibody and then α2M·PSA from the medium (lane 11), actinomycin D and then α2M·methylamine (lane 12), actinomycin D and then α2M·PSA made in culture (lane 13), and actinomycin D and then PSA secreted in culture (lane 14). Values significantly different at the 5% level are marked with an asterisk. D, α2M·PSA complexes up-regulate [3H]thymidine incorporation into DU-145 cancer cells. The values are mean ± S.E. from three independent experiments, each assayed in quadruplicate, and are expressed as fmol of [3H]thymidine incorporated/mg of protein. E, α2M·PSA complexes do not enhance [3H]thymdine incorporation into PC-3 cancer cells. The values are mean ± S.E. from three independent experiments, each assayed in quadruplicate, and are expressed as fmol of [3H]thymidine incorporated/mg of protein. The lanes in D and E are treated with buffer (lane 1), native α2M (lane 2), α2M·methylamine (lane 3), premade α2M·PSA (lane 4), α2M·PSA made in culture (lane 5), anti-CTD antibody and then α2M·methylamine (lane 6), anti-CTD antibody and then premade α2M (lane 7), and anti-CTD antibody and then α2M·PSA from the medium (lane 8). Values significantly different at the 5% level are marked with an asterisk in both panels.
α2M·PSA Complexes Up-regulate the Expression of GRP78, PSA, Phospho-MEK1/2, Phospho-ERK1/2, Phospho-p38 MAPK, Phospho-AktThr-308, Phospho-AktSer-473, and Phospho-S6K in 1-LN and DU-145 Cells
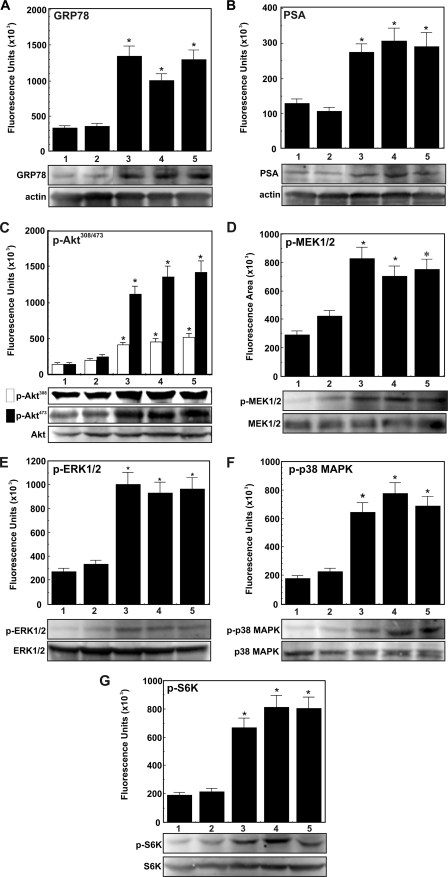
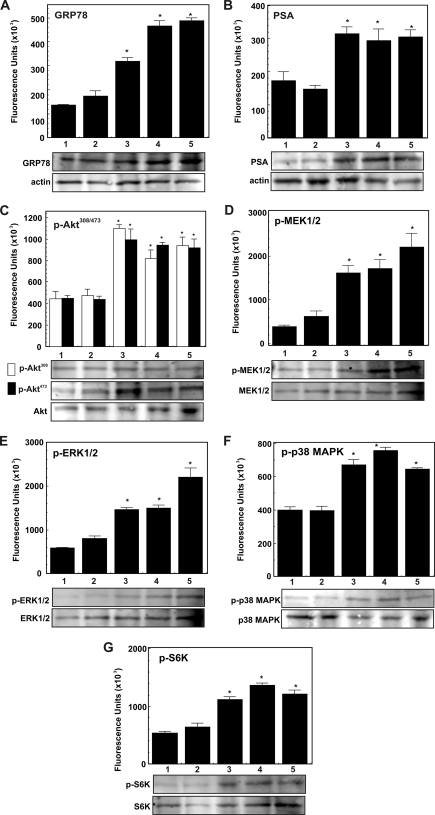
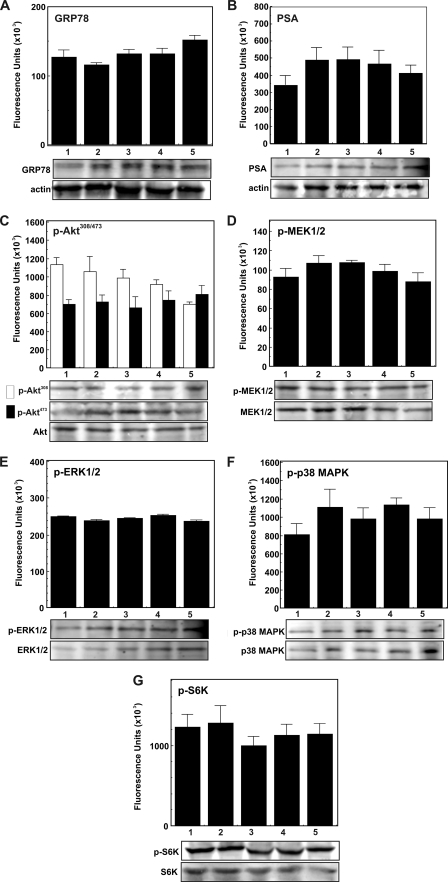
Above, we demonstrated that, as with α2M·methlyamine, incubation of 1-LN and DU-145 cells with α2M·PSA up-regulates prosurvival and proproliferative signaling resulting in DNA and protein synthesis (Fig. 5, B–D). Previous studies demonstrate that these effects depend on Akt activation (12–16). In the next series of experiments, we determined the effects of stimulating 1-LN, DU-145, and PC-3 cancer cells with α2M·PSA, either premade or from the medium (50 pm), on the expression of GRP78, PSA, phospho-MEK1/2, phospho-ERK1/2, p38 MAPK, phospho-AktThr-308, phospho-AktSer-473, and phospho-S6K by Western blotting (Figs. 6–8). Both of these α2M·PSA complexes up-regulated the expression of GRP78, PSA, phospho-MEK1/2, phospho-EKR1/2, phospho-p38 MAPK, phospho-AktThr-308, phospho-AktSer-473, and phospho-S6K by about 1.5–2-fold in 1-LN and DU-145 (Fig. 6). The stimulatory activity of these α2M·PSA complexes is very comparable with the stimulatory activity of α2M·methylamine reported here (Fig. 6) and elsewhere (11–16, 21, 22). In contrast, treatment of PC-3 cancer cells with these α2M-complexes showed no significant effect on PSA, GRP78, phospho-MEK1/2, phospho-ERK1/2, phospho-p38 MAPK, phospho-AktThr-308, and phospho-AktSer-473, or phospho-S6K activation (Fig. 8E).
FIGURE 6.
α2M·PSA-induced up-regulation of GRP78, PSA, phospho-MEK1/2, phospho-ERK1/2, phospho-p38 MAPK, phospho-AktThr-308, phospho-AktSer-473, and phospho-S6K in 1-LN prostate cancer cells. A–G, treatments of cells in each panel are as follows: buffer (lane 1), native α2M (50 pm for 20 min) (lane 2), α2M·methylamine (50 pm for 20 min) (lane 3), premade α2M·PSA (50 pm for 20 min) (lane 4), and α2M·PSA made in culture (5 μg/ml for 20 min) (lane 5). □, phospho-AktThr-308; ■, phospho-AktSer-473. Changes in protein levels in each immunoblot are shown in fluorescence units (× 103) as determined by a PhosphorImager and are expressed as mean ± S.E. (error bars) from three independent experiments assayed in triplicate in the bar diagrams above the respective representative immunoblots. Protein loading controls unphosphorylated protein and actin are shown below the respective immunoblot. Values significantly different at the 5% level from buffer- and native α2M-treated cells are marked with an asterisk.
FIGURE 7.
α2M·PSA-induced up-regulation of PSA, GRP78 phospho-MEK1/2, phospho-ERK1/2, phospho-p38 MAPK, phospho-AktThr-308, phospho-AktSer-473, and phospho-S6K in DU-145 prostate cancer cells. A–G, treatments of cells in each panel are as follows: buffer (lane 1), native α2M (50 pm for 20 min) (lane 2), α2M·methylamine (50 pm for 20 min) (lane 3), premade α2M·PSA (50 pm for 20 min) (lane 4), and α2M·PSA made in culture (5 μg/ml for 20 min) (lane 5). □, phospho-AktThr-308; ■, phospho-AktSer-473. Changes in each immunoblot are shown in fluorescent units (× 103) as determined by a PhosphorImager and are expressed as the mean ± S.E. from three independent experiments, each assayed in triplicate in the bar diagrams above the respective immunoblot. The protein loading controls (unphosphorylated protein or actin) are shown below the respective immunoblot. Values significantly different at the 5% level from buffer- and native α2M-treated cells are marked with an asterisk.
FIGURE 8.
Effect of α2M·PSA on levels of PSA, GRP78, phospho-MEK1/2, phospho-ERK1/2, phospho-p38 MAPK, phospho-AktThr-308, phospho-AktSer-473, and phospho-S6K in PC-3 cancer cells. A–G, treatments of cells in each panel are as follows: buffer (lane 1), native α2M (50 pm for 20 min) (lane 2), α2M·methylamine (50 pm for 20 min) (lane 3), premade α2M·PSA (50 pm for 20 min) (lane 4), and α2M·PSA made in culture (5 μg/ml for 20 min (lane 5). □, phospho-AktThr-308; ■, phospho-AktSer-473. Changes in each immunoblot are shown in fluorescence units (× 103) as determined by a PhosphorImager and are expressed as the mean ± S.E. from three independent experiments assayed in triplicate in the bar diagram above the respective immunoblot. The protein loading controls (unphosphorylated protein or actin) are shown below the respective immunoblot.
DISCUSSION
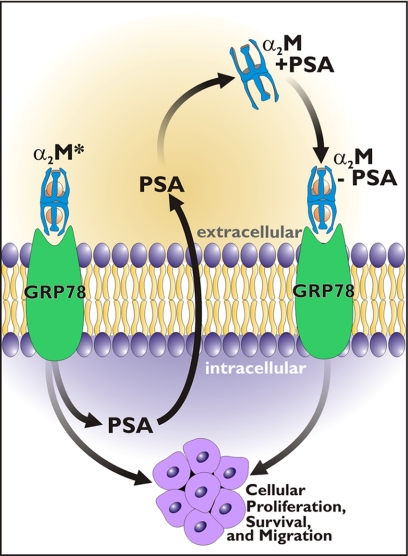
Controversy exists with respect to the value of measuring PSA levels to screen men for the occurrence of previously undetected prostate cancer (1–6). However, PSA levels do correlate with disease progression (1, 6), and targeting PSA may have value in treating the disease (7). The latter observation is intriguing in that it suggest that PSA synthesis by prostate cancer cells represents more than a disease marker. In the present study, we provide a hypothesis as to why production of PSA may correlate with disease progression. In a number of studies, we have demonstrated that cell surface GRP78 is a receptor whose activation triggers proproliferative, promigratory, and antiapoptotic signaling cascades in prostate cancer cells (11–16, 22). Moreover, autoantibodies to GRP78 in the serum of men with prostate cancer indicate a poor prognosis (16–18). Mechanistically, these autoantibodies are agonists that bind to a region in the NH2-terminal domain of GRP78 where the natural ligand α2M* also binds (16). Binding of either α2M* or these autoantibodies promotes autophosphorylation of GRP78. This then triggers Ras/MAPK, phosphatidylinositol 3-kinase/Akt, cAMP-dependent, and other signaling pathways that are proproliferative, promigratory, and antiapoptotic (11–16, 22–26). Interestingly, ligation of cell surface GRP78 promotes its own up-regulation (27). At least one transcription factor, TFII-I has been identified as a promoter of GRP78-dependent up-regulation of various cellular mechanisms (27). By contrast, antibodies directed against the COOH-terminal domain of GRP78 activate pro-apoptotic and anti-proliferative signaling events (23–26). Here we show that ligation of GRP78 by α2M* promotes the synthesis and secretion of PSA in an active form that binds to α2M, producing α2M·PSA complexes. These complexes, as previously shown with α2M·methylamine, promote DNA and protein synthesis by activation of Akt-dependent and other signaling cascades (11–16, 22). Thus, ligation of the NH2-terminal domain of GRP78 by α2M* leads to the synthesis of more α2M*, which in turn drives GRP78 receptor-dependent proproliferative, promigratory, and antiapoptotic signaling mechanism. We propose that PSA is involved in an autoregulatory feedback loop to the advantage of the prostate cancer but to the disadvantage of the host. These observations are summarized in Fig. 9. We have previously demonstrated that there is considerable “cross-talk” between Akt, NFκB, and unfolded protein response signaling, all of which are activated in 1-LN prostate cancer cells treated with α2M* (15). Up-regulation of NFκB signaling is a well characterized mechanism that up-regulates PSA synthesis (28). By contrast, up-regulation of p53 down-regulates PSA synthesis (29). Our results with antibody directed against the COOH-terminal domain in the present study are consistent with these results. Treatment of 1-LN prostate cancer cells with this antibody up-regulates p53 (23, 25), which should down-regulate PSA synthesis as noted above (29).
FIGURE 9.
A schematic representation of α2M-induced synthesis and secretion of PSA. PSA may interact with native α2M originally in the plasma or locally made in the prostate stroma. These complexes bind to cell surface GRP78, inducing cell proliferative and survival signaling.
These studies may shed light on the role of PSA in the progression of prostate cancer. As noted above, the proteinase activity of PSA may be involved in bone remodeling, that characteristic of prostate cancer metastasis (8). PSA is a typical chymotrypsin-like serine proteinase (30). However, other studies suggest that PSA may regulate pro-survival signaling by an unknown mechanism (31). The current study suggests a mechanism for these observations.
These observations raise several other questions. The concentration of α2M in the serum ranges from 1 to 5 μm (10). It is produced by many tissues, including prostate stroma (9). Patients with prostate cancers often demonstrate α2M levels at the lower end of this range, presumably reflecting proteinase-dependent turnover, not a change in synthetic rate (32–34). Consistent with this view, α2M·PSA complexes are detected in the serum of patients with prostate cancer (1, 3). Because the t½ for the clearance of α2M-proteinase complexes is on the order of 2 min (10), the detection of α2M·PSA complexes in serum suggests a very high rate of synthesis.
Taken together, these observations and the results of the present study suggest a high likelihood that the proposed proproliferative/antiapoptotic feedback loop exists in prostate cancers. Finally, we have demonstrated that the binding of α2M* to GRP78 demonstrates a Kd of 50–100 pm, whereas binding to LRP occurs with a Kd of ∼1–5 nm (10, 11). Our studies demonstrate that LRP is not required for GRP78-dependent signal transduction (11). However, recently, Gonias and colleagues (35) have demonstrated that at very high concentrations of α2M*, on the order of 100 nm, proproliferative signaling may be seen. Although one could conceive of such high concentrations in the vicinity of growing prostate cancer cells, they are very high. We therefore suggest that this mechanism is not likely to be a major impact in the biology of prostate cancer. It should be noted that this pathway is irrelevant in the present studies because the 1-LN prostate cell line employed in this study expresses GRP78 in its surface but not LRP (11, 36).
This work was supported, in whole or in part, by National Institutes of Health Grant CA 131235.
- PSA
- prostate-specific antigen
- α2M
- native α2-macroglobulin
- α2M*
- any activated form of α2M that is capable of receptor recognition
- LRP
- LDL receptor-related protein
- anti-CTD antibody
- antibody directed against the COOH-terminal domain of GRP78.
REFERENCES
- 1. Payne H., Cornford P. (2010) Urologic Oncology: Seminars and Original Investigations, doi. 10.1016/j.urolone.2009.11.003 [Google Scholar]
- 2. Stamey T. A., McNeal J. E., Yemoto C. M., Sigal B. M., Johnstone I. M. (1999) JAMA 281, 1395–1400 [DOI] [PubMed] [Google Scholar]
- 3. Kanoh Y., Ohara T., Egawa S., Baba S., Akahoshi T. (2008) J. Clin. Lab. Anal. 22, 302–306 [DOI] [PMC free article] [PubMed] [Google Scholar]
- 4. Ito K. (2009) Int. J. Urol. 16, 458–464 [DOI] [PubMed] [Google Scholar]
- 5. Leman E. S., Getzenberg R. H. (2009) J. Cell. Biochem. 108, 3–9 [DOI] [PubMed] [Google Scholar]
- 6. Barry M. J. (2009) N. Engl. J. Med. 360, 1351–1354 [DOI] [PubMed] [Google Scholar]
- 7. Kantoff P. W., Schuetz T. J., Blumenstein B. A., Glode L. M., Bilhartz D. L., Wyand M., Manson K., Panicali D. L., Laus R., Schlom J., Dahut W. L., Arlen P. M., Gulley J. L., Godfrey W. R. (2010) J. Clin. Oncol. 28, 1099–1105 [DOI] [PMC free article] [PubMed] [Google Scholar]
- 8. Nadiminty N., Lou W., Lee S. O., Mehraein-Ghomi F., Kirk J. S., Conroy J. M., Zhang H., Gao A. C. (2006) Clin. Cancer Res. 12, 1420–1430 [DOI] [PubMed] [Google Scholar]
- 9. Lin V. K., Wang S. Y., Boetticher N. C., Vazquez D. V., Saboorian H., McConnell J. D., Roehrborn C. G. (2005) Prostate 63, 299–308 [DOI] [PubMed] [Google Scholar]
- 10. Wu S. M., Pizzo S. V. (2000) in Hemostasis and Thromboses: Basic Principles and Clinical Practice (Colman R. W., Hirsh J., Marder V. J., Salzman E. W. eds) 4th Ed., pp. 367–386, J. B. Lippincott, Williams & Wilkins, Baltimore [Google Scholar]
- 11. Misra U. K., Gonzalez-Gronow M., Gawdi G., Hart J. P., Johnson C. E., Pizzo S. V. (2002) J. Biol. Chem. 277, 42082–42087 [DOI] [PubMed] [Google Scholar]
- 12. Misra U. K., Pizzo S. V. (2004) Cell. Signal. 16, 487–496 [DOI] [PubMed] [Google Scholar]
- 13. Misra U. K., Gonzalez-Gronow M., Gawdi G., Wang F., Pizzo S. V. (2004) Cell. Signal. 16, 929–938 [DOI] [PubMed] [Google Scholar]
- 14. Misra U. K., Deedwania R., Pizzo S. V. (2005) J. Biol. Chem. 280, 26278–26286 [DOI] [PMC free article] [PubMed] [Google Scholar]
- 15. Misra U. K., Deedwania R., Pizzo S. V. (2006) J. Biol. Chem. 281, 13694–13707 [DOI] [PubMed] [Google Scholar]
- 16. Gonzalez-Gronow M., Cuchacovich M., Llanos C., Urzua C., Gawdi G., Pizzo S. V. (2006) Cancer Res. 66, 11424–11431 [DOI] [PubMed] [Google Scholar]
- 17. Mintz P. J., Kim J., Do K. A., Wang X., Zinner R. G., Cristofanilli M., Arap M. A., Hong W. K., Troncoso P., Logothetis C. J., Pasqualini R., Arap W. (2003) Nat. Biotechnol. 21, 57–63 [DOI] [PubMed] [Google Scholar]
- 18. Arap M. A., Lahdenranta J., Mintz P. J., Hajitou A., Sarkis A. S., Arap W., Pasqualini R. (2004) Cancer Cell 6, 275–284 [DOI] [PubMed] [Google Scholar]
- 19. Bradford M. M. (1976) Anal. Biochem. 72, 248–254 [DOI] [PubMed] [Google Scholar]
- 20. Misra U. K., Pizzo S. V. (2010) Cancer Biol. Ther. 9, 142–152 [DOI] [PubMed] [Google Scholar]
- 21. Otto A., Bär J., Birkenmeier G. (1998) J. Urol. 159, 297–303 [DOI] [PubMed] [Google Scholar]
- 22. Misra U. K., Gonzalez-Gronow M., Gawdi G., Pizzo S. V. (2005) J. Immunol. 174, 2092–2097 [DOI] [PubMed] [Google Scholar]
- 23. Misra U. K., Mowery Y., Kaczowka S., Pizzo S. V. (2009) Mol. Cancer Ther. 8, 1350–1362 [DOI] [PubMed] [Google Scholar]
- 24. Misra U. K., Pizzo S. V. (2009) Apoptosis 15, 173–182 [DOI] [PubMed] [Google Scholar]
- 25. Misra U. K., Pizzo S. V. (2010) Biochem. Biophys. Res. Commun. 391, 272–276 [DOI] [PubMed] [Google Scholar]
- 26. Misra U. K., Kaczowka S., Pizzo S. V. (2010) Biochem. Biophys. Res. Commun. 392, 538–542 [DOI] [PubMed] [Google Scholar]
- 27. Misra U. K., Wang F., Pizzo S. V. (2009) J. Cell Biochem. 106, 381–389 [DOI] [PubMed] [Google Scholar]
- 28. Chen C. D., Sawyers C. L. (2002) Mol. Cell Biol. 22, 2862–2870 [DOI] [PMC free article] [PubMed] [Google Scholar]
- 29. Gurova K. V., Roklin O. W., Krivokrysenko V. I., Chumakov P. M., Cohen M. B., Feinstein E., Gudkov A. V. (2002) Oncogene 21, 153–157 [DOI] [PubMed] [Google Scholar]
- 30. LeBeau A. M., Singh P., Isaacs J. T., Denmeade S. R. (2009) Biochemistry 48, 3490–3496 [DOI] [PMC free article] [PubMed] [Google Scholar]
- 31. Nicotera T. M., Schuster D. P., Bourhim M., Chadha K., Klaich G., Corral D. A. (2009) The Prostate 69, 1270–1280 [DOI] [PubMed] [Google Scholar]
- 32. Ohtani H., Saito M., Koshiba K. (1985) Oncology 42, 341–344 [DOI] [PubMed] [Google Scholar]
- 33. Kanoh Y., Ohtani N., Mashiko T., Ohtani S., Nishikawa T., Egawa S., Baba S., Ohtani H. (2001) Anticancer Res. 21, 551–556 [PubMed] [Google Scholar]
- 34. Kanoh Y., Ohtani N., Ohara T., Mashiko T., Ohtani S., Egawa S., Baba S., Ohtani H. (2001) Oncol. Rep. 8, 515–519 [DOI] [PubMed] [Google Scholar]
- 35. Mantuano E., Mukandala G., Li X., Campana W. M., Gonias S. L. (2008) J. Biol. Chem. 283, 19904–19911 [DOI] [PMC free article] [PubMed] [Google Scholar]
- 36. Asplin I. R., Misra U. K., Gawdi G., Gonzalez-Gronow M., Pizzo S. V. (2000) Arch. Biochem. Biophys. 383, 135–141 [DOI] [PubMed] [Google Scholar]


