Abstract
Glycolipid transfer protein (GLTP) accelerates glycolipid intermembrane transfer via a unique lipid transfer/binding fold (GLTP fold) that defines the GLTP superfamily and is the prototype for functional GLTP-like domains in larger proteins, i.e. FAPP2. Human GLTP is encoded by the single-copy GLTP gene on chromosome 12 (12q24.11 locus), but regulation of GLTP gene expression remains completely unexplored. Herein, the ability of glycosphingolipids (and their sphingolipid metabolites) to regulate the transcriptional expression of GLTP via its promoter has been evaluated. Using luciferase and GFP reporters in concert with deletion mutants, the constitutive and basal (225 bp; ∼78% G+C) human GLTP promoters have been defined along with adjacent regulatory elements. Despite high G+C content, translational regulation was not evident by the mammalian target of rapamycin pathway. Four GC-boxes were shown to be functional Sp1/Sp3 transcription factor binding sites. Mutation of one GC-box was particularly detrimental to GLTP transcriptional activity. Sp1/Sp3 RNA silencing and mithramycin A treatment significantly inhibited GLTP promoter activity. Among tested sphingolipid analogs of glucosylceramide, sulfatide, ganglioside GM1, ceramide 1-phosphate, sphingosine 1-phosphate, dihydroceramide, sphingosine, only ceramide, a nonglycosylated precursor metabolite unable to bind to GLTP protein, induced GLTP promoter activity and raised transcript levels in vivo. Ceramide treatment partially blocked promoter activity decreases induced by Sp1/Sp3 knockdown. Ceramide treatment also altered the in vivo binding affinity of Sp1 and Sp3 for the GLTP promoter and decreased Sp3 acetylation. This study represents the first characterization of any Gltp gene promoter and links human GLTP expression to sphingolipid homeostasis through ceramide.
Keywords: Gene Regulation, Gene Transcription, Glycolipids, Lipid Binding Protein, Sphingolipid, Transcription Regulation
Introduction
Glycolipid transfer proteins (GLTPs)2 are small (∼24 kDa), soluble, single-polypeptide proteins that selectively accelerate the intermembrane transfer of glycolipids (1). Compared with other lipid transfer/binding proteins, human GLTP exhibits a unique conformational fold (2–4), serves as the prototype and founding member of the GLTP superfamily (5, 6), and has a membrane interaction domain that differs from the C1, C2, FYVE, pleckstrin homology, and PX domains found in many peripheral and amphitropic proteins (7–11). The GLTP fold occurs widely among eukaryotes (12) and endows larger proteins, i.e. FAPP2 (phosphoinositol 4-phosphate adaptor protein-2) (13), with key functionality during synthesis of complex glycosphingolipids (GSLs), which serve as important signaling and structural components of raft microdomains in plasma membranes (14–16).
Despite the significance of the GLTP fold, the in vivo function(s) of GLTP remains unsettled. GLTP resides in the cytoplasm (17, 18), a favorable location for interaction with newly synthesized glucosylceramide (GlcCer) generated by GlcCer synthase on the cytoplasmic face of the Golgi (19, 20). However, GlcCer destined for higher GSL synthesis is transferred through the Golgi by FAPP2, which contains a C-terminal GLTP-like domain, rather than by GLTP (13). RNAi knockdown of GLTP in the presence of the vesicle trafficking inhibitor, brefeldin A, suggests a role in GlcCer trafficking to the plasma membrane (21). Yet, GLTP docking with vesicle-associated membrane protein-associated proteins of the endoplasmic reticulum also appears possible as well as action as an intracellular glycolipid sensor involved in GSL homeostasis (1, 17, 18).
In the present study, our goal was to evaluate GLTP gene expression within the context of GSL metabolic homeostasis by determining if alterations in key sphingolipid metabolites trigger changes in GLTP transcription, as regulated by its previously uncharacterized GLTP gene promoter. Recently, we characterized human GLTP, a single-copy gene on chromosome 12 (12q24.11) (12). GLTP mRNA matures via classic cis-splicing into 5-exon transcripts, a highly conserved organizational pattern in therian mammals and other vertebrates (12). The discovery of an unusually G+C-rich CpG island in the 5′-UTR of GLTP indicated possible regulation by transcriptional factors that bind to GC boxes, e.g. Sp1 (specific protein-1)/Sp3 (22, 23). The present study provides the first insights into human GLTP transcriptional regulation, including characterization of constitutive and basal GLTP promoter (GenBankTM accession no. GU971358) and adjacent regulatory regions. Promoter analyses using luciferase and GFP reporters as well as in vivo analyses by real-time PCR and other approaches show GLTP regulation via mechanistic participation of Sp1/Sp3 transcription factors in a manner influenced by ceramide but not by related sphingolipid metabolites.
EXPERIMENTAL PROCEDURES
Cell Culture
HEK 293T, HeLa, and T47D cells (American Type Culture Collection, Rockville, MD) were cultured at 37 °C under 5% CO2 in DMEM (Mediatech Inc, Herndon VA) supplemented with 10% heat-inactivated fetal bovine serum (Innovative Research, Inc., Novi, MI). To assess human GLTP promoter regulation in response to increasing endogenous ceramide, HeLa cells were transfected with pGL3(−1150/+19) and then treated with vehicle (0.1% DMSO) or with GlcCer synthase inhibitor, d-threo-1-phenyl-2-decanoylamino-3-morpholino-1-propanol (PDMP; Sigma-Aldrich) at 10 μm for 24 h before measuring luciferase activity. To reduce endogenous ceramide and assess the effect on human GLTP promoter activity, HeLa cells were transfected with pGL3(−1150/+19) for 8 h before replenishing with fresh DMEM medium and treating with (dihydro)-ceramide synthase inhibitor, fumonisin B1 (FB1; Sigma-Aldrich) for 40 h at 25 μm. To elevate endogenous ceramide levels, cells were treated with PDMP for 24 h at 10 μm. To analyze the effect of C6-ceramide treatment on endogenous ceramide levels, cells were grown to ∼60% confluency and then treated with 10 μm C6-ceramide for 24 h. Endogenous ceramide levels were assessed by HPLC mass spectrometry (Lipidomics Core, Medical University of South Carolina, Charleston, SC).
5′-Rapid Amplification of cDNA Ends Assay (RACE)
Total RNA was isolated from HeLa cells using TRIzol reagent (Invitrogen). Transcriptional start sites were identified by FirstChoice RNA ligase-mediated rapid amplification of cDNA ends (RLM-RACE, Ambion, Inc., Austin, TX). Master-AmpTM Tth DNA polymerase and PCR enhancer (Epicenter, Madison, WI) were used for 70 °C reverse transcription. Herculase® II fusion DNA polymerase (Stratagene, La Jolla CA) supplemented with betaine (Sigma-Aldrich) was used for standard PCR amplification. Primer Ra1 and Ra2 were used for first and second round PCR amplifications (supplemental Table S1). Reaction products were separated by 1.2% agarose gel electrophoresis before cloning in pGEM-T (Promega, Madison, WI) and sequencing (Genewiz, South Plainfield, NJ).
Promoter Constructs
Human genomic DNA from normal blood (Promega), primer pairs Pt1/Pt2 (supplemental Table S1) designed for Homo sapiens contig. NT_009775.16 sequence, and Herculase® II fusion DNA polymerase plus betaine were used for PCR amplification of GC-rich regions within and upstream of human GLTP exon 1 (12, 24). Inclusion of enhancers (e.g. betaine) dramatically improves PCR efficiency of GLTP (33) presumably by disruption of secondary structure, i.e. hairpins, that are common in GC-rich regions. To study promoter activity, a 1169-bp PCR fragment (Phr1/Phr2), was amplified by using pGEM-T-1491 plasmid as the template (supplemental Table S1) and then inserted into phrGFP vector (Stratagene) containing humanized recombinant GFP (hrGFP) gene and no known eukaryotic promoter or enhancer element, via BamHI and EcoRI restriction sites, to generate phrGFP(−1150/+19) plasmid. To map the human GLTP promoter, a 1350-bp fragment (amplified with primer pair PG1/PG2) and a 1169-bp fragment (PG1/PG3) were amplified (supplemental Table S1) and ligated into the promoterless Firefly luciferase reporter vector pGL3-basic (Promega) via KpnI and HindIII restriction sites, to generate pGL3(−1150/+200) and pGL3(−1150/+19) plasmids, respectively. To construct 5′ deletion mutants, fragments of 5627 bp (primer pair PL1/APL1), 5303 bp (PL2/APL1), 5207 bp (PL3/APL1), 5141 bp (PL4/APL1), 5075 bp (PL5/APL1), 5004 bp (PL6/APL1), and 4917 bp (PL7/APL1) were amplified in pGL3(−1150/+19) (supplemental Table S1). Products were purified and self-ligated to generate pGL3 plasmids with inserts (−836/+19), (−512/+19), (−416/+19), (−350/+19), (−284/+19), (−213/+19), and (−126/+19). Similarly, to construct 3′ deletion mutants, fragments of 5032 bp (primer pair Ds1/Da1), 4969 bp (Ds1/Da2), and 4928 bp (Ds1/-Da3) were amplified in pGL3(−350/+19) (supplemental Table S1). Products were purified and self-ligated to generate pGL3 plasmids with (−350/−91), (−350/−154), and (−350/−195) inserts. Deletion mutants were confirmed by sequencing (Genewiz).
Mutagenesis of Sp1/Sp3 Binding Sites
Mutants, generated by QuikChange XL site-directed mutagenesis (Stratagene), were verified by sequencing (Genewiz). Basal promoter (pGL3 −350/+19) was used as template for amplification.
Dual-Luciferase Assays
HEK 293T, HeLa, and T47D cells, grown to ∼60% confluency, were transfected with firefly luciferase construct (0.6 μg) and internal control Renilla luciferase construct, pRL-TK (20:1 ratio). Luciferase activities were measured after 48 h (Promega). pGL3-basic served as a promoterless negative control.
Fluorescence Microscopy
HEK 293T cells, in six-well plates at 60% confluence, were transfected with phrGFP or phrGFP(−1150/+19) (2 μg) using ExpressfectTM (Denville Scientific, Inc., South Plainfield, NJ). After 48 h, cells were fixed with 4% paraformaldehyde for 20 min at room temperature and washed with PBS (pH 7.4). Nuclei were stained with 300 nm DAPI (Sigma-Aldrich). Cells were imaged using an epifluorescence microscope (Leica, Mannheim, Germany).
EMSA
5′-Biotin-labeled, single-strand probes were synthesized by Sigma. Double-stranded oligonucleotide probes were generated by incubating equimolar amounts of complementary oligonucleotides in STE annealing buffer (10 mm Tris-HCl, pH 7.5, 50 mm NaCl, 1 mm EDTA) for 3 min at 95 °C, slow cooling to room temperature, and storing (−20 °C). EMSA reaction mixtures were incubated in 5× binding buffer (Promega) on ice for 10 min with or without unlabeled competitor, prior to adding end-labeled oligonucleotides for 20 min on ice. For supershift assays, HeLa cell nuclear extracts (Promega) were incubated on ice for 10 min with anti-Sp1 (PEP-2) and anti-Sp3 (D-20) antibody (Santa Cruz Biotechnology) prior to addition of end-labeled oligonucleotides for 30 min on ice and electrophoresis on a 5% nondenaturing polyacrylamide gels in Tris borate-EDTA buffer (0.5×) at 70 V for 30 min at 4 °C and then at 120 V for ∼60 min. Binding reactions were analyzed by transferring to Biodyne B precut modified nylon membrane (Pierce) at 350 mA for 60 min, cross-linking for 5 min using UV light (312 nm bulb), and fixing at 80 °C for 60 min before detection with biotin-labeled DNA using light-shift electrophoretic mobility shift reagent (Pierce). Antibody-protein complexes were observed as supershifted or immunodepleted complexes.
ChIP
Chromatin isolated from HeLa cells was used in ChIP assays performed according to the manufacturer's instructions (Upstate Biotech., Lake Placid, NY). For amplification of the GLTP promoter, primer pairs CH-1/CH-2 (first round) and CH-3/CH-4 (second round) were used for nested PCR. Primer pair Ne-1/Ne-2 (first and second PCR rounds), designed to amplify +489/+707 of human GLTP exon 5, served as control lacking Sp1/Sp3 binding sites. Herculase® polymerase plus betaine, was used for PCR amplification. Cycling conditions were: 2 min at 98 °C; 25 cycles of 98 °C for 20 s, 63 °C for 20 s, and 72 °C for 30 s; and final extension at 72 °C for 3 min.
Immunoprecipitation and Western Blot Analysis
Cells were treated with Pierce classic immunoprecipitation kit (Thermo Scientific) according to manufacturer's instructions and then were analyzed by Western blot analysis. Cells were extracted using Mammalian Cell-PE LBTM buffer (G-Biosciences, Maryland Heights, MO), separated by SDS-PAGE, transferred onto nitrocellulose membranes, incubated with rabbit anti-β-actin, anti-eIF4E, anti-phospho-Ser65 4E-BP1, anti-Sp1 (PEP-2), anti-Sp3 (D-20) antibody (Santa Cruz Biotechnology), anti-acetylated lysine (Cell Signaling, Danvers, MA) or chicken multiclonal anti-GLTP (Bio-Synthesis, Lewisville, TX), followed by horseradish peroxidase conjugates of goat anti-mouse antibodies, goat anti-rabbit antibodies (Thermo Scientific), or goat anti-chicken antibodies (Aves Labs, Inc., Tigard, OR), respectively, visualized using SuperSignal West Pico Chemiluminescent substrate (Thermo Scientific), and exposed to Kodak BioMax film. Bands were imaged by scanning densitometry (Epson V700 Dual Lens System, Seiko Epson, Long Beach, CA), were quantified using Quantity One® software (Bio-Rad), and were expressed as the ratio between proteins of interest and β-actin.
RNA Interference
eIF4E translation was silenced by transfecting HeLa cells with eIF4E siRNA (Cell Signaling; 25 nm) using TransIT-siQUESTTM (Mirus, Madison, WI) and analyzing for exogenous protein expression level after 48 h. Sp1/Sp3 siRNA (Santa Cruz Biotechnology) were used to knockdown Sp1 or Sp3. Nonspecific siRNA served as control.
Lipid Effects on GLTP Promoter Activity
HeLa cells were transfected with different plasmid constructs for 24 h and then replenished with fresh medium. C6-ceramide, C6-dihydroceramide, C8-ceramide 1-phospate, C18-sphingosine, C18-sphingosine-1-phosphate, C8-glucosylceramide, ganglioside GM1 or C12-3-sulfo-galactosylceramide (Avanti Polar Lipids, Alabaster, AL), dissolved in DMSO, were added to the medium to final concentrations of 5 and 10 μm. Luciferase activity was measured using the Dual-Luciferase reporter assay system 24 h after lipid treatment. To assess the regulatory role of acetylation, HeLa cells were transfected with pGL3(−1150/+19) and, after 24 h, treated with trichostatin A (TSA; dissolved in DMSO and added to medium to 100 ng/ml final concentration), or with C6-ceramide (10 μm) and TSA for 24 h. Luciferase activity was measured using the dual luciferase reporter assay system.
Real-time RT-PCR
Total RNA, isolated from HeLa cells using RNeasy Plus minikits (Qiagen, Valencia, CA) and TRIzol reagent, was reverse-transcribed with Superscript III (Invitrogen). Real-time RT-PCR was performed using TaqMan Gene Expression assays (ID Hs00829505_g1 for human GLTP gene and ID Hs99999903_m1 for the β-actin gene; Applied Biosystems, Foster City, CA).
Statistical Analysis
Three to six independent experiments were always performed, and the Student's t test was used to compare mean values and generate standard errors using Excel (Microsoft, Redmond, WA).
RESULTS
Human GLTP Transcriptional Start Sites
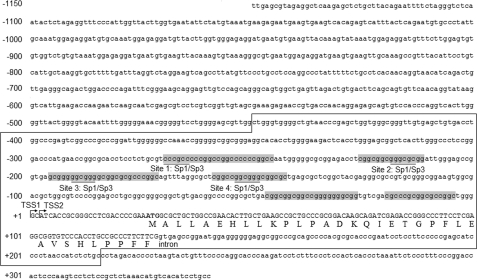
RLM-RACE is designed to utilize only full-length, capped mRNA during amplification of cDNA, facilitating accurate identification of transcriptional start sites (TSS) (25, 26). To identify the TSSs of human GLTP, we performed RLM-RACE PCR using mRNA from HeLa cells and GLTP-specific primers (supplemental Table S1). A single cDNA band of ∼400 bases was obtained and cloned into T vector for DNA sequencing (supplemental Fig. S1). Ten randomly selected clones revealed TSSs located 26 bases (TSS1, seven clones) and 24 bases (TSS2, three clones) from the translation initiating ATG codon of human GLTP (Fig. 1). Similar results were obtained with HEK 293T cells (data not shown), indicating that human GLTP can be transcribed from more than one start sites but that TSS1 represents the major start site.
FIGURE 1.
Nucleotide sequence of the human GLTP promoter and the downstream region. The major transcriptional start site is indicated by the arrow at position +1. The coding sequence of the first exon is shown in uppercase letters with the corresponding amino acid sequence below. Sp1/Sp3 transcription factor binding sites are underlined. The predicted CpG island is boxed. Regions ≥15 bases in length with 100% G+C content are shaded.
Human GLTP Promoter
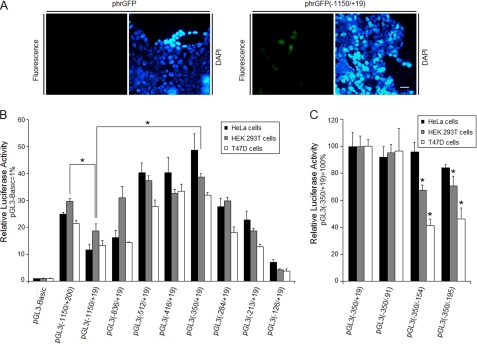
To define the human GLTP promoter, the −1150/+19 region (relative to major transcriptional start site) was inserted into promoterless phrGFP. Fig. 2A shows that cells transfected with phrGFP(−1150/+19) became fluorescent after 48 h but not when mock-transfected with empty phrGFP. Similar results were obtained in HeLa and HEK 293T cells, indicating a functional promoter in the −1150/+19 region of the human GLTP gene.
FIGURE 2.
Human GLTP promoter functional characterization. A, identification of the GLTP promoter. Epifluorescence micrographs of HEK 293T cells transfected with phrGFP (−1150/+19), or phrGFP (negative control) for 48 h. DAPI (300 nm) was used to stain the nucleus. The scale bar represents 20 μm. B, 5′ deletion analysis of the GLTP promoter in HeLa, HEK 293T, and T47D cells. Human GLTP promoter-firefly luciferase constructs were used to transfect all three cell lines. Cotransfection of Renilla luciferase plasmid (pRL-TK) served as internal control for normalization of firefly luciferase activity. Numbering is relative to the major transcriptional start site. C, 3′ deletion analysis of the (−350/+19) region of the GLTP promoter in the same three cell lines. Control pGL3(−350/+19) values are set to 100 for all three cell lines. Luciferase activity was normalized to Renilla luciferase activity. Numbering is relative to the major transcriptional start site. Bars represent the means ± S.E. of three to six determinations. *, p < 0.05.
Next, the basal and proximal regulatory regions of the GLTP promoter were characterized by constructing a series of luciferase reporter plasmids containing 5′ deletions of the putative (−1150/+19) promoter region and transfecting into HeLa, HEK 293T, and T47D cells along with Renilla luciferase reporter as internal control. Deletion of sequence between −1150 and −350 increased transcriptional activity by 2- to 3-fold over pGL3(−1150/+19) in the different cell lines (Fig. 2B), suggesting a negative regulatory region upstream of −350. In contrast, pGL3(−1150/+200) transcriptional activity was higher than that of pGL3(−1150/+19), consistent with a positive regulatory region between +19 and +200 (Fig. 2B). Deletion to position −350 did not significantly change the promoter activity compared with pGL3(−416/+19). Additional sequence deletion between −350 and −126 resulted in continuous, stable reduction of promoter activity (Fig. 2B), suggesting that the 225-bp region −350/−126 is the GLTP basal promoter. Further analyses, involving 3′ deletions of the putative promoter, were performed in different cell lines (Fig. 2C). Compared with pGL3(−350/+19), promoter activity for pGL3(−350/−154) decreased ∼30% in HEK 293T cells and ∼55% in T47D cells. With pGL3(−350/−195), promoter activity also decreased in HeLa (∼15%), HEK 293T (∼30%) and T47D cells (∼52%), suggesting important regulatory elements are located in the −350/−91 region.
GLTP Expression Is Not Regulated by mTOR Signaling Pathway
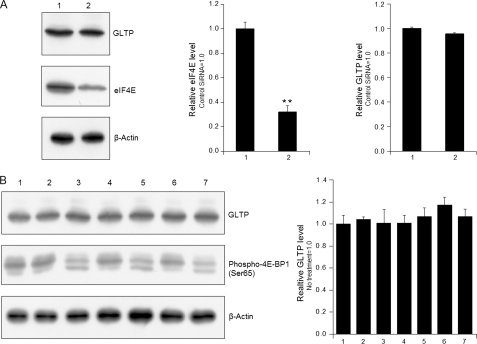
A notable characteristic of human GLTP promoter is the extremely high G+C content, which is 79.54% for −416/+19 and 76.13% for the entire CpG island. Human GLTP also contains an extremely long first intron and the 5′ and 3′ regions of the first exon are highly G+C-rich. These features raised the issue of whether human GLTP falls into a gene class regulated at the translational level (27). With such mRNAs, the highly structured 5′-UTRs require eIF4E binding to the mRNA cap structure to mediate initiation of translation, thus facilitating efficient scanning and start codon recognition and enhancing translation of these mRNAs (27, 28). As shown in Fig. 3, A and B, neither RNAi suppression of eIF4E by 3- to 4-fold nor rapamycin treatment decreased GLTP levels despite phospho-Ser65 4E-BP1 decrease, which enhances eIF4E and 4E-BP1 binding, preventing assembly into eIF4F complex and inhibiting cap-dependent translation. The results show that GLTP gene expression is not regulated by the mTOR (mammalian target of rapamycin) signaling pathway.
FIGURE 3.
Analyses of translational regulation of GLTP gene expression. A, suppression of eIF4E by RNAi does not significantly decrease GLTP protein levels. Lane 1, control siRNA; lane 2, eIF4E-specific siRNA. B, rapamycin does not significantly inhibit human GLTP expression. HeLa cells were grown to ∼60% confluency before adding rapamycin (100 nm in 0.1% DMSO) for 2, 4, and 6 h. Lysates were subjected to Western blot analysis using anti-GLTP, anti-phospho-Ser65 4E-BP1 and anti-β-actin. Lane 1, no treatment; lane 2, DMSO (0.1%), 2 h; lane 3, rapamycin, 2 h; lane 4, DMSO (0.1%), 4 h; lane 5, rapamycin, 4 h; lane 6, DMSO (0.1%), 6 h; lane 7, rapamycin, 6 h. The density of GLTP protein bands was determined using the Quantity One program. eIF4E and GLTP levels were normalized to β-actin levels (internal control). Bars represent the means ± S.E. of three to six determinations. **, p < 0.01.
Sp1 and Sp3 Bind to Multiple Sites in Human GLTP Promoter and Silencing Reduces Activity
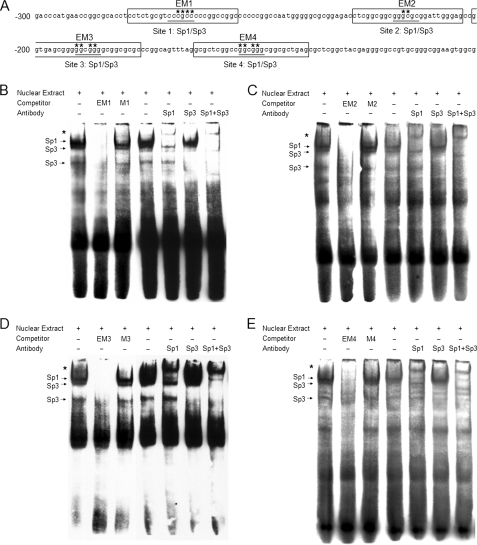
Bioinformatics analyses indicated that the 225-bp region (−350/−126) lacked canonical CCAAT and TATA boxes but contained consensus binding sites for various other transcription factors including Sp1/Sp3. To determine whether GC-boxes functioned as viable binding sites for Sp1 and Sp3, nuclear extracts from HeLa cells were analyzed by EMSA. As shown in Fig. 4, bound biotin-labeled probe showed several labeled bands. Binding specificity was confirmed by the significantly decreased intensity resulting from incubation with 100-fold excess of unlabeled probe and the lack of intensity change by incubation with a 100-fold excess of unlabeled mutated probes. A major, low mobility Sp1 complex was observed, which supershifted upon addition of Sp1-specific antibody (Fig. 4). Furthermore, in the presence of Sp3-specific antibody, the supershifted band became very faint, the intensity of the major complex decreased, and the lower Sp3 complex disappeared, indicating competitive binding by Sp3. When both Sp1 and Sp3 antibodies were added, the intensity of the major complex was dramatically decreased, and the lower Sp3 complex again disappeared (Fig. 4). The binding affinity hierarchy for Sp1/Sp3 was as follows: −191/−186 > −270/−265 > −219/−214 > −154/−149 based on staining density. Collectively, the EMSA analyses demonstrate that the GC-boxes located on the GLTP proximal promoter do serve as binding sites for Sp1 and Sp3.
FIGURE 4.
EMSA showing Sp1/Sp3 transcription factor binding to four sites in the human GLTP promoter. Gel supershift analyses were performed with HeLa nuclear extracts and biotin-labeled probe. Competitive gel shift assays were performed in the presence of 100-fold molar excess of unlabeled double-strand oligonucleotides. Supershift analysis using specific antibodies anti-Sp1, anti-Sp3, and control assays were performed without antibody. The arrows show specific binding. Asterisks indicate supershifted bands in B, C, D, and E. A, locations of EMSA probes. Numbering is relative to the major transcriptional start site. Sp1/Sp3 transcription factor binding sites are underlined. Primers EM1, EM2, EM3, and EM4 are boxed. Asterisks show mutated nucleotides position in primers M1, M2, M3, and M4. B, EMSA for −270/−265 binding site. C, EMSA for −219/−214 binding site. D, EMSA for −191/−186 binding site. E, EMSA for −154/−149 binding site.
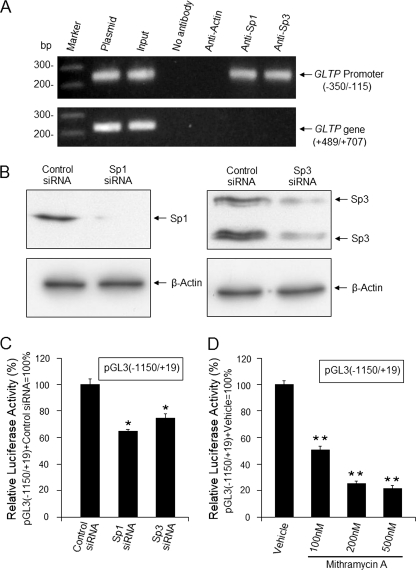
The in vivo binding status of Sp1 and Sp3 was assessed by ChIP. As shown in Fig. 5A, the human GLTP promoter was immunoprecipitated by either Sp1 or Sp3 antibody, but not by β-actin antibody. Plasmid controls as well as sheared and cross-linked input DNA served as templates for positive control bands (Fig. 5A). No signal was observed using a control primer pair specific for the GLTP exon 5 region (Fig. 5A). The results clearly show in vivo binding of Sp1/Sp3 to the proximal region of the GLTP promoter.
FIGURE 5.
Regulation of human GLTP promoter by Sp1 and Sp3 transcription factors. A, Sp1 and Sp3 binding to the GLTP promoter in vivo. ChIP assays were performed using DNA from HeLa cells as sources of the human GLTP promoter and specific antibodies for Sp1, Sp3, or β-actin. GLTP promoter region (−350/−115) containing putative Sp1/Sp3 binding sites was amplified by nested PCR as described under “Experimental Procedures.” The human GLTP exon 5 fragment (+489/+707), amplified using primer pair Ne-1/Ne-2, served as control lacking Sp1/Sp3 binding sites. Amplification controls were as follows: cross-linked, sheared DNA prior to immunoprecipitation (input); plasmid carrying (−350/−115) or (+489/+707) was used as template (plasmid). B and C, down-regulation of Sp1/Sp3 by siRNA knockdown reduces GLTP promoter activity. Cells transfected with pGL3(−1150/+19) were grown for 24 h, transfected with Sp1/Sp3 siRNA (25 nm), and grown for an additional 24 h before Western blot analysis and measurement of luciferase activity. D, mithramycin A treatment down-regulates Sp1/Sp3 expression and decreases GLTP promoter activity. Cells transfected with pGL3 (−1150/+19) were grown 24 h, treated with mithramycin A (0, 100, 200, or 500 nm) for 24 h, and analyzed for luciferase activity (normalized to Renilla luciferase activity). Vehicle, 0.1% DMSO. Bars show the means ± S.E. of three to six determinations in HeLa cells. *, p < 0.05; **, p < 0.01.
To directly assess the effect of Sp1/Sp3 on GLTP promoter activity, siRNA was used to knock down Sp1 and Sp3 expression (Fig. 5B). Down-regulation of Sp1/Sp3 expression resulted in a 27∼35% reduction in GLTP promoter activity (Fig. 5C). Treatment with mithramycin A, a drug that binds GC-rich regions of DNA and blocks Sp1 binding (29), also reduced GLTP promoter activity (Fig. 5C). Taken together, the data show regulation of human GLTP gene expression by Sp1/Sp3.
Sp1/Sp3 Binding Site Mutation at −219/−214 of GLTP Promoter Inhibits Transcriptional Activity
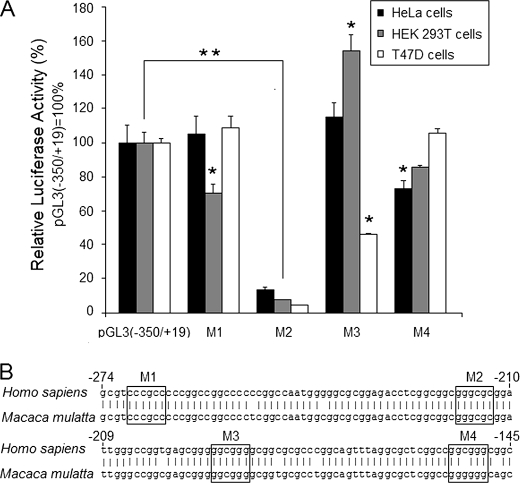
The contribution of representative Sp1/Sp3 binding sites were defined by site-directed mutagenesis. Because previous EMSA indicated that the mutated oligonucleotide duplexes could not compete for transcription factor binding, we concluded these mutant probes could not bind transcription factors Sp1/Sp3. As shown in Fig. 6A, site mutation of −219/−214 had a strong negative effect on GLTP promoter activity; whereas mutations at −270/−265, −191/−186, and −154/−149 had only mild effects on promoter activity. Interestingly, in T47D cells, significantly decreased GLTP promoter activity resulted from mutation at −191/−186, but not in HeLa cells and HEK 293T cells (Fig. 6A). BLAST searches of the GLTP 5′-flanking sequence of H. sapiens and Macaca mulatta showed conservation of all four Sp1/Sp3 binding sites except for a single base substitution at the (−154/−149) binding site (Fig. 6B; M4). Thus, the −219/−214 Sp1/Sp3 binding site, but not the −270/−265, −191/−186, and −154/−149 sites, is a key regulator of human GLTP promoter activity.
FIGURE 6.
Mutation of Sp1/Sp3 binding site at −219/−214 is detrimental to GLTP promoter activity. A, mutational analysis of the (−350/+19) region of the human GLTP promoter. Luciferase activities obtained with binding site mutations correspond to M1 (−270/−265), M2 (−219/−214), M3 (−191/−186), and M4 (−154/−149), respectively. Control pGL3(−350/+19) values are set to 100 for all three cell lines and were normalized to Renilla luciferase activity. Bars represent the means ± S.E. of three to six determinations. *, p < 0.05; **, p < 0.01. B, alignment of the GLTP partial promoter regions of H. sapiens and M. mulatta showing the conservation of transcription factor binding sites. Numbering is relative to the major transcriptional start site.
Ceramide Increases Human GLTP Promoter Activity and in Vivo Transcript Levels
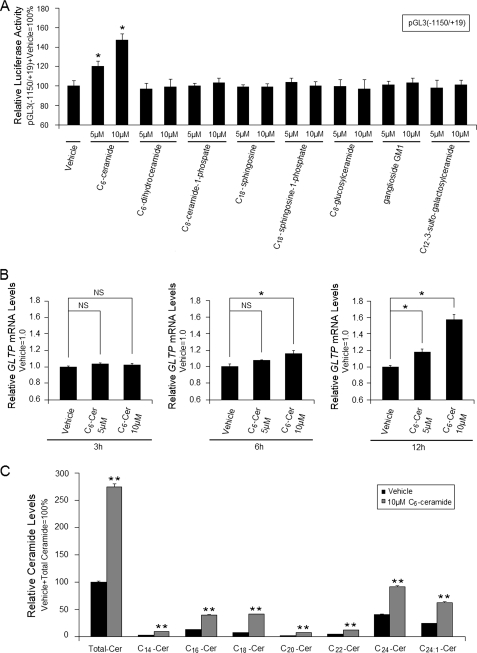
During the past decade, important signaling roles have emerged for nonglycosylated and glycosylated sphingolipids (15). To determine whether various glycosylated and nonglycosylated sphingolipids regulate GLTP promoter activity, HeLa cells were transfected with pGL3(−1150/+19) and then incubated with either C6-ceramide, C6-dihydroceramide, C8-ceramide 1-phosphate, C18-sphingosine, C18-sphingosine 1-phosphate, C8-glucosylceramide, ganglioside GM1, or C12-3-sulfo-galactosylceramide. Fig. 7A shows that only C6-ceramide significantly increased pGL3(−1150/+19) luciferase activity (∼20–47%). C6-ceramide treatment also resulted in the following: (i) elevated GLTP transcript levels in vivo (Fig. 7B); (ii) elevated endogenous long chain ceramide levels (Fig. 7C); (iii) mitigated decreases in GLTP promoter activity induced by Sp1/Sp3-siRNA (∼58–61%) or by mithramycin A (∼42–66%) (supplemental Fig. S2, A and B).
FIGURE 7.
Ceramide increases human GLTP promoter activity. Elevated endogenous ceramide level increases GLTP expression. A, comparison of the effects of various sphingolipids on GLTP promoter activity. HeLa cells were transfected with pGL3(−1150/+19) and then treated with different lipids. Luciferase activity was measured 24 h after lipid treatment and was normalized to Renilla luciferase activity. B, real-time PCR analyses of ceramide-induced GLTP transcript level up-regulation in vivo. Cells were grown to ∼60% confluency and then were treated with 0, 5, or 10 μm C6-ceramide for 3, 6, or 12 h before harvesting for real-time RT-PCR analyses. GTLP mRNA levels were normalized to β-actin mRNA levels. C, effect of C6-ceramide on endogenous ceramide levels. Cells were grown to ∼60% confluency, and then cells were treated with 10 μm C6-ceramide for 24 h and analyzed for their ceramide species content by HPLC-MS as described under “Experimental Procedures.” Results were normalized to cell lipid phosphate. GTLP mRNA levels were normalized to β-actin mRNA levels. Cer, ceramide. Bars represent the means ± S.E. of three to six determinations, *, p < 0.05 compared with cells treated with vehicle (0.1% DMSO), respectively. **, p < 0.01.
Sp1 and Sp3 Involvement in Ceramide-induced Up-regulation of GLTP
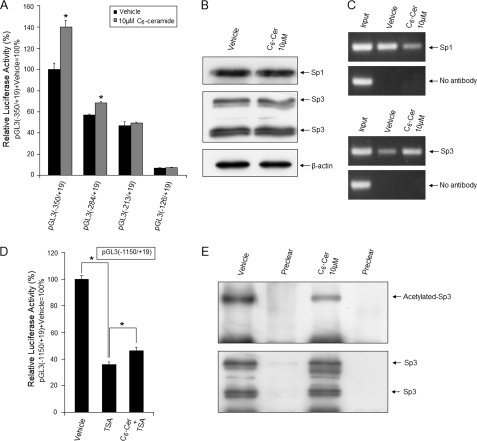
Truncations of the GLTP promoter enabled mapping of the ceramide-response region. As shown in Fig. 8A, ceramide treatment increased the activity of pGL3(−284/+19) by ∼20%, but had no effect on pGL3(−213/+19) or pGL3(−126/+19), suggesting that the −350/−213 region contains a ceramide response element. To gain further insights in vivo, the effect of ceramide treatment on expression levels of endogenous Sp1 and Sp3 was assessed, but no significant changes were observed (Fig. 8B). However, ChIP analyses revealed that ceramide treatment alters the in vivo binding affinity of Sp1 and Sp3 for GLTP, resulting in lower Sp1 binding but higher Sp3 binding (Fig. 8C). Because acetylation of Sp3 and Sp1 is known to regulate their binding (30–32), and ceramide treatment can alter Sp acetylation status (33, 34), we used TSA to increase Sp acetylation levels and found GLTP promoter activity to be diminished by ∼60–65% (Fig. 8D). TSA alters Sp3/Sp1 acetylation by inhibiting lysine deacetylases, originally referred to as histone deacetylases (31, 35, 36). Ceramide treatment attenuated the TSA-induced loss of GLTP promoter activity (Fig. 8C) and significantly reduced in vivo levels of acetylated-Sp3 (Fig. 8E) without affecting acetylation status of Sp1 (supplemental Fig. S3). Collectively, the data show regulation of GLTP expression via Sp1/Sp3 by a complex mechanism that responds to elevated ceramide levels.
FIGURE 8.
Mechanistic link between Sp1/Sp3 and ceramide-induced up-regulation of human GLTP promoter activity. A, deletion analyses of GLTP promoter to localize ceramide response region. HeLa cells were transfected with different constructs for 24 h and then treated with C6-ceramide (10 μm). Luciferase activity was measured 24 h after lipid treatment. *, p < 0.05 compared with cells treated with vehicle (0.1% DMSO), respectively. Luciferase activity was normalized to Renilla luciferase activity. B, ceramide treatment does not alter the endogenous levels of Sp1 or Sp3. HeLa cells were grown with or without C6-ceramide (10 μm) for 24 h. Sp1, Sp3, and β-actin levels in cell extracts were analyzed by Western blot analysis. C, ceramide treatment alters the Sp1 or Sp3 binding affinity to the GLTP promoter. ChIP assays were performed using DNA from HeLa cells and treated with vehicle (DMSO) or C6-ceramide (10 μm) for 24 h. Immunoprecipitation of DNA-Sp1 or DNA-Sp3 complexes were performed using antibodies specific for Sp1 and Sp3. Amplification of GLTP promoter region(−350/−115) was performed as described under “Experimental Procedures.” D, TSA-induced decrease in GLTP promoter activity is partially blocked by ceramide. HeLa cells were transfected with pGL3(−1150/+19) for 24 h and then treated with TSA (100 ng/ml) and C6-ceramide (10 μm). After 24 h, luciferase activity was measured. *, p < 0.05. E, ceramide decreases acetylated Sp3 levels. HeLa cells were grown with or without C6-ceramide (10 μm) for 24 h. After immunoprecipitation with Sp3 antibody, acetylated Sp3 levels were determined by Western blot analysis (acetylated lysine antibody). Specific binding is indicated by preclearing with beads containing no antibody. Vehicle, 0.1% DMSO; Cer, ceramide. Bars represent the mean ± S.E. of three to six determinations.
DISCUSSION
This investigation represents the first characterization of any Gltp gene promoter and provides the first insights into the regulation of human GLTP gene expression. BLAST searches show the GLTP promoter to be highly conserved in primates, but less so in Carnivora, Cetartiodactyla, and rodents, suggesting relatively recent and potentially important evolutionary developments within the human GLTP promoter. Our earlier study of GLTP gene organization, tissue transcript levels, and phylogenetic/evolutionary relationships revealed orthologs in all vertebrate genomes and encoded within a highly conserved five-exon/four-intron mRNA organizational pattern (12). In humans, two single-copy genes occur. The 12q24.11 gene (GLTP) accounts for all detectable GLTP transcript (12). In contrast, a complete GLTP ORF (94% homology) on human chromosome 11 (11p15.1) and present only in primates, is a transcriptionally silent pseudogene (GLTPP1) based on methylation analyses of CpG islands and well controlled PCR analyses. An unexpected outcome was the discovery of a 5′-UTR in GLTP with a CpG island unusually G+C-rich. The high number of GC boxes revealed by on-line Transcription Element Search System analysis of the GLTP promoter prompted our focus on regulation by Sp1/Sp3.
The very high G+C content (∼76% for entire CpG island, including exon 1 ORF; ∼80% for −416/+19) also raised the issue of whether GLTP might belong to a class of genes that are very efficiently transcribed (37) and translationally regulated in mammalian cells. In such genes, the G+C-rich 5′-UTRs are highly structured and require eIF4E binding to the mRNA cap to initiate translation (27, 28). However, GLTP levels were unaffected by RNAi knockdown of eIF4E or by rapamycin treatment, indicating a lack of significant regulation by the mTOR signaling pathway. The outcome could reflect the rather short 5′-UTR length of GLTP transcript. RLM-RACE PCR revealed more than one transcription start site, consistent with the observed lack of canonical CCAAT and TATA boxes (38, 39). Nonetheless, the major start site (TSS1) in 7 of 10 clones was only 26 bp upstream of the mRNA start codon. Such a short 5′-UTR length could help avoid highly structured conformation(s) and the need for eIF4E involvement in mediating initiation of GLTP translation.
By luciferase reporter analyses, we demonstrated a 1169-bp (−1150/+19) region relative to TSS1 to be transcriptionally active in HeLa, HEK 293T, and T47D cells. 5′ and 3′ mutational deletion analyses suggested a negative regulatory region upstream of −350, a positive regulatory region (+19/+200), and a basal GLTP promoter (−350/−126). The 225-bp core promoter is active in HeLa, HEK 293T, and T47D cells. However, among these cells, differential regulation involving regions upstream of the core promoter may occur (Figs. 2 and 6). Future studies will be needed to elucidate the molecular basis of the differences as well as the role of other predicted transcription factor sites (including other Sp1/Sp3 sites) in the regulation of GLTP promoter in a tissue-specific context.
What is clear is that the GLTP promoter can be regulated by Sp1/Sp3 as shown by the 27∼35% reduction in activity after Sp1/Sp3 knockdown by RNAi or mithramycin A treatment. Sp1 and Sp3 interaction with GLTP GC-boxes is evident in vitro and in vivo as assessed by EMSA and ChIP, respectively. Sp1 binding to GC-box elements is known to occur via zinc finger domains and enables RNA polymerase II binding to the transcription initiation site in TATA-boxless promoters (40–43) such as occurs in GLTP. More than 20 potential Sp1/Sp3 binding sites are predicted by the on-line Transcription Element Search System program within the −350/−213 region that also could contribute to the ceramide response. Our EMSA analyses establish the following hierarchy of binding affinity among the four sampled GC-boxes: (−191/−186 > −270/−265 > −219/−214 > −154/−149). However, GC-box mutation indicated that site −219/−214 is essential for maximal GLTP promoter activity.
Because Sp transcription factors regulate many housekeeping, tissue-specific, viral, and inducible genes, involvement of Sp1/Sp3 in GLTP promoter regulation is hardly surprising given its high G+C content. Although Sp3 can either activate or repress, Sp1 more often activates gene promoters. For the GLTP promoter, Sp1 and Sp3 both serve as activators, as indicated by RNAi knockdown and mithramycin A treatment. Adding to the complexity is the potential role of Sp1-like KLF proteins (44) and co-regulatory transcription activator factors, able to bind to the gluatamine and serine/threonine-rich regions of Sp1 proteins, and be recruited to the multiprotein preinitiation complex during interaction with gene promoters. Transcription activator factors are known to confer cell type-specific promoter selectivity, but their involvement in the regulation of the GLTP promoter remains to be determined (45, 46). It is clear that the involvement of these other factor(s) in GLTP transcriptional regulation cannot be excluded.
We were surprised by the lack of GLTP promoter regulation by monoglycosylated ceramides (GlcCer or sulfatide) because GLTP is known to transport simple glycosylated sphingolipids in vivo (21). Instead, nonglycosylated C6-ceramide induced significantly increased GLTP expression, an effect not duplicated by dihydroceramide, ceramide 1-phosphate, sphingosine, or sphingosine 1-phosphate. Treatment of cells with C6-ceramide elevates endogenous long chain ceramide levels by as much as 10-fold by 6 h while maintaining 5-fold elevation at 24 h (47). The elevation in endogenous ceramide is a consequence of remodeling by the sphingolipid salvage pathway (48). Treatment of cells with 1-phenyl-2-decanoylamino-3-morpholino-1-propanol, an inhibitor of GlcCer synthase known to elevate endogenous ceramide levels (49–51), also increased GLTP promoter activity (supplemental Fig. S4A) and elevated transcript levels (supplemental Fig. S4B). However, treatment with fumonisin B1, which is known to reduce endogenous ceramide levels (52–54), did not affect human GLTP expression, as assessed by promoter (luciferase) activity (supplemental Fig. S4C) and GLTP transcript levels (supplemental Fig. S4D).
It is noteworthy that elevated ceramide not only up-regulates GLTP promoter activity but also mitigates decreases in promoter activity induced by Sp1/Sp3 knockdown. Interestingly, ceramide treatment does not alter endogenous levels of Sp1 and Sp3 but rather, their binding affinity for the GLTP promoter. Furthermore, in the case of Sp3, the altered binding affinity can be linked to ceramide-induced changes in acetylated Sp3 levels in vivo. Thus, our results suggest that ceramide treatment can affect the GLTP promoter in two ways: (i) by altering Sp1/Sp3 binding affinity and (ii) by altering Sp3 acetylation status. Our findings are supported by recent work showing that ceramide regulates transcriptional activity of human telomerase reverse transcriptase in A549 human lung adenocarcinoma cells by changes in Sp3 acetylation status (34). The ability of ceramide treatment to alter gene expression by promoter regulation has also been noted for human glucosylceramide synthase, c-Myc, surfactant protein B, and matrix metallopeptidase 2 (e.g. Refs. 55–60).
From the standpoint of GSL metabolism, it is noteworthy that the promoter activity of the GlcCer synthase gene increases in response to C6-ceramide treatment by a mechanism involving Sp1 (52, 54). A ceramide-stimulated increase in GlcCer synthase, involving coordinate elevation of GLTP gene expression, could provide an effective means for adjusting intracellular ceramide levels while maintaining cellular GSL homeostasis. Increased GLTP would be expected to compete with FAPP2, which normally transfers newly synthesized GlcCer from the cis-medial Golgi using its pleckstrin homology domain to target the trans-Golgi, the site of complex GSL synthesis (13). The lack of a pleckstrin homology domain in GLTP minimizes specific targeting to the trans-Golgi. Thus, up-regulation of GLTP could enable GlcCer to be siphoned away from the trans-Golgi, preventing elevation of downstream GSL levels in the biosynthetic pathway, from lactosylceramide to complex gangliosides. In such a way, elevated GLTP levels could help to maintain complex GSL homeostasis during periods of elevated ceramide levels.
The link that we observe between sphingolipid homeostasis and GLTP expression via ceramide-responsive, Sp1/Sp3-mediated, transcriptional regulation of GLTP is an intriguing development, given the lack of effect elicited by other powerful sphingolipid signaling metabolites, i.e. ceramide 1-phosphate, sphingosine 1-phosphate, or sphingosine. The characterization of the human GLTP promoter and the fundamental insights into human GLTP transcriptional regulation undoubtedly will aid future elucidation of normal and pathological conditions involving GLTP expression.
Supplementary Material
This work was supported, in whole or in part, by National Institutes of Health/NIGMS Grant 45928 and National Institutes of Health/NCI Grant 121493. This work was also supported by The Hormel Foundation.

The on-line version of this article (available at http://www.jbc.org) contains supplemental Table 1 and Figs. S1–S4.
- GLTP
- glycolipid transfer protein
- GlcCer
- glucosylceramide
- DMSO
- dimethyl sulfoxide
- hrGFP
- humanized recombinant GFP
- TSS
- transcriptional start site
- TSA
- trichostatin A.
REFERENCES
- 1. Brown R. E., Mattjus P. (2007) Biochim. Biophys. Acta 1771, 746–760 [DOI] [PMC free article] [PubMed] [Google Scholar]
- 2. Malinina L., Malakhova M. L., Teplov A., Brown R. E., Patel D. J. (2004) Nature 430, 1048–1053 [DOI] [PMC free article] [PubMed] [Google Scholar]
- 3. Malinina L., Malakhova M. L., Kanack A. T., Lu M., Abagyan R., Brown R. E., Patel D. J. (2006) PLoS Biol. 4, e362. [DOI] [PMC free article] [PubMed] [Google Scholar]
- 4. Airenne T. T., Kidron H., Nymalm Y., Nylund M., West G., Mattjus P., Salminen T. A. (2006) J. Mol. Biol. 355, 224–236 [DOI] [PubMed] [Google Scholar]
- 5. Murzin A. G., Brenner S. E., Hubbard T., Chothia C. (1995) J. Mol. Biol. 247, 536–540 [DOI] [PubMed] [Google Scholar]
- 6. Madera M., Vogel C., Kummerfeld S. K., Chothia C., Gough J. (2004) Nucleic Acids Res. 32, D235–239 [DOI] [PMC free article] [PubMed] [Google Scholar]
- 7. Rao C. S., Chung T., Pike H. M., Brown R. E., (2005) Biophys. J. 89, 4017–4028 [DOI] [PMC free article] [PubMed] [Google Scholar]
- 8. Cho W., Stahelin R. V. (2005) Annu. Rev. Biophys. Biomol. Struct. 34, 119–151 [DOI] [PubMed] [Google Scholar]
- 9. Hurley J. H. (2006) Biochim. Biophys. Acta 1761, 805–811 [DOI] [PMC free article] [PubMed] [Google Scholar]
- 10. Lomize A. L., Pogozheva I. D., Lomize M. A., Mosberg H. I. (2007) BMC Struct. Biol. 7, 44. [DOI] [PMC free article] [PubMed] [Google Scholar]
- 11. Lemmon M. A. (2008) Nat. Rev. Mol. Cell Biol. 9, 99–111 [DOI] [PubMed] [Google Scholar]
- 12. Zou X., Chung T., Lin X., Malakhova M. L., Pike H. M., Brown R. E. (2008) BMC Genomics 9, 72. [DOI] [PMC free article] [PubMed] [Google Scholar]
- 13. D'Angelo G., Polishchuk E., Di Tullio G., Santoro M., Di Campli A., Godi A., West G., Bielawski J., Chuang C. C., van der Spoel A. C., Platt F. M., Hannun Y. A., Polishchuk R., Mattjus P., De Matteis M. A. (2007) Nature 449, 62–67 [DOI] [PubMed] [Google Scholar]
- 14. Regina Todeschini A., Hakomori S. I. (2008) Biochim. Biophys. Acta 1780, 421–433 [DOI] [PMC free article] [PubMed] [Google Scholar]
- 15. Hannun Y. A., Obeid L. M. (2008) Nat. Rev. Mol. Cell Biol. 9, 139–150 [DOI] [PubMed] [Google Scholar]
- 16. Wennekes T., van den Berg R. J., Boot R. G., van der Marel G. A., Overkleeft H. S., Aerts J. M. (2009) Angew. Chem. Int. Ed. Engl. 48, 8848–8869 [DOI] [PubMed] [Google Scholar]
- 17. Lin X., Mattjus P., Pike H. M., Windebank A. J., Brown R. E. (2000) J. Biol. Chem. 275, 5104–5110 [DOI] [PMC free article] [PubMed] [Google Scholar]
- 18. Tuuf J., Mattjus P. (2007) Biochim. Biophys. Acta 1711, 1353–1363 [DOI] [PubMed] [Google Scholar]
- 19. Futerman A. H., Riezman H. (2005) Trends Cell Biol. 15, 312–318 [DOI] [PubMed] [Google Scholar]
- 20. Futerman A. H. (2006) Biochim. Biophys. Acta 1758, 1885–1892 [DOI] [PubMed] [Google Scholar]
- 21. Halter D., Neumann S., van Dijk S. M., Wolthoorn J., de Mazière A. M., Vieira O. V., Mattjus P., Klumperman J., van Meer G., Sprong H. (2007) J. Cell Biol. 179, 101–115 [DOI] [PMC free article] [PubMed] [Google Scholar]
- 22. Zhao C., Meng A. (2005) Dev. Growth Differ. 47, 201–211 [DOI] [PubMed] [Google Scholar]
- 23. Li L., Davie J. R. (2010) Ann. Anat. 192, 275–283 [DOI] [PubMed] [Google Scholar]
- 24. Chakrabarti R., Schutt C. E. (2001) Gene 274, 293–298 [DOI] [PubMed] [Google Scholar]
- 25. Maruyama K., Sugano S. (1994) Gene 138, 171–174 [DOI] [PubMed] [Google Scholar]
- 26. Schaefer B. C. (1995) Anal. Biochem. 227, 255–273 [DOI] [PubMed] [Google Scholar]
- 27. De Benedetti A., Graff J. R. (2004) Oncogene 23, 3189–3199 [DOI] [PubMed] [Google Scholar]
- 28. Graff J. R., Konicek B. W., Carter J. H., Marcusson E. G. (2008) Cancer Res. 68, 631–634 [DOI] [PubMed] [Google Scholar]
- 29. Blume S. W., Snyder R. C., Ray R., Thomas S., Koller C. A., Miller D. M. (1991) J. Clin. Invest. 88, 1613–1621 [DOI] [PMC free article] [PubMed] [Google Scholar]
- 30. Braun H., Koop R., Ertmer A., Nacht S., Suske G. (2001) Nucleic Acids Res. 29, 4994–5000 [DOI] [PMC free article] [PubMed] [Google Scholar]
- 31. Ammanamanchi S., Freeman J. W., Brattain M. G. (2003) J. Biol. Chem. 278, 35775–35780 [DOI] [PubMed] [Google Scholar]
- 32. Swingler T. E., Kevorkian L., Culley K. L., Illman S. A., Young D. A., Parker A. E., Lohi J., Clark I. M. (2010) Biochem. J. 427, 391–400 [DOI] [PubMed] [Google Scholar]
- 33. Wooten-Blanks L. G., Song P., Senkal C. E., Ogretmen B. (2007) FASEB J. 21, 3386–3397 [DOI] [PubMed] [Google Scholar]
- 34. Wooten L. G., Ogretmen B. (2005) J. Biol. Chem. 280, 28867–28876 [DOI] [PubMed] [Google Scholar]
- 35. Yang X. J., Seto E. (2008) Nat. Rev. Mol. Cell Biol. 9, 206–218 [DOI] [PMC free article] [PubMed] [Google Scholar]
- 36. Norris K. L., Lee J. Y., Yao T. P. (2009) Sci. Signal. 2, pe76. [DOI] [PMC free article] [PubMed] [Google Scholar]
- 37. Kudla G., Lipinski L., Caffin F., Helwak A., Zylicz M. (2006) PLoS Biol. 4, e180. [DOI] [PMC free article] [PubMed] [Google Scholar]
- 38. Azizkhan J. C., Jensen D. E., Pierce A. J., Wade M. (1993) Crit. Rev. Eukaryot. Gene Expr. 3, 229–254 [PubMed] [Google Scholar]
- 39. Gross P., Oelgeschläger T. (2006) Biochem. Soc. Symp. 73, 225–236 [DOI] [PubMed] [Google Scholar]
- 40. Suske G. (1999) Gene 238, 291–300 [DOI] [PubMed] [Google Scholar]
- 41. Vinogradov A. E. (2003) Nucleic Acids Res. 31, 1838–1844 [DOI] [PMC free article] [PubMed] [Google Scholar]
- 42. Li L., He S., Sun J. M., Davie J. R. (2004) Biochem. Cell Biol. 82, 460–471 [DOI] [PubMed] [Google Scholar]
- 43. Safe S., Abdelrahim M. (2005) Eur. J. Cancer 41, 2438–2448 [DOI] [PubMed] [Google Scholar]
- 44. Lomberk G., Urrutia R. (2005) Biochem. J. 392, 1–11 [DOI] [PMC free article] [PubMed] [Google Scholar]
- 45. Müller F., Demény M. A., Tora L. (2007) J. Biol. Chem. 282, 14685–14689 [DOI] [PubMed] [Google Scholar]
- 46. Thomas K., Wu J., Sung D. Y., Thompson W., Powell M., McCarrey J., Gibbs R., Walker W. (2007) Mol. Cell Endocrinol. 270, 1–7 [DOI] [PubMed] [Google Scholar]
- 47. Ogretmen B., Pettus B. J., Rossi M. J., Wood R., Usta J., Szulc Z., Bielawska A., Obeid L. M., Hannun Y. A. (2002) J. Biol. Chem. 277, 12960–12969 [DOI] [PubMed] [Google Scholar]
- 48. Kitatani K., Idkowiak-Baldys J., Hannun Y. A. (2008) Cell. Signal. 20, 1010–1018 [DOI] [PMC free article] [PubMed] [Google Scholar]
- 49. Rani C. S., Abe A., Chang Y., Rosenzweig N., Saltiel A. R., Radin N. S., Shayman J. A. (1995) J. Biol. Chem. 270, 2859–2867 [DOI] [PubMed] [Google Scholar]
- 50. Abe A., Radin N. S., Shayman J. A., Wotring L. L., Zipkin R. E., Sivakumar R., Ruggieri J. M., Carson K. G., Ganem B. (1995) J. Lipid Res. 36, 611–621 [PubMed] [Google Scholar]
- 51. Lee L, Abe A., Shayman J. A. (1999) J. Biol. Chem. 274, 14662–14669 [DOI] [PubMed] [Google Scholar]
- 52. Wang E., Norred W. P., Bacon C. W., Riley R. T., Merrill A. H., Jr. (1991) J. Biol. Chem. 266, 14486–14490 [PubMed] [Google Scholar]
- 53. Merrill A. H., Jr., Sullards M. C., Wang E., Voss K. A., Riley R. T. (2001) Environ. Health Perspect. 109, 283–289 [DOI] [PMC free article] [PubMed] [Google Scholar]
- 54. Stockmann-Juvala H., Savolainen K. (2008) Hum. Exp. Toxicol. 27, 799–809 [DOI] [PubMed] [Google Scholar]
- 55. Debret R., Brassart-Pasco S., Lorin J., Martoriati A., Deshorgue A., Maquart F. X., Hornebeck W., Rahman I., Antonicelli F. (2008) Biochim. Biophys. Acta 1783, 1718–1727 [DOI] [PubMed] [Google Scholar]
- 56. Alesse E., Zazzeroni F., Angelucci A., Giannini G., Di Marcotullio L., Gulino A. (1998) Cell Death Differ. 5, 381–389 [DOI] [PubMed] [Google Scholar]
- 57. Hannun Y. A., Obeid L. M. (2002) J. Biol. Chem. 277, 25847–25850 [DOI] [PubMed] [Google Scholar]
- 58. Uchida Y., Itoh M., Taguchi Y., Yamaoka S., Umehara H., Ichikawa S., Hirabayashi Y., Holleran W. M., Okazaki T. (2004) Cancer Res. 64, 6271–6279 [DOI] [PubMed] [Google Scholar]
- 59. Sparkman L., Chandru H., Boggaram V. (2006) Am. J. Physiol. Lung Cell Mol. Physiol. 290, L351–L358 [DOI] [PubMed] [Google Scholar]
- 60. Liu Y. Y., Yu J. Y., Yin D., Patwardhan G. A., Gupta V., Hirabayashi Y., Holleran W. M., Giuliano A. E., Jazwinski S. M., Gouaze-Andersson V., Consoli D. P., Cabot M. C. (2008) FASEB J. 22, 2541–2551 [DOI] [PubMed] [Google Scholar]
Associated Data
This section collects any data citations, data availability statements, or supplementary materials included in this article.


