

Abstract
The reactive advanced glycation end product (AGE) precursor methylglyoxal (MGO) and MGO-derived AGEs are associated with diabetic vascular complications and also with an increase in oxidative stress. Glyoxalase-I (GLO-I) transgenic rats were used to explore whether overexpression of this MGO detoxifying enzyme reduces levels of AGEs and oxidative stress in a rat model of diabetes. Rats were made diabetic with streptozotocin, and after 12 weeks, plasma and multiple tissues were isolated for analysis of AGEs, carbonyl stress, and oxidative stress. GLO-I activity was significantly elevated in multiple tissues of all transgenic rats compared with wild-type (WT) littermates. Streptozotocin treatment resulted in a 5-fold increase in blood glucose concentrations irrespective of GLO-I overexpression. Levels of MGO, glyoxal, 3-deoxyglucosone, AGEs, and oxidative stress markers nitrotyrosine, malondialdehyde, and F2-isoprostane were elevated in the diabetic WT rats. In diabetic GLO-I rats, glyoxal and MGO composite scores were significantly decreased by 81%, and plasma AGEs and oxidative stress markers scores were significantly decreased by ∼50%. Hyperglycemia induced a decrease in protein levels of the mitochondrial oxidative phosphorylation complex in the gastrocnemius muscle, which was accompanied by an increase in the lipid peroxidation product 4-hydroxy-2-nonenal, and this was counteracted by GLO-I overexpression. This study shows for the first time in an in vivo model of diabetes that GLO-I overexpression reduces hyperglycemia-induced levels of carbonyl stress, AGEs, and oxidative stress. The reduction of oxidative stress by GLO-I overexpression directly demonstrates the link between glycation and oxidative stress.
Keywords: Diabetes, Endothelium, Metabolism, Oxidative Stress, Rat, Glycation, Glyoxalase-1, Methylglyoxal
Introduction
Prolonged exposure to hyperglycemia has detrimental effects on various cellular functions and is believed to be the most important factor in the development of vascular complications in diabetes. One of the hypotheses about how hyperglycemia leads to complications is the formation of advanced glycation end products (AGEs)3 (1). In addition to the formation of AGEs by the classical Maillard reaction (2, 3), dicarbonyls such as methylglyoxal (MGO), glyoxal (GO), and 3-deoxyglucocone (3-DG) are also known to form AGEs. MGO is probably the most important precursor in this formation of AGEs (4). This highly reactive oxo-aldehyde is formed mainly by the non-enzymatic and enzymatic fragmentation of the triose phosphates glyceraldehyde 3-phosphate and dihydroxy-acetone phosphate. MGO reacts primarily with arginine residues to form the major AGEs, hydroimidazolone (MG-H1), argpyrimidine (AP) and tetrahydropyrimidine (THP), and with lysine residues to minor AGEs such as Nϵ-(1-carboxyethyl)lysine (CEL). MGO is efficiently detoxified by the glyoxalase system. In this pathway MGO reacts with reduced glutathione (GSH) to a hemithioacetal adduct and then to S-d-lactoyl-glutathione, which is catalyzed by glyoxalase-I (GLO-I). This product is converted into d-lactate by glyoxalase-II, thereby reforming the consumed GSH. A similar reaction with glyoxal can take place via the intermediate S-glycolyl-glutathione (5). Overexpression of GLO-I prevents the accumulation of MGO and AGEs in endothelial cells exposed to high glucose concentration in vitro, indicating that GLO-I plays an important role in the suppression of AGE formation under hyperglycemic condition (6).
Among other adverse effects, MGO induces dysfunction of mitochondrial respiration (7) and increases the production of reactive oxygen species (ROS) (8, 9). Also, the decrease of GLO-I activity by an inhibitor results in altered cellular function (10–12). Recently Schlotterer et al. (13) showed that GLO-I overexpression in Caenorhabditis elegans decreased hyperglycemia-induced accumulation of AGEs and oxidative stress and enhanced lifespan.
Nevertheless, in higher organisms the in vivo effect of GLO-I overexpression on hyperglycemia induced AGE formation, and ROS production has not yet been studied. Therefore, in this study we investigated the phenotype of diabetic transgenic rats with a GLO-I overexpression. We hypothesized that these rats will have less MGO and MGO-derived adducts in comparison with their wild-type diabetic littermates and that this would have beneficial effects on the formation of hyperglycemia-induced ROS production.
EXPERIMENTAL PROCEDURES
Glyoxalase-I Transgenic Rats
To generate the human GLO-I transgene construct, the entire coding sequence of human GLO-I cDNA was cloned into the EcoRI site of the pBsCAG-2. The GLO-I transgene, isolated by digestion of pBsCAG-2 containing GLO-I cDNA with KpnI and SacI, was microinjected into one pronucleus of fertilized Wistar eggs followed by transfer into the oviducts of pseudopregnant rats. The procedure used was comparable with the generation of glyoxalase-I-overexpressing mice (14). Rat genomic DNA extracted from tail tissue was used to detect the transgene by PCR using specific primers for GLO-I or pBsCAG-2 vector. Primers for cytomegalovirus enhancer sense (5′-GTC GAC ATT GAT TAT TGA CTA G-3′) and antisense (5′-CCA TAA GGT CAT GTA CTG-3′) amplified a 350-bp fragment. Primers for the fragment containing human GLO-I gene and 3′ junction of vector, sense (5′-GTA GTG TGG GTG ACT CCT CCG TTC CTT GGG-3′) and antisense (5′-TCG AGG GAT CTT CAT AAG AGA AGA G-3′), amplified a 1200-bp fragment. PCR amplification was carried out with an initial denaturation at 94 °C for 2 min followed by 35 cycles of 95 °C for 30 s, 55 or 58 °C for 30 s, and 72 °C for 30 or 75 s.
Induction of Diabetes with Streptozotocin
All animal studies were carried out in accordance with the Guide for the Care and Use of Laboratory Animals of the National Institutes of Health. All experiments involving rats were reviewed and approved by the ethics committee for animal care and use of the Maastricht University, The Netherlands.
Wild-type rats (WtD, n = 9) and transgenic GLO-I rats (TgD, n = 8) were made diabetic by intravenous injection of streptozotocin (65 mg/kg of body weight). Weight- and age-matched control rats (WtC, n = 9) and transgenic GLO-I rats (TgC, n = 8) were not injected. Blood glucose levels were monitored at base line and after 1 and 12 weeks. Only streptozotocin-injected rats with a fasting blood glucose level above 15 mm after 1 and 12 weeks were included in the study as diabetic. Body weight, food and fluid intake, urine production, and urinary creatinine levels were measured at base line and after 12 weeks. Three months after the induction of diabetes, rats were sacrificed, and multiple tissues were processed for analysis. Samples from various organs were fixed in 4% neutral-buffered formaldehyde, embedded in paraffin, and sectioned at 4-μm thickness. Blood samples were collected at the time of sacrifice for hematological and biochemical analyses. Tissues (50 mg) from wild-type or GLO-I transgenic rats were homogenized in 1 ml of 0.1 m sodium phosphate buffer, pH 7.0, containing 0.02% Triton X-100 and centrifuged at 20,000 × g for 20 min at 4 °C. The supernatant was used as a tissue lysate to assess GLO-I protein expression with Western blotting and GLO-I activity.
Glyoxalase-I Activity Measurement
GLO-I activity was assayed by spectrophotometry by monitoring the increase in absorbance at 240 nm due to the formation of S-d-lactoyl-glutathione for 10 min at 37 °C according to the method by McLellan et al. (15).
Preparation of Anti-MGO Antibodies
MGO keyhole limpet hemocyanin (KLH) was prepared by the reaction of MGO (10 mm) with KLH for 7 days at 37 °C and was used as the antigen for the immunization of mice. MGO-KLH was emulsified in an equal volume of Freund's complete adjuvant, and three mice were intradermally injected at multiple sites. The mice were boosted with the same amount of MGO-KLH emulsified in Freund's incomplete adjuvant 21 days later, and antisera were obtained 14 days after the booster were tested. The booster was repeated twice. Ten days after the final booster, antisera were tested with MGO-albumin, and the mouse with the highest titer was used for fusion. We obtained 40 positive clones as tested with MGO-albumin, and one of them was further characterized. This monoclonal antibody was from the IgG1 subclass and has an at least 1000-fold preference for tetrahydropyrimidine (THP) as compared with argpyrimidine (AP) or 5-hydro-5-methyl-4-imidazolone (MG-H1).
Preparation of MGO-albumin
Human serum albumin (6.8 mg) was dialyzed against phosphate buffer (0.1 m) and filtrated through a 0.45-μm filter followed by incubation in a phosphate buffer (0.2 m), pH 7.8, with different concentrations of MGO (0.5–10 mm).
MGO-albumin ELISA
In a competitive ELISA performed at room temperature, each well was coated with 100 μl of 0.1 mg/ml MGO-albumin, as prepared by the incubation of albumin with 0.5 mm MGO for 2 days in PBS for 1 h at room temperature or overnight at 4 °C. This MGO-albumin preparation was also used as standard in the competitive ELISA. To each well 50 μl of the antibody (anti-THP (1:2,000) or anti-MG-H1 (1:100,000) and 50 μl of standard or plasma sample to be tested were added. After incubation for 1 h and 3 washes with PBS-Tween, the wells were incubated with 100 μl of peroxidase-labeled goat-anti-mouse (1:5000, Dako, Glostrup, Denmark) for 1 h. Finally, the wells were washed 5 times with PBS-Tween, and the substrate was developed with 100 μl of tetramethylbenzidine. The reaction was stopped with 100 μl of 0.5 m H2SO4. The extinction at 450 nm was measured with a multichannel spectrophotometer (SLT Microplate reader, Wilten Bioteknika, Etten-Leur, The Netherlands). Plasma levels were expressed as arbitrary units, and 1 unit was defined as the antibody-reactive material equivalent to 1 μg of the MGO-albumin standard.
Measurement of Oxo-aldehydes and AGEs
Blood samples were collected in 0.8 m perchloric acid, and concentrations of the dicarbonyls MGO and GO were determined by reversed-phase high performance liquid chromatography (HPLC) with fluorescence detection after derivatization to their respective dimethoxyquinoxaline derivatives (16). Concentrations of the dicarbonyl 3-DG were measured with HPLC tandem mass spectrometry after derivatization with dinitrophenylhydrazine (17).
In addition, protein-bound Nϵ-(1-carboxy-methyl)lysine (CML) and CEL were measured in plasma by HPLC tandem mass spectrometry (18). Protein-bound argpyrimidine was measured by HPLC with fluorescent detection with the same sample preparation as described by Scheijen et al. (19) for pentosidine.
Measurement of d-Lactate and Markers of Oxidative Stress
d-Lactate was measured in blood and urine by an enzymatic assay with spectrophotometric quantification (20). 8-Isoprostane (21) and malondialdehyde (MDA) (22) levels were measured in rat urine by HPLC with MS-MS or fluorescence detection, respectively.
Western Blot Analysis of Mitochondrial Proteins and Oxidative Stress Markers
Western blot analyses were performed in muscle homogenates of the gastrocnemius muscle using an antibody mixture (MS601; MitoSciences, Eugene, OR) against structural components of four of the five oxidative phosphorylation complexes (i.e. to the ND6 subunit of complex I, the 30-kDa Ip subunit of complex II, the 47-kDa core protein 2 of complex III, and the α-subunit of the F1F0 ATP synthase of complex V).
In the whole muscle homogenates, we also analyzed uncoupling protein-3, adenine nucleotide translocase 1 (MSA02; MitoSciences), and 4-hydroxy-2-nonenal (4-HNE) (JAICA, Fukuroi, Japan) protein content by Western blotting according to Hoeks et al. (23). The nitric oxide oxidation product, peroxynitrite (polyclonal nitrotyrosine antibody from, Calbiochem), was detected in kidney lysates. In brief, upon homogenization in lysis buffer containing 1% Nonidet P-40, 0.5% sodium dodecyl sulfate, 1 mmol/l phenylmethylsulfonyl fluoride, and 4% complete inhibitor mixture, lysates were processed for Western blotting. After incubation with the appropriate secondary antibodies, protein-specific bands were detected and quantified with the Odyssey Infrared Imager (LI-COR; Westburg, Leusden, The Netherlands) or the Chemidoc Imager (Bio-Rad) and expressed as -fold change to the wild-type control group.
Statistical Analysis
Differences between groups in levels of each marker examined were tested using one-way analysis of variance. Post-hoc Bonferroni correction was used for the comparison of the three groups of interest (WtC versus WtD, WtD versus TgD, and WtC versus TgD). We also calculated and compared between groups a composite score of GLO-I-sensitive oxo-aldehydes (CO and MGO), GO- and MGO-derived AGEs (CML, CEL, MH-H1, THP, and AP), and ROS (MDA, 8-isoprostane, and nitrotyrosine) by averaging the z-scores of each of the respective markers. Each z-score represents the distance between the raw score from the total mean in units of the S.D. (assuming negative values when the raw score is below the mean and positive when above), thus, enabling the combination of several markers originally expressed as different units. The three composite scores thus obtained represent a good integral measure of the processes/mechanisms they represent and have the advantage of reducing the influence of the biological variability when each of their constituent markers is tested separately. To enable a meaningful interpretation of the magnitude of the differences in these composite scores, comparisons between the Tg diabetic group and the referent group (WT) were also expressed relative to the levels in this group (i.e. as percentage). A p value of less than 0.05 was considered statistically significant. Data are expressed as the mean ± S.E.
RESULTS
Glyoxalase-I Overexpression in the Transgenic GLO-I Rats
GLO-I activity was significantly elevated in multiple tissues of the GLO-I transgenic rats including heart, kidney, eye, brain, aorta, and gastrocnemius muscle as compared with their WT littermates (Fig. 1A). In these tissues human GLO-I protein expression was confirmed by immunoblotting and by immunohistochemical staining as shown for the heart and kidney (Fig. 1, B and C). These data demonstrated a functionally active overexpression of GLO-I in the GLO-I transgenic rats.
FIGURE 1.

GLO-I activity and human protein expression in tissue of wild-type and transgenic GLO-I rats. A, shown is GLO-I enzyme activity (act.) in lysates of heart, kidney, eye, brain, aorta, and gastrocnemius muscle tissue of WtC, TgC, WtD, and TgD rats. B, shown is a Western blot of human GLO-I protein overexpression in transgenic heart and kidney compared with wild-type heart and kidney lysates. C, immunohistochemistry of GLO-I protein overexpression in transgenic heart (C2) and kidney (C4) compared with wild-type (C1, C3) is shown. **, p < 0.01 compared with control; ***, p < 0.001 compared with control.
Base-line and End Point Characteristics
Table 1 presents biochemical data and characteristics of both the non-diabetic and diabetic WT and GLO-I transgenic rats. Diabetes in both WT and GLO-I transgenic rats, as induced by streptozotocin, resulted in an ∼5-fold increase in blood glucose levels, decreased weight gain, and increased food and fluid intake and urine production without a difference between the WT and the GLO-I transgenic rats.
TABLE 1.
Base-line and end point characteristics of the wild-type control, GLO-I control, wild-type diabetic, and GLO-I diabetic rats
BL, base line; EP, endpoint.
| Parameters | Wild-type control |
GLO-I control |
Wild-type diabetic |
GLO-I diabetic |
||||
|---|---|---|---|---|---|---|---|---|
| Male | Female | Male | Female | Male | Female | Male | Female | |
| Glucose (mm) | ||||||||
| BL | 3.9 ± 0.5 | 3.9 ± 0.3 | 3.8 ± 0.4 | 3.9 ± 0.4 | 3.9 ± 0.2 | 3.8 ± 0.3 | 4.0 ± 0.4 | 4.0 ± 0.2 |
| EP | 4.9 ± 1.2 | 4.5 ± 0.7 | 4.3 ± 0.6 | 3.8 ± 0.5 | 20.2 ± 2.1a,b | 20.3 ± 3.0a,b | 19.2 ± 1.5a,b | 21.9 ± 4.3a,b |
| Weight (g) | ||||||||
| BL | 308 ± 35 | 198 ± 29 | 327 ± 40 | 205 ± 20 | 341 ± 35 | 203 ± 17 | 310 ± 27 | 195 ± 24 |
| EP | 475 ± 15a | 256 ± 9a | 486 ± 15a | 260 ± 13a | 318 ± 48b | 216 ± 32 | 318 ± 23b | 212 ± 8b |
| Food (g) | ||||||||
| BL | 29 ± 0.9 | 23 ± 7.4 | 26 ± 5.3 | 17 ± 4.4 | 27 ± 2.4 | 17 ± 1.8 | 25 ± 4.0 | 18 ± 3.0 |
| EP | 20 ± 3.8 | 20 ± 3.0 | 18 ± 1.7 | 23 ± 2.0 | 47 ± 6.3a,b | 35 ± 8.1a,b | 48 ± 5.1a,b | 40 ± 3.5 a,b |
| Fluid (ml) | ||||||||
| BL | 32 ± 4.6 | 27 ± 9.9 | 30 ± 5.2 | 27 ± 2.8 | 36 ± 2.7 | 24 ± 1.8 | 35 ± 4.9 | 25 ± 2.0 |
| EP | 27 ± 6.1 | 28 ± 4.7 | 27 ± 3.5 | 30 ± 8.0 | 169 ± 21.4a,b | 196 ± 57.7a,b | 246 ± 66.9a,b | 163 ± 12.8a,b |
| Urine (ml) | ||||||||
| BL | 12 ± 1.3 | 10 ± 1.9 | 13 ± 3.9 | 11 ± 1.3 | 13 ± 1.1 | 11 ± 1.0 | 11 ± 1.1 | 9 ± 2.3 |
| EP | 19 ± 4.4 | 18 ± 2.1 | 20 ± 7.6 | 24 ± 14.2 | 165 ± 24.9a,b | 176 ± 104.7a,b | 205 ± 19.6a,b | 114 ± 35.3a,b |
a p < 0.05 compared with base line.
b p < 0.05 compared with control.
GLO-1 Overexpression Reduces Elevated Levels of MGO and GO in Diabetic Rats
The AGE precursors, MGO, GO, and 3-DG, were significantly elevated in the diabetic WT rats as compared with non-diabetic WT rats (Fig. 2, A–C). Levels of the GLO-I-sensitive GO and MGO were normalized in the GLO-I transgenic diabetic rats compared with the WT rats, whereas 3-DG levels were not influenced by the GLO-I overexpression. The composite score of MGO and GO differed between the WT diabetic and transgenic diabetic group by 1.04. This difference corresponds to a significant 81% decrease in the composite score of GO and MGO in the GLO-I transgenic diabetic rats compared with the WT diabetic rats (p < 0.05; Fig. 2D).
FIGURE 2.

Oxo-aldehyde formation and detoxification of (M)GO in the blood of wild-type and transgenic GLO-I rats. Glyoxal (A), MGO (B), and 3-DG (C) levels in the blood of WtC, TgC, WtD, and TgD rats are shown. A composite score was calculated for the GLO-I- sensitive oxo-aldehydes GO and MGO (D). d-Lactate levels in the plasma (E) and urine (F) of the WtC, TgC, WtD, and TgD rats are shown. *, p < 0.05 compared with control; **, p < 0.01 compared with control; ***, p < 0.001 compared with control; #, p < 0.05 compared with wild-type diabetic.
In addition, the end product of the GLO system, i.e. d-lactate, was determined. The plasma levels of d-lactate were elevated in the diabetic rats compared with the non-diabetic rats (Fig. 2E). Also, the urine samples showed an increase of d-lactate in the diabetic rats, with a higher concentration of d-lactate in the diabetic GLO-I transgenic rats, indicating a high flux of MGO through the GLO-I pathway (Fig. 2F).
GLO-1 Overexpression Reduces Elevated Levels of AGEs in Diabetic Rats
Next, we evaluated if the overexpression of GLO-I also led to a decreased formation of AGEs. We measured protein-bound levels of CML, CEL, MG-H1, THP, and AP in the plasma of the four groups. All AGE adducts were elevated in the plasma of diabetic WT rats compared with non-diabetic WT rats, and this was statistically significant for CML, MG-H1, and AP. There was a trend that the diabetes-induced increase of all AGEs was partially reduced in the diabetic GLO-I transgenic rats as compared with the diabetic WT rats (Fig. 3, A–E), although the reduction of the individual AGEs did not reach statistical significance. The absolute difference in the overall composite protein-bound AGEs score in the plasma of WT diabetic rats versus the transgenic diabetic rats was 0.73, and this corresponds to a significant 54% reduction in the composite score of plasma AGEs in diabetic GLO-I transgenic rats compared with the diabetic WT rats (p < 0.05; Fig. 3F).
FIGURE 3.

Formation of AGEs measured in plasma from wild-type and transgenic GLO-I rats. CML (A), CEL (B), MG-H1 (C), THP (D), and AP (E) levels were measured with HPLC-MS/MS and competitive ELISA in the plasma of the WtC, TgC, WtD, and TgD rats. In addition a composite score was calculated for the five AGEs (F). *, p < 0.05 compared with control; ***, p < 0.001 compared with control; #, p < 0.05 compared with wild-type diabetic
GLO-1 Overexpression Reduces Elevated Oxidative Stress Markers in Urine and Tissue in Diabetic Rats
Furthermore, we examined the effect of GLO-I overexpression on oxidative stress. The urinary excretion of MDA and 8-isoprostane were significantly increased in the diabetic WT rats after 12 weeks of diabetes (Fig. 4, A and B). This increase in estimates of oxidative stress was partially prevented in the diabetic GLO-I transgenic rats, although it did not reach statistically significance. In addition, kidney tissue levels of the peroxynitrite marker nitrotyrosine were elevated in the diabetic WT rats and significantly (p < 0.05) attenuated in the diabetic GLO-I transgenic rats (Fig. 4C). The difference in the composite score of these oxidative stress markers between the WT diabetic rats and the transgenic diabetic rats was 0.84, which corresponds to a significant 51% decrease in the composite ROS score in the diabetic GLO-I transgenic rats as compared with the diabetic control rats (p < 0.05; Fig. 4D).
FIGURE 4.
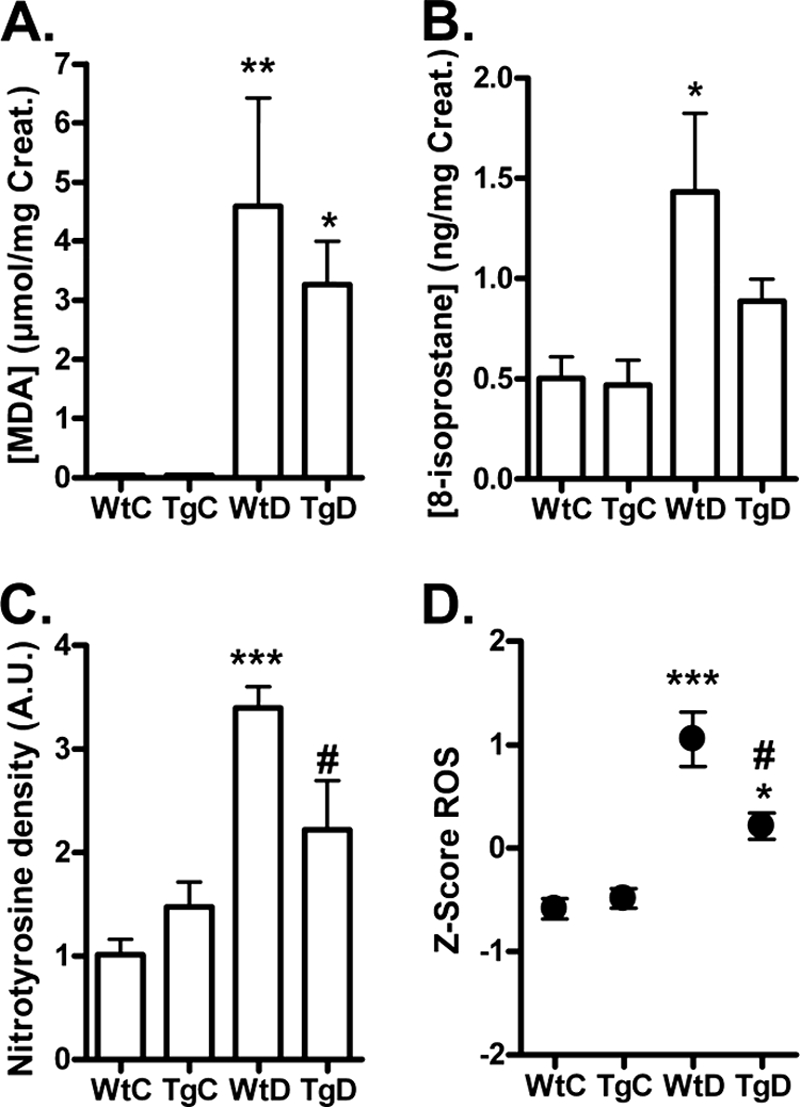
Formation of ROS markers in urine and tissue from wild-type and transgenic GLO-I rats. MDA (A), 8-isoprostane (B), and kidney nitrotyrosine (C) levels in WtC, TgC, WtD, and TgD rats were measured with HPLC and Western blotting, and a composite score was calculated for the three ROS markers (D). * p < 0.05 compared with control; **, p < 0.01 compared with control; ***, p < 0.001 compared with control; # p < 0.05 compared with wild-type diabetic. A.U., absorbance units. Creat, creatinine.
Protein Levels of Mitochondrial Oxidative Phosphorylation Complexes
To gain more information about the source of the oxidative stress, we measured the levels of four structural proteins of the complexes of the mitochondrial respiration chain. Complex I, II, III, and V of the mitochondrial respiration chain in gastrocnemius muscle lysates were all significantly decreased in the wild-type diabetic rats. In the transgenic diabetic rats this decrease was partially counteracted by the GLO-I overexpression. The mitochondrial proteins adenine nucleotide translocator-1 and uncoupling protein-3 were not altered by diabetes or GLO-I overexpression, indicating a specific effect on the oxidative phosphorylation complexes (see Fig. 5, A–F). The decrease in phosphorylation complexes was accompanied by an increase in the lipid oxidation marker 4-HNE in the muscle from the wild-type diabetic rats (Fig. 5G), which was normalized by GLO-I overexpression.
FIGURE 5.

Protein levels of mitochondrial proteins and formation of 4-HNE in the muscle of wild-type and transgenic GLO-I rats. The mitochondrial proteins Complex I (A), II (B), III (C), V (D), ANT (E), uncoupling protein-3 (UCP-3) (F), and lipid oxidation marker 4-HNE (G) were measured by Western blotting in gastrocnemius muscle lysates of the WtC, TgC, WtD, and TgD rats. *, p < 0.05 compared with control; **, p < 0.01 compared with control; ##, p < 0.01 compared with wild-type diabetic. A.U., absorbance units.
DISCUSSION
We report here that GLO-I overexpression in diabetic rats prevents the hyperglycemia-induced formation of MGO, GO, and AGEs, as well as oxidative stress in diabetes. To demonstrate the importance of GLO-I in the formation of AGEs, transgenic GLO-I rats were generated and increased GLO-I protein levels, and activity was confirmed by Western blotting, Immunohistochemistry, and enzyme activity measurements, respectively. The GLO-I activity was at least 10–50-fold higher in GLO-I transgenic rats compared with WT rats in several highly vascularized tissues i.e. heart, kidney, eye, brain, aorta, and gastrocnemius muscle.
Our findings are consistent with previous reports. Shinohara et al. (6) transfected endothelial cells with GLO-I, and the hyperglycemia-induced formation of MGO could be completely normalized by the overexpression of GLO-I, resulting in lower intracellular MGO-derived AGE formation but not of CML and CEL. Consistently, Miyata et al. (24) demonstrated that a deficiency of GLO-I is associated with increased levels of AGEs, further underlining the importance of glyoxalase detoxification system, in particular GLO-I, for the actual level of AGEs.
In our study, diabetes, as induced by streptozotocin treatment, resulted in increased MGO, GO, and 3-DG levels. The fact that in our study only the GLO-I substrates MGO and GO are reduced by GLO-I and not 3-DG, which cannot be degraded by GLO-I, underlines the specificity of the GLO-I transgenic model. In addition to a decrease of MGO and GO, we found that the MGO- and/or GO-derived AGEs, MG-H1, THP, AP, CML, and CEL were decreased in the plasma of the diabetic GLO-I-overexpressing model as compared with WT diabetic rats. Despite the trend toward reduction in all markers, this decrease was only statistically significant when all these markers were combined into a more robust overall score of AGEs. Therefore, interpretations about the effect of GLO-I overexpression on each of the separate AGE adducts should be taken with care. Furthermore, the composite score decrease in total AGE levels was on average only 54% despite the 81% reduction of GO and MGO. This only partial reduction in the formation of AGEs in the diabetic transgenic rats might be due to alternative pathways in the formation of AGEs independent of the precursors MGO and GO and independent of GLO-I expression. Because the glucose levels were elevated 5-fold in the diabetic rats compared with controls, with no effect of GLO-I overexpression, it might be that a significant part of the formation of AGEs is formed via the classical Maillard reaction. In addition, some AGEs, such as CML, can also be formed directly by lipid oxidation and via the myeloperoxidase reaction, which can explain the GLO-I independent formation of AGEs in diabetes (25).
In addition to the effect on carbonyl stress and AGEs, GLO-I overexpressing also reduced hyperglycemia-evoked ROS generation, as estimated by three markers of oxidative stress, i.e. 8-isoprostane, MDA, and nitrotyrosine. 8-Isoprostane is a prostaglandin-like compound generated in vivo by the free-radical-catalyzed peroxidation of arachidonic acid (26). MDA is a bioactive aldehyde generated by extensive oxidation of polyunsaturated fatty acids (27), and nitrotyrosine is formed when the oxidant product of nitric oxide, peroxynitrite, nitrosates tyrosine. Our study shows that these markers of oxidative stress are increased in diabetes and that GLO-I overexpression is capable of lowering these three markers of oxidative stress. These data strongly indicate that MGO plays a relevant role in modulating diabetes-induced ROS production, which is in agreement with earlier studies with aminoguanidine and aldose reductase inhibitors (28–30).
Oxidative stress contributes significantly to the development and progression of diabetes and related vascular complications (31). The main source of ROS in diabetes is most probably due to altered mitochondrial metabolism, which results in overproduction of superoxide by the electron transport chain (32). Rosca et al. (9) described that several mitochondrial proteins are susceptible to MGO-dependent glycation, and consequently excessive superoxide is produced due to a decreased electron transport chain activity. In accordance with this study, hyperglycemia also leads to mitochondrial glycation in C. elegans (13), which was decreased by overexpression of GLO-I, indicating the importance of glyoxalase sensitive oxo-aldehydes in the formation of oxidative stress. To further explore the potential source of the oxidative stress in our model, we determined the protein levels of four structural proteins of the mitochondrial electron transport chain complexes. All these complexes were decreased in the diabetic rats and increased by GLO-1 overexpression. This decrease in electron transport chain proteins could lead to deficient mitochondrial function and structure and may contribute to the abnormality of energy metabolism. A consequence of defective mitochondrial function is the increased generation of free radicals, which are normally produced as byproducts of oxidative metabolism (33). These free radicals are able to oxidize lipids, proteins, nucleic acids, and other molecules, altering their structure and function (34). Indeed, lipid peroxidation was also measured in the muscle of our diabetic rats by the elevation of the oxidative stress marker 4-HNE. In the GLO-1 overexpression diabetic rat lipid peroxidation was completely prevented, paralleled by an increase in markers of mitochondrial function, suggesting that MGO may affect mitochondrial ROS production via an effect on mitochondrial function.
Pharmaceutical quenching of MGO in vivo is frequently used in the prevention of diabetic complications in animal models. MGO can be trapped by guanidine compounds such as aminoguanidine and metformin and by vitamin B analogs like pyridoxamine and can be reduced by the activation of transketolase by thiamine and benfothiamine. Indeed, these compounds lower MGO levels (35). However, because these guanidine compounds are far from specific, the precise contribution of MGO and GO in diabetic complications is still largely unknown. Therefore, this new transgenic rat model, which specifically decreases GLO-I-sensitive aldehydes such as MGO and GO and their derived AGEs, can provide important knowledge about the contribution of GO, MGO, and (M)GO-derived AGEs in the development of diabetic (vascular) complications. Indeed, we recently demonstrated in this model that hyperglycemia-induced impairment of endothelium-dependent vasorelaxation in mesenteric arteries is mediated by intracellular MGO levels (36), demonstrating the usefulness of this model.
In conclusion, our study shows for the first time that GLO-I overexpression decreased GO, MGO, AGEs, and ROS levels under in vivo hyperglycemic conditions. These data are consistent with the link between glycation and oxidative stress. Excessive formation of AGEs and oxidative stress has been implicated in the development of vascular complications in diabetes, and therefore, activation of the GLO-I pathway could be an important target in the prevention of diabetes-induced vascular damage.
Acknowledgments
We thank Rob Barto (Department of Clinical Chemistry, VU University Medical Center, Amsterdam, The Netherlands) and Jean Scheijen and Marjo van de Waarenburg (Department of Internal Medicine, Division of General Internal Medicine, Laboratory for Metabolism and Vascular Medicine, Maastricht University Medical Center, Maastricht, The Netherlands) for excellent technical assistance.
This study was supported in part by Dutch Diabetes Foundation Grant 2005.11.013.
- AGE
- advanced glycation end product
- MGO
- methylglyoxal
- GO
- glyoxal
- 3-DG
- 3-deoxyglucocone
- MG-H1
- hydroimidazolone
- AP
- argpyrimidine
- THP
- tetrahydropyrimidine CEL, Nϵ-(1-carboxyethyl)lysine
- ROS
- reactive oxygen species
- TgC
- transgenic (Tg) control
- TgD
- transgenic diabetic
- WtD
- wild-type diabetic
- WtC
- wild-type control
- KLH
- keyhole limpet hemocyanin
- MDA
- malondialdehyde
- 4-HNE
- 4-hydroxy-2-nonenal
- GLO-I
- glyoxalase-I
- CML
- Nϵ-(1-carboxy-methyl)lysine.
REFERENCES
- 1. Brownlee M. (2001) Nature 414, 813–820 [DOI] [PubMed] [Google Scholar]
- 2. Monnier V. M., Cerami A. (1981) Science 211, 491–493 [DOI] [PubMed] [Google Scholar]
- 3. Yaylayan V. A., Huyghues-Despointes A. (1994) Crit. Rev. Food Sci. Nutr. 34, 321–369 [DOI] [PubMed] [Google Scholar]
- 4. Beisswenger P. J., Howell S. K., Nelson R. G., Mauer M., Szwergold B. S. (2003) Biochem. Soc. Trans. 31, 1358–1363 [DOI] [PubMed] [Google Scholar]
- 5. Thornalley P. J. (2003) Biochem. Soc. Trans. 31, 1343–1348 [DOI] [PubMed] [Google Scholar]
- 6. Shinohara M., Thornalley P. J., Giardino I., Beisswenger P., Thorpe S. R., Onorato J., Brownlee M. (1998) J. Clin. Invest. 101, 1142–1147 [DOI] [PMC free article] [PubMed] [Google Scholar]
- 7. Biswas S., Ray M., Misra S., Dutta D. P., Ray S. (1997) Biochem. J. 323, 343–348 [DOI] [PMC free article] [PubMed] [Google Scholar]
- 8. Chang T., Wang R., Wu L. (2005) Free Radic. Biol. Med. 38, 286–293 [DOI] [PubMed] [Google Scholar]
- 9. Rosca M. G., Mustata T. G., Kinter M. T., Ozdemir A. M., Kern T. S., Szweda L. I., Brownlee M., Monnier V. M., Weiss M. F. (2005) Am. J. Physiol. Renal Physiol. 289, F420–F430 [DOI] [PubMed] [Google Scholar]
- 10. Miller A. G., Smith D. G., Bhat M., Nagaraj R. H. (2006) J. Biol. Chem. 281, 11864–11871 [DOI] [PubMed] [Google Scholar]
- 11. Sakamoto H., Mashima T., Kizaki A., Dan S., Hashimoto Y., Naito M., Tsuruo T. (2000) Blood 95, 3214–3218 [PubMed] [Google Scholar]
- 12. Thornalley P. J., Edwards L. G., Kang Y., Wyatt C., Davies N., Ladan M. J., Double J. (1996) Biochem. Pharmacol. 51, 1365–1372 [DOI] [PubMed] [Google Scholar]
- 13. Schlotterer A., Kukudov G., Bozorgmehr F., Hutter H., Du X., Oikonomou D., Ibrahim Y., Pfisterer F., Rabbani N., Thornalley P., Sayed A., Fleming T., Humpert P., Schwenger V., Zeier M., Hamann A., Stern D., Brownlee M., Bierhaus A., Nawroth P., Morcos M. (2009) Diabetes 58, 2450–2456 [DOI] [PMC free article] [PubMed] [Google Scholar]
- 14. Inagi R., Miyata T., Ueda Y., Yoshino A., Nangaku M., van Ypersele de Strihou C., Kurokawa K. (2002) Kidney Int. 62, 679–687 [DOI] [PubMed] [Google Scholar]
- 15. McLellan A. C., Phillips S. A., Thornalley P. J. (1993) Anal. Biochem. 211, 37–43 [DOI] [PubMed] [Google Scholar]
- 16. Schalkwijk C. G., Posthuma N., ten Brink H. J., ter Wee P. M., Teerlink T. (1999) Perit. Dial. Int. 19, 325–333 [PubMed] [Google Scholar]
- 17. Schindhelm R. K., Alssema M., Scheffer P. G., Diamant M., Dekker J. M., Barto R., Nijpels G., Kostense P. J., Heine R. J., Schalkwijk C. G., Teerlink T. (2007) Diabetes Care 30, 1789–1794 [DOI] [PubMed] [Google Scholar]
- 18. Teerlink T., Barto R., Ten Brink H. J., Schalkwijk C. G. (2004) Clin. Chem. 50, 1222–1228 [DOI] [PubMed] [Google Scholar]
- 19. Scheijen J. L., van de Waarenburg M. P., Stehouwer C. D., Schalkwijk C. G. (2009) J. Chromatogr. B Analyt. Technol. Biomed. Life Sci. 877, 610–614 [DOI] [PubMed] [Google Scholar]
- 20. Martí R., Varela E., Segura R. M., Alegre J., Suriñach J. M., Pascual C. (1997) Clin. Chem. 43, 1010–1015 [PubMed] [Google Scholar]
- 21. Roest M., Voorbij H. A., Van der Schouw Y. T., Peeters P. H., Teerlink T., Scheffer P. G. (2008) J. Clin. Lipidol. 2, 298–303 [DOI] [PubMed] [Google Scholar]
- 22. van de Kerkhof J., Schalkwijk C. G., Konings C. J., Cheriex E. C., van der Sande F. M., Scheffer P. G., ter Wee P. M., Leunissen K. M., Kooman J. P. (2004) Nephrol. Dial. Transplant 19, 910–916 [DOI] [PubMed] [Google Scholar]
- 23. Hoeks J., Briedé J. J., de Vogel J., Schaart G., Nabben M., Moonen-Kornips E., Hesselink M. K., Schrauwen P. (2008) FEBS Lett. 582, 510–516 [DOI] [PubMed] [Google Scholar]
- 24. Miyata T., van Ypersele de Strihou C., Imasawa T., Yoshino A., Ueda Y., Ogura H., Kominami K., Onogi H., Inagi R., Nangaku M., Kurokawa K. (2001) Kidney Int. 60, 2351–2359 [DOI] [PubMed] [Google Scholar]
- 25. Fu M. X., Requena J. R., Jenkins A. J., Lyons T. J., Baynes J. W., Thorpe S. R. (1996) J. Biol. Chem. 271, 9982–9986 [DOI] [PubMed] [Google Scholar]
- 26. Morrow J. D., Hill K. E., Burk R. F., Nammour T. M., Badr K. F., Roberts L. J., 2nd (1990) Proc. Natl. Acad. Sci. U.S.A. 87, 9383–9387 [DOI] [PMC free article] [PubMed] [Google Scholar]
- 27. Requena J. R., Fu M. X., Ahmed M. U., Jenkins A. J., Lyons T. J., Thorpe S. R. (1996) Nephrol. Dial. Transplant. 11, 48–53 [DOI] [PubMed] [Google Scholar]
- 28. Ihm S. H., Yoo H. J., Park S. W., Ihm J. (1999) Metabolism 48, 1141–1145 [DOI] [PubMed] [Google Scholar]
- 29. Kedziora-Kornatowska K., Luciak M. (1998) Biochem. Mol. Biol. Int. 46, 577–583 [DOI] [PubMed] [Google Scholar]
- 30. Drel V. R., Pacher P., Stevens M. J., Obrosova I. G. (2006) Free Radic. Biol. Med. 40, 1454–1465 [DOI] [PMC free article] [PubMed] [Google Scholar]
- 31. Ceriello A. (2006) Curr. Opin. Lipidol. 17, 510–518 [DOI] [PubMed] [Google Scholar]
- 32. Nishikawa T., Edelstein D., Du X. L., Yamagishi S., Matsumura T., Kaneda Y., Yorek M. A., Beebe D., Oates P. J., Hammes H. P., Giardino I., Brownlee M. (2000) Nature 404, 787–790 [DOI] [PubMed] [Google Scholar]
- 33. Rabbani N., Thornalley P. J. (2008) Biochem. Soc. Trans. 36, 1045–1050 [DOI] [PMC free article] [PubMed] [Google Scholar]
- 34. Kakkar P., Singh B. K. (2007) Mol. Cell. Biochem. 305, 235–253 [DOI] [PubMed] [Google Scholar]
- 35. Reddy V. P., Beyaz A. (2006) Drug Discov. Today 11, 646–654 [DOI] [PubMed] [Google Scholar]
- 36. Brouwers O., Niessen P. M., Haenen G., Miyata T., Brownlee M., Stehouwer C. D., De Mey J. G., Schalkwijk C. G. (2010) Diabetologia 53, 989–1000 [DOI] [PMC free article] [PubMed] [Google Scholar]