Abstract
Laser tweezers Raman spectroscopy was used to detect the cellular response of Escherichia coli cells to penicillin G-streptomycin and cefazolin. Time-dependent intensity changes of several Raman peaks at 729, 1,245, and 1,660 cm−1 enabled untreated cells and cells treated with the different antibiotic drugs to be distinguished.
Laser tweezers Raman spectroscopy (LTRS) is unique among emerging technologies in its ability to assess the composition of single, live cells in real time without exogenous labeling or genetic modification (2, 3, 15). Using a tightly focused laser beam to optically trap single cells within the laser focus and generate inelastically scattered photons as the laser interacts with the cell's intrinsic molecular bonds, LTRS can be used to acquire a Raman spectrum of the cell noninvasively and nondestructively. As such, Raman spectra offer a fingerprint of vibrating chemical bonds that varies with the physiologic growth state (4, 11, 12) and have been used to distinguish bacterial species and strains (1, 8, 9, 14). LTRS is attractive in its ability to characterize single cells and detect cellular changes in response to antibiotics, which may allow the early detection of bacterial resistance or the identification of small subpopulations with unique metabolic, phenotypic, or antimicrobial responses (resistance). Such capabilities make this technology of great potential interest for clinical and diagnostic purposes.
Prior studies in which Raman or UV resonance Raman spectroscopy were used to distinguish bacterial strains and species, monitor bacterial growth phases, or evaluate the influence of antibiotics on bacteria analyzed bulk cell populations. Here, we make a valuable extension to this work by using LTRS to detect bacterial responses to antibiotics at a cellular level. In this proof-of-principle study, LTRS is used to characterize the effects of two different antibiotic treatments and concentrations on the growth and vibrational spectra of drug-susceptible Escherichia coli cells. Raman peaks associated with drug exposure are identified that may distinguish between bacterial responses to antibiotic preparations or drug classes.
A single colony of ampicillin-sensitive E. coli (ATCC 25922) cells from an overnight subculture was inoculated into 20 ml of Luria-Bertani broth (Gibco) and incubated at 37°C in a shaker incubator (225 rpm; Excella E25). Broth cultures were sampled, and optical density (OD; 600 nm) values and Raman spectra were obtained at 1- to 2-h intervals for 24 h and then every 10 h for 5 days. This procedure was repeated 10 times, 5 without antibiotics, 3 with penicillin G-streptomycin added, and 2 with cefazolin added. For the antibiotic exposure studies, laboratory-grade penicillin G-streptomycin (Gibco 1552) was used at final concentrations of 1 vol% (100 units penicillin/ml [1× to 4× MIC] and 100 μg streptomycin/ml [12× to 50× MIC]) and 5 vol% (500 units penicillin/ml [5× to 20× MIC] and 500 μg streptomycin/ml [60× to 250× MIC]); cefazolin (Cura Pharmaceutical) was used at a final concentration of 100 μg/ml (50× MIC). In all cases, the drug was added 3.5 h after the inoculation of the culture (end of log phase). Published MICs of penicillin, cefazolin, and streptomycin for E. coli ATCC 25922 were used (5).
A modified inverted microscope (10) with a continuous-wave laser at 785 nm (CrystaLaser) focused with a water immersion microscope objective (Olympus 60×/1.2) was used to acquire Raman spectra of individual, optically trapped bacterial cells. One hundred microliters of bacteria in LB was added to 1 ml phosphate-buffered saline (PBS) in a cell chamber (Attofluor; Molecular Probes) with a fused-silica microscope coverslip bottom. On average, five suspended bacterial cells were optically trapped at a time. The cells were interrogated for 60 s with 28 mW of laser power to obtain a Raman spectrum. Approximately 75 cells were interrogated for each growth curve time point.
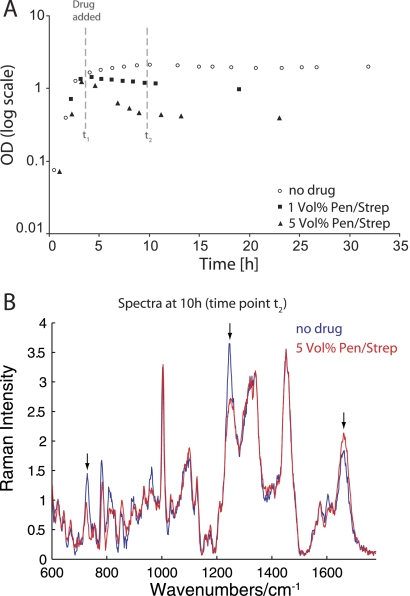
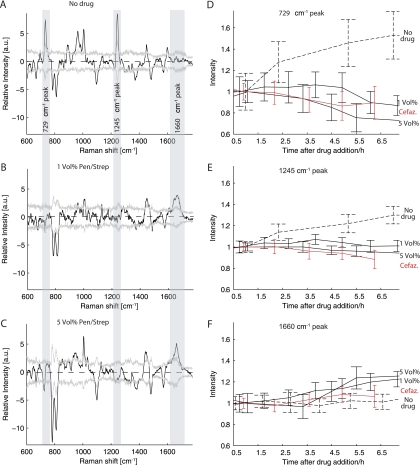
Figure 1A shows the E. coli growth curve with and without antibiotic treatment. The optical density of the culture decreased with antibiotic treatment, and the magnitude of this effect increased at higher drug concentrations. Using these growth curves as a reference, the Raman spectra of treated and nontreated bacterial cells were compared at several time points. As an illustration, the mean Raman spectra at early stationary phase (t2, 10 h after inoculation, equivalent to 6.5 h after drug was added) for normal growth and growth during penicillin G-streptomycin exposure are presented in Fig. 1B. The largest differences in these Raman spectra are visible in the peaks at 729 cm−1, 1,245 cm−1, and 1,660 cm−1. To further investigate this, the Raman difference spectra between 4 h (t1) and 10 h (t2) were plotted for normal growth and growth under treatment with 1 vol% and 5 vol% penicillin G-streptomycin (Fig. 2A through C). The spectral differences in the 729 cm−1, 1,245 cm−1, and 1,660 cm−1 peaks are also visible in these plots. The time dependences of the relative changes in the intensities of these peaks were plotted for normal growth and antibiotic treatment in Fig. 2D, E, and F. The maximum intensity and the intensity values of the two neighboring channels were added for each Raman peak to obtain the intensity values used in these peak time traces. These values were normalized to the peak intensities at the 4-h time point after inoculation. Unlike the normal growth spectra, no increase in the 729 cm−1 or 1,245 cm−1 Raman peak intensity was observed when antibiotics were present. However, an increase in the 1,660 cm−1 peak was detected which was not observed during normal growth. The P values for the 729 cm−1, 1,245 cm−1, and 1,660 cm−1 peak intensities at the 4.5-h time point for 1 vol% penicillin G-streptomycin exposure were calculated to be 5.6·10−9, 4·10−13, and 7.2·10−5, respectively. The P values for 5 vol% drug treatment were of the same order of magnitude. The time point at which cellular drug response can be spectroscopically distinguished from normal cell growth was after approximately 4.5 h of drug exposure. A similar Raman spectral response was observed for treatment of E. coli cells with cefazolin, as shown in the time traces of relative changes in peak intensities for the Raman frequencies 729 cm−1 and 1,245 cm−1 (Fig. 2D and E), suggesting that this may represent a shared response to β-lactam antibiotics. These differences may reflect physiologic changes in the cellular adenine environment during growth that occurred only in the absence of antibiotics. (11) However, unlike the penicillin G-streptomycin treatment, no increase in the 1,660 cm−1 Raman peak was observed during treatment with cefazolin (Fig. 2F), consistent with a specificity of this Raman spectroscopic response to aminoglycoside exposure. Previous studies showed that ribosomes display a strong Raman peak at 1,660 cm−1 (6), and streptomycin treatment has been associated with intracellular accumulation of 70S ribosome monomers (7).
FIG. 1.
Correlation between Raman spectral changes and growth curve responses of E. coli cells. (A) Changes to the E. coli growth curve after exposure to penicillin G-streptomycin at drug concentrations of 1 vol% (100 units per ml/100 μg per ml) and 5 vol% (500 units per ml/500 μg per ml). A decrease in optical density (OD) is visible, showing lower values for higher drug concentrations. (B) Comparison of Raman spectra measured at 10 h after inoculation (t2) for normal growth and growth during exposure to 5 vol% penicillin G-streptomycin. Relevant differences in Raman peaks at 729 cm−1, 1,245 cm−1, and 1,660 cm−1 were identified, which are marked with black arrows.
FIG. 2.
Raman spectroscopic differences after antibiotic treatment. (A to C) Raman difference spectra between 10 h and 4 h after inoculation of the bacterial culture for normal growth and during antibiotic treatment with 1 vol% and 5 vol% penicillin G-streptomycin, respectively. Standard deviations are given as gray curves. Relevant differences are visible in the 729 cm−1, 1,245 cm−1, and 1,660 cm−1 Raman peaks (marked with gray bars). (D to F) Time dependences of relative changes in Raman peak intensities for 729 cm−1, 1,245 cm−1, and 1,660 cm−1, respectively, comparing cells during normal growth (dashed curve) to cells during drug exposure (solid curves, black). Raman peak trends for the exposure to 100 μg/ml cefazolin are also shown (solid curves, red). Standard deviations are given for each data point on the curves. Statistically relevant differences between peak trends for cells during normal growth and drug exposure are observable as early as 4.5 h after drug exposure. While differences in all 3 peaks mentioned above are observed for the treatment with penicillin G-streptomycin, exposure to cefazolin resulted in different trends only for the 729 cm−1 and 1,245 cm−1 peaks and not for the 1,660 cm−1 Raman peak.
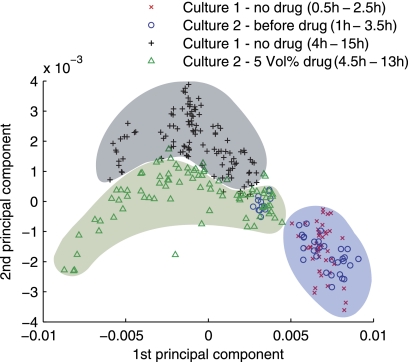
Principal component analysis (PCA) (13) was performed on the Raman spectra to generate two-dimensional scattergrams that simplify data presentation for visualizing the extent of the separation of the cell population groups under normal and antibiotic growth conditions. The spectral region from 710 cm−1 to 1,280 cm−1 containing the most significant changes was used. Figure 3 shows the principal component 2 (PC2) versus principal component 1 (PC1) scatter plots for normal growth (culture 1) and growth under drug exposure (culture 2). Before the addition of antibiotics (culture 2), the Raman spectra are identical for both growth curves and colocalize in the PCA plot (blue region in Fig. 3). The time from the initial drug exposure to the observable separation by Raman spectra was between 30 min (4 h after inoculation) and 11.5 h (15 h after inoculation), as indicated in Fig. 3 by the gray and green shaded regions for normal growth and antibiotic treatment, respectively.
FIG. 3.
Principal component analysis (PCA) scatter plot of E. coli Raman spectra for normal growth and growth during exposure to 5 vol% (500 units per ml/500 μg per ml) penicillin G-streptomycin. Raman spectra representative of normal growth (black crosses and gray-shaded area) clearly separate from spectra measured during drug exposure (green triangles and green-shaded area) within the time frame of 4 h to 15 h after culture inoculation (drug added about 3.5 h after inoculation). Normal-growth-specific spectra (red crosses) colocalize with spectra of the culture exposed to drug (blue circles) before the addition of antibiotics (0.5 h to 2.5 h after inoculation of culture). This is marked in the plot with a blue-shaded area.
In conclusion, we demonstrate that Raman spectroscopy combined with PCA is sufficiently sensitive and discriminatory to separate antibiotic-treated bacteria from untreated cells using an antibiotic-susceptible strain of E. coli. Specific Raman spectroscopic markers of E. coli response to β-lactam and or aminoglycoside treatment are also identified. Future studies will evaluate this technology using additional antibiotics and bacteria, including strains with well-defined mechanisms of antibiotic resistance.
Acknowledgments
We are grateful to John Roth (Department of Microbiology, UC Davis) for a very insightful discussion.
This work has been supported in part by funding from the Children's Miracle Network, the Keaton-Raphael Memorial Fund, and the National Science Foundation. The Center for Biophotonics, an NSF Science and Technology Center, is managed by the University of California, Davis, under cooperative agreement no. PHY 0120999.
Footnotes
Published ahead of print on 22 September 2010.
REFERENCES
- 1.Buijtels, P., H. F. M. Willemse-Erix, P. L. C. Petit, H. P. Endtz, G. J. Puppels, H. A. Verbrugh, A. van Belkum, D. van Soolingen, and K. Maquelin. 2008. Rapid identification of mycobacteria by Raman spectroscopy. J. Clin. Microbiol. 46:961-965. [DOI] [PMC free article] [PubMed] [Google Scholar]
- 2.Chan, J. W., D. S. Taylor, S. M. Lane, T. Zwerdling, J. Tuscano, and T. Huser. 2008. Nondestructive identification of individual leukemia cells by laser trapping Raman spectroscopy. Anal. Chem. 80:2180-2187. [DOI] [PubMed] [Google Scholar]
- 3.Chan, J. W., D. S. Taylor, T. Zwerdling, S. M. Lane, K. Ihara, and T. Huser. 2006. Micro-Raman spectroscopy detects individual neoplastic and normal hematopoietic cells. Biophysical J. 90:648-656. [DOI] [PMC free article] [PubMed] [Google Scholar]
- 4.Escoriza, M. F., J. M. Vanbriesen, S. Stewart, and J. Maier. 2006. Studying bacterial metabolic states using Raman spectroscopy. Appl. Spectrosc. 60:971-976. [DOI] [PubMed] [Google Scholar]
- 5.Fass, R. J., and J. Barnishan. 1979. Minimal inhibitory concentrations of 34 anti-microbial agents for control strains Escherichia coli ATCC 25922 and Pseudomonas aeruginosa ATCC 27853. Antimicrob. Agents Chemother. 16:622-624. [DOI] [PMC free article] [PubMed] [Google Scholar]
- 6.Hobro, A. J., M. Rouhi, G. L. Conn, and E. W. Blanch. 2008. Raman and Raman optical activity (ROA) analysis of RNA structural motifs. Vib. Spectrosc. 48:37-43. [DOI] [PMC free article] [PubMed] [Google Scholar]
- 7.Luzzatto, L., D. Apirion, and D. Schlessinger. 1968. Mechanism of action of streptomycin in E. coli: interruption of the ribosome cycle at the initiation of protein synthesis. Proc. Natl. Acad. Sci. U. S. A. 60:873-880. [DOI] [PMC free article] [PubMed] [Google Scholar]
- 8.Maquelin, K., L. P. Choo-Smith, H. P. Endtz, H. A. Bruining, and G. J. Puppels. 2002. Rapid identification of Candida species by confocal Raman microspectroscopy. J. Clin. Microbiol. 40:594-600. [DOI] [PMC free article] [PubMed] [Google Scholar]
- 9.Maquelin, K., C. Kirschner, L. P. Choo-Smith, N. A. Ngo-Thi, T. van Vreeswijk, M. Stammler, H. P. Endtz, H. A. Bruining, D. Naumann, and G. J. Puppels. 2003. Prospective study of the performance of vibrational spectroscopies for rapid identification of bacterial and fungal pathogens recovered from blood cultures. J. Clin. Microbiol. 41:324-329. [DOI] [PMC free article] [PubMed] [Google Scholar]
- 10.Moritz, T. J., J. A. Brunberg, D. M. Krol, S. Wachsmann-Hogiu, S. M. Lane, and J. W. Chan. 2010. Characterisation of FXTAS related isolated intranuclear protein inclusions using laser tweezers Raman spectroscopy. J. Raman Spectrosc. 41:33-39. [Google Scholar]
- 11.Moritz, T. J., D. S. Taylor, C. R. Polage, D. M. Krol, S. M. Lane, and J. W. Chan. 2010. Effect of cefazolin treatment on the nonresonant Raman signatures of the metabolic state of individual Escherichia coli cells. Anal. Chem. 82:2703-2710. [DOI] [PubMed] [Google Scholar]
- 12.Neugebauer, U., U. Schmid, K. Baumann, U. Holzgrabe, W. Ziebuhr, S. Kozitskaya, W. Kiefer, M. Schmitt, and J. Popp. 2006. Characterization of bacterial growth and the influence of antibiotics by means of UV resonance Raman spectroscopy. Biopolymers 82:306-311. [DOI] [PubMed] [Google Scholar]
- 13.Ringner, M. 2008. What is principal component analysis? Nat. Biotechnol. 26:303-304. [DOI] [PubMed] [Google Scholar]
- 14.Xie, C., J. Mace, M. A. Dinno, Y. Q. Li, W. Tang, R. J. Newton, and P. J. Gemperline. 2005. Identification of single bacterial cells in aqueous solution using confocal laser tweezers Raman spectroscopy. Anal. Chem. 77:4390-4397. [DOI] [PubMed] [Google Scholar]
- 15.Xie, C. G., M. A. Dinno, and Y. Q. Li. 2002. Near-infrared Raman spectroscopy of single optically trapped biological cells. Optics Lett. 27:249-251. [DOI] [PubMed] [Google Scholar]


