

Abstract
Background and Purpose
Lipoprotein(a) level (Lp(a)) is an established risk factor for coronary artery disease and has been implicated in carotid artery disease (CAAD). The relationship between genetic variation in the LPA gene region and CAAD risk remains unknown.
Methods
We genotyped single nucleotide polymorphisms (SNPs) in the LPAL2, LPA, and PLG region in 530 individuals with severe CAAD and 770 controls and kringle IV type 2 (KIV2) repeat length in a subset of 90 individuals.
Results
Nine SNPs collectively accounted for 30% of the variance in Lp(a) level. Six SNPs were associated with Lp(a) level after accounting for KIV2 copy number, and the dominant KIV2 allele combined with these markers explained 60% of the variance in Lp(a) level. Five SNPs, including rs10455872, which had an odds ratio of 2.1 per minor allele, and haplotypes formed by rs10455872, rs6919346, and rs3123629 were significant predictors of CAAD. After accounting for Lp(a) level, all evidence of CAAD-genotype association in the LPA region was eliminated.
Conclusions
LPA region SNPs capture some but not all of the effect of KIV2 repeat length on Lp(a) level. There are associations between LPA region SNPs and CAAD which appear to be due to effects on Lp(a) level.
Keywords: Carotid stenosis, atherosclerosis, lipoprotein(a), genomics, risk factors
Introduction
Carotid artery disease (CAAD) is an important preventable risk factor for stroke, a leading cause of mortality and long term disability in the United States.1 Effective medical and surgical therapies for primary and secondary prevention of stroke are available, but many of these interventions are expensive when viewed in terms of the number of patients needed to treat and the cost to prevent one stroke.2 Therefore, it remains important to distinguish individuals at low cerebrovascular disease risk from those at high risk. The heritability of CAAD3–8 suggests that genetic data may help to refine risk estimates and thus better target preventative therapies.
Elevated levels of lipoprotein(a) (Lp(a)), a small LDL-like particle formed by apolipoprotein B (apoB) covalently bound to apolipoprotein(a) (apo(a)), confer increased risk for CAAD and ischemic stroke.9, 10 The apo(a) protein varies in size due to a copy number polymorphism of the kringle IV type 2 domain (KIV2) encoded by exons 4 through 5+2(n−1) of LPA on chromosome 6q26, where n, ranging from 5 to greater than 50,11 is the number of KIV2 copies. The KIV2 polymorphism has been reported to account for 69% of the variability in Lp(a) level,12 with increased repeat number leading to impaired liver secretion,13 lower plasma Lp(a) level,11, 12, 14, 15 and decreased risk of myocardial infarction.16, 17
Although many risk factors overlap between CAAD and coronary artery disease (CAD), the relative importance of non-genetic risk factors varies between these two disease processes,18 suggesting the possibility of differential underlying genetic diatheses. In addition, although many well-established genetic risk factors for CAD also increase risk for CAAD,19, 20 some loci, such as that on chromosome 10q11.21, appear to increase risk for CAD but not stroke,20 while other genetic factors, such as dyslipidemia genetic risk scores, display much weaker effects on CAAD.21 Therefore, given the known association between Lp(a) levels and CAAD and the reported association between LPA polymorphisms and CAD,22 we evaluated the role of LPA region polymorphisms in predicting Lp(a) level and CAAD risk. For polymorphisms associated with Lp(a), we determined whether these effects were due to linkage disequilibrium (LD) with the KIV2 repeat. Due to the labor intensive, low throughput assays required for accurate KIV2 genotyping,23 we also sought to determine whether LPA polymorphisms in LD with the KIV2 copy number polymorphism could act as an adequate surrogate for KIV2 genotype in predicting Lp(a) level. Finally, we sought to determine whether LPA polymorphisms contribute to CAAD risk because of, or in addition to, their effects on Lp(a) level.
Materials and Methods
Study population
All study participants were ascertained at four Seattle medical centers and gave written informed consent. The University of Washington, Virginia Mason Medical Center, and the Puget Sound Veterans Affairs Health Care System human subject review boards approved this study. Characteristics of study participants, clinical covariates, and phenotyping are shown in Table 1 and are described in greater detail elsewhere.21, 24, 25 Three hundred six CAAD cases and 534 controls overlap with the cohort described by Ober et al.26 which analyzed the effects of rs6919346 and rs14224 on Lp(a) level. Briefly, CAAD cases have >80% internal carotid artery stenosis, in one or both arteries, detected by duplex ultrasound or on prior endarterectomy. Controls have <15% internal carotid artery stenosis bilaterally and no other known vascular disease. Individuals with carotid stenosis between 50% and 80% were included in analyses testing for association between SNPs and Lp(a) but not case versus control analyses. The distributions of censored ages were approximately matched between cases and controls based on the age of diagnosis for CAAD cases and the age at the last blood draw for controls. Due to the limited numbers of other ethnic groups analyses are limited to Caucasian ancestry was confirmed using STRUCTURE27 considering a panel of ancestry informative markers on the Illumina HumanCVD BeadChip28. We excluded any individual who showed greater than 10% non-Caucasian ancestry.
Table 1.
Study participant demographics.
| Cases (>80% stenosis) | 50%–80% stenosis | Controls (<15% stenosis) | P-value | |
|---|---|---|---|---|
| n = 530 | n = 196 | n = 770 | ||
| Female | 10.9% | 17.3% | 17.1% | 0.0025 |
| Censored age | 66.6 | 68.1 | 64.7 | 2.1 × 10⁻⁴ |
| Mean Lp(a) nmol/L (median) | 91 (38) | 93 (42) | 47 (23) | 5.5 × 10⁻¹⁶ |
| Loge Lp(a) nmol/L | 3.6 | 3.6 | 3.0 | 1.5 × 10⁻¹² |
| Body mass index, kg/m2 | 27.8 | 27.5 | 28.5 | 0.0080 |
| Diabetes | 30.8% | 27.6% | 12.8% | 4.7 × 10⁻¹⁴ |
| Antihypertensive therapy | 86.9% | 79.7% | 47.7% | 1.4 × 10−44 |
| Current smoker | 28.0% | 19.5% | 9.6% | 1.0 × 10⁻¹⁵ |
| Pack years smoked | 45.5 | 41.4 | 24.6 | 2.0 × 10⁻²⁵ |
| Lipid lowering therapy | 71.7% | 63.6% | 22.9% | 1.5 × 10−63 |
| HDL, mg/dL | 46.4 | 47.0 | 51.9 | 1.3 × 10⁻⁹ |
| LDL, mg/dL | 99.6 | 106.1 | 117.4 | 6.0 × 10⁻²² |
Means or percentages are shown for each trait. P-values are for comparison between cases with at least 80% carotid stenosis versus controls with less than 15% stenosis using chi-squared tests for categorical variables or t-tests for continuous variables.
Lipoprotein(a) measurement and KIV2 copy number
Lp(a) concentrations in nmol/L were measured on fasting plasma samples by a double monoclonal antibody-based enzyme-linked immunoassay as described.29 Apo(a) size isoforms, defined by the relative number of KIV2 repeats, were determined in a subset of 90 subjects by high resolution sodium dodecyl sulfate-agarose gel electrophoresis followed by immunoblotting as previously described.30, 31 Subjects were over-selected for infrequent SNP genotypes to increase genetic diversity in the sub-sample. The repeat number of the predominantly expressed isoform was used as the analysis trait;26 in 8 individuals with equally expressed isoforms the two repeat numbers were averaged.
Genotyping and SNP selection
Genotyping was performed using the Illumina HumanCVD BeadChip platform.32 The available region on chromosome 6q26-27 included approximately 318 kilobases and encompassed the genes LPAL2, LPA, and PLG. A total of 53 SNPs were present within this region and met quality control criteria for missing genotype rate (<10%) and minor allele frequency (>1%). Two SNPs (rs3127569 and rs783144) were excluded due to departure from Hardy-Weinberg equilibrium. Missing genotypes were imputed BIMBAM33 based on unphased genotypes for CEU individuals from HapMap release 27.34 To reduce the dependence among SNPs due to LD, we used ldSelect35 to identify 28 tagSNPs using the default correlation threshold of 0.64. Haplotypes were estimated using PLINK.36
Statistical analyses
All analyses were performed in R37 and PLINK. Lp(a) level was natural log transformed due to right skew, and in all analyses Lp(a) level refers the log transformed values. Unless otherwise specified Lp(a) levels were adjusted for sex and age at the time of blood draw. CAAD were adjusted for sex, censored age, body mass index, type 2 diabetes, current smoking status, and total pack years smoked. Cholesterol levels, use of lipid lowering medications, and use of antihypertensive medications were not included as covariates for CAAD regression models because, consistent with guidelines, individual with CAAD in our study are generally treated to lower cholesterol38 and blood pressure39 targets than individuals without disease. Thus, including lipid and blood pressure measurements or treatment status would lead to a problematic model in which the dependent variable, case versus control status, is causal for these independent variables. Linear and logistic regression were used to test for associations between the minor allele dose of each SNP and Lp(a) levels and CAAD status, respectively. Haplotype based tests of association were carried out in PLINK. The proportion of Lp(a) level variance explained was estimated by the difference in adjusted r2 values between models which accounts for the number of explanatory terms.
To account for multiple testing we performed Bonferroni corrections or estimated false discovery rates (FDR) using the Benjamini Hochberg procedure.40 Bonferroni corrections assume independence of tests and are conservative in the presence of correlated tests, so to estimate a family wise error rate in the setting of LD between SNPs we permuted CAAD status and non-genetic covariates 10000 times, and for each permutation determined the most significant association across the 28 tagSNPs. To identify associations between multiple SNPs and Lp(a), while removing SNPs associated with Lp(a) solely due to LD with other variants, we used backward stepwise regression.
Power calculations
We assessed the power of our sample size to detect association between SNPs and CAAD case versus control status conservatively assuming an underlying variant that confers a relative risk of 2.0 for homozygotes and 1.5 in the heterozygotes.22, 41, 50 As shown in Supplementary Table 1 our sample size provides robust power to detect association with for risk allele frequencies as low as 0.05 when either the causal SNP itself or surrounding markers in LD are tested.
Results
Prediction of Lp(a) level by SNPs
As expected, we found that Lp(a) level was elevated in women, older individuals, and individuals with vascular disease. Lp(a) level was significantly higher in CAAD cases than in controls (β = 0.74; p = 5.7 × 10⁻⁶), adjusting for sex, age, body mass index, current smoking and total pack years smoked, diabetes, and use of antihypertensives and lipid lowering medication. After excluding CAAD status from the regression, only female gender (β = 0.48; p = 0.031) and age (β = 0.017; p = 0.037) were predictive of elevated Lp(a) level.
Multiple SNPs individually and jointly predict Lp(a) level. We found that 20 out of 28 tagSNPs were associated with Lp(a) level at a p-value of 0.05, corresponding to a FDR of 0.067 (Table 2). Using backward stepwise regression identify a multi-SNP model in which redundant associations due to LD were discarded, 9 SNPs were jointly associated with Lp(a) at an inclusion p-value of 0.05, corresponding to a FDR of 0.0064. These 9 SNPs, shown in order of inclusion in Figure 1, explained 30% of the variance in loge transformed Lp(a) levels in the complete cohort and 27% in controls.
Table 2.
Association tests between 6q26-27 tagSNPs and Lp(a) and CAAD.
| SNP | Genomic context* (bp) | Minor allele (freq) | Lp(a) β (p-value) | Lp(a) % variance† | CAAD OR‡ (p-value) |
|---|---|---|---|---|---|
| rs3123629 | LPAL2 intron 5 (160826076) | A (0.30) | 0.28 (1.2 × 10⁻⁵) | 1.2% | 1.1 (0.63) |
| rs7754014 | LPAL2 intron 2 (160838285) | T (0.23) | −0.068 (0.32) | 0.00038% | 1.2 (0.14) |
| rs7449650 | LPA intron 38 (160877104) | A (0.33) | −0.22 (2.3 × 10⁻⁴) | 0.83% | 0.90 (0.36) |
| rs6919346 | LPA intron 37 (160880349) | A (0.15) | −0.65 (6.3 × 10⁻¹⁷) | 4.4% | 0.66 (0.0070) |
| rs3798220 | LPA exon 37 I→M (160881127) | G (0.02) | 1.7 (9.5 × 10⁻¹⁴) | 3.5% | 1.8 (0.26) |
| rs11751605 | LPA intron 35 (160883220) | G (0.16) | 0.42 (9.4 × 10⁻⁸) | 1.8% | 1.4 (0.033) |
| rs4708871 | LPA intron 32 (160889086) | G (0.03) | −0.71 (4.5 × 10⁻⁵) | 1.0% | 0.75 (0.39) |
| rs7761293 | LPA intron 31 (160890953) | A (0.49) | 0.27 (1.4 × 10⁻⁶) | 1.5% | 1.0 (0.82) |
| rs6415084 | LPA intron 29 (160900320) | A (0.47) | 0.16 (5.6 × 10⁻³) | 0.44% | 0.87 (0.22) |
| rs3798221 | LPA intron 29 (160918138) | A (0.20) | −0.37 (1.7 × 10⁻⁷) | 1.7% | 1.1 (0.48) |
| rs10455872 | LPA intron 25 (160930108) | G (0.08) | 1.7 (6.2 × 10−62) | 17% | 2.1 (0.0013) |
| rs1367209 | LPA intron 2 (161002837) | G (0.27) | −0.13 (0.047) | 0.19% | 1.0 (0.98) |
| rs1321195 | LPA intron 2 (161004146) | A (0.15) | −0.38 (2.4 × 10⁻⁶) | 1.4% | 0.95 (0.74) |
| rs783149 | LPA 5’ near gene (161008908) | A (0.17) | −0.054 (0.48) | −0.033% | 1.1 (0.70) |
| rs1358753 | Intergenic (161010560) | C (0.13) | 0.19 (0.024) | 0.27% | 0.99 (0.94) |
| rs9458005 | Intergenic (161038567) | G (0.22) | 0.19 (0.0056) | 0.44% | 1.0 (0.73) |
| rs1950562 | PLG 5’ near gene (161043175) | A (0.42) | −0.13 (0.021) | 0.28% | 1.1 (0.22) |
| rs9458011 | PLG intron 1 (161046313) | A (0.06) | −0.065 (0.60) | −0.048% | 0.90 (0.66) |
| rs1853017 | PLG intron 4 (161053036) | A (0.29) | −0.55 (2.6 × 10⁻¹⁹) | 5.1% | 0.70 (0.0042) |
| rs2295368 | PLG intron 8 (161059492) | A (0.40) | 0.19 (0.0012) | 0.63% | 1.1 (0.45) |
| rs9456577 | PLG intron 10 (161065236) | C (0.03) | 0.25 (0.16) | 0.062% | 0.89 (0.77) |
| rs4252129 | PLG exon 12 R→W (161072895) | A (0.01) | −0.40 (0.098) | 0.11% | 1.9 (0.22) |
| rs813641 | PLG intron 12 (161073980) | A (0.16) | 0.021 (0.79) | −0.061% | 1.3 (0.066) |
| rs1317026 | PLG intron 12 (161074945) | A (0.02) | 0.33 (0.12) | 0.096% | 1.7 (0.22) |
| rs2859879 | PLG intron 15 (161080073) | G (0.32) | 0.40 (2.9 × 10⁻¹¹) | 2.8% | 1.3 (0.013) |
| rs4252170 | PLG exon 17 A→A (161082396) | G (0.08) | 0.27 (0.014) | 0.33% | 1.3 (0.24) |
| rs783182 | PLG intron 17 (161088538) | G (0.48) | −0.12 (0.048) | 0.19% | 0.84 (0.14) |
| rs783176 | PLG intron 17 (161090825) | G (0.17) | 0.15 (0.054) | 0.18% | 1.3 (0.13) |
Effect sizes and p-values are derived from testing each SNP separately by regression. Bold indicates those SNPs showing significant association with CAAD at p < 0.05.
LPA exons are numbered based on 6 KIV2 repeats as in NCBI Genome Build 36.3.
Percent variation is based on the difference in adjusted r2 values; negative values occur if a SNP explains less variation in Lp(a) than expected by chance for an additional model term.
Odds ratios are for the minor allele.
Figure 1. Proportion of variance in Lp(a) level explained by SNPs and KIV2 copy number.
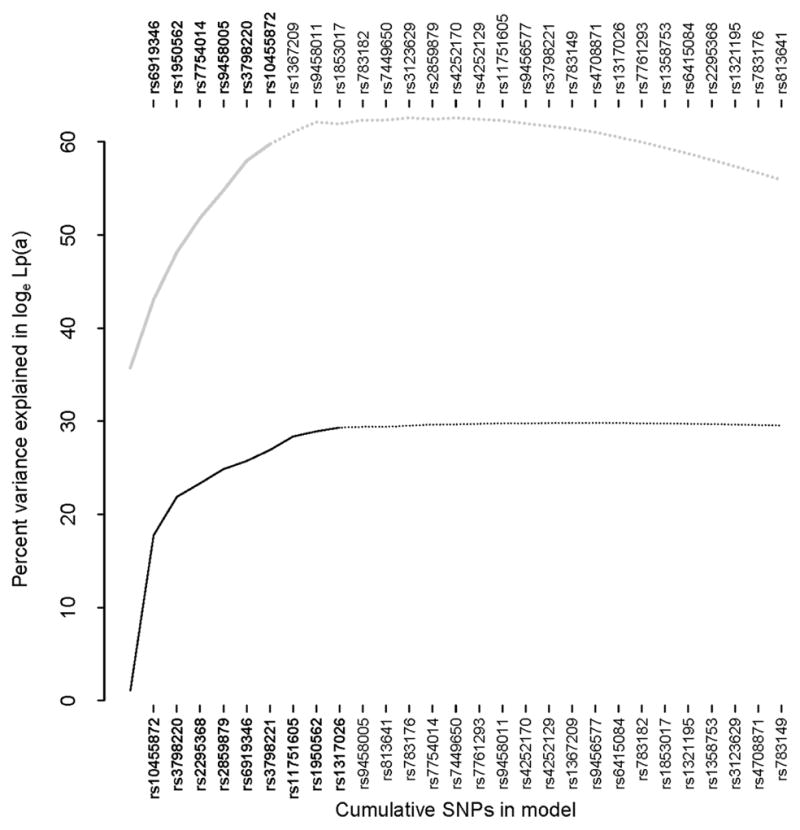
Curves show the percent variation in Lp(a) level as SNPs are added sequentially in backward stepwise regression; bold indicates p < 0.05. The upper gray curve and SNPs listed along the top correspond to a model including KIV2 number. The leftmost point on the upper curve corresponds to KIV2 alone.
Haplotypes formed by these 9 SNPs showed significant association with Lp(a) levels but did not improve the percent variance explained compared to the multi-SNP model. The minor alleles of rs10455872 and rs3798820 mark haplotypes carrying short KIV2 alleles and are associated with elevated Lp(a) levels. In a global search of all 2 and 3 SNP haplotypes, the minor allele haplotypes (GA and AG) of these two SNPs were the strongest predictors of elevated Lp(a) (Table 3). To determine whether a haplotype associated with elevated Lp(a) on the major allele backgrounds of rs10455872 and rs3798820 could be identified, we analyzed all possible combinations of 2 and 3 SNP haplotypes formed from the 7 remaining SNPs. One haplotype marked by several SNPs, including GA of rs6919346 and rs2295368 and GCA of rs6919346, rs3798221, and rs2295368 was associated with higher Lp(a) level (Bonferroni corrected p-values of 4.1 × 10⁻¹² and 8.3 × 10⁻¹⁸ for 21 and 35 two and three SNP haplotypes tested, respectively). However, models explicitly including this haplotype did not account for much more variance in Lp(a) level (25%) than the model that included the underlying SNPs as independent additive covariates (24%).
Table 3.
Haplotype analyses for Lp(a) and CAAD.
| Trait | SNPs | High risk haplotypes(s)* | Frequency | Lp(a) β or CAAD OR | P-value (Lp(a) % variance)† |
|---|---|---|---|---|---|
| Lp(a) | rs3798221/rs10455872 | GA | 0.017 | 1.8 | 1.3 × 10−76 (21%) |
| AG | 0.076 | 1.8 | |||
| Lp(a) | rs6919346/rs3798221/rs10455872 | GGA | 0.017 | 2.1 | 5.0 × 10−82 (23%) |
| GAG | 0.075 | 2.1 | |||
| GAA | 0.75 | 0.42 | |||
| Lp(a) | rs6919346/rs3798220/rs10455872/rs2295368‡ | GAAA | 0.34 | 0.62 | 4.1 × 10⁻¹² (25%) |
| Lp(a) | rs6919346/rs3798220/rs3798221/rs10455872/rs2295368‡ | GACAA | 0.27 | 0.94 | 8.3 × 10⁻¹⁸ (25%) |
| CAAD | rs6919346/rs10455872 | GG | 0.075 | 2.0 | 0.020 |
| CAAD | rs3123629/rs6919346/rs10455872 | AGG | 0.066 | 2.1 | 0.054 |
Haplotype analyses were performed using covariates as described in Methods.
Haplotypes among the set tested with the largest β for Lp(a) or OR for CAAD.
P-values are for the global test of no difference between haplotypes versus any differences and are Bonferroni corrected for the number of haplotypes tested.
Conditional on the major allele (AA) background of rs3798220 and rs10455872.
KIV2 copy number effects
We assayed KIV2 repeat length in a subset of 90 individuals that were approximately representative of 1496 individuals for whom Lp(a) levels were measured. The distribution of Lp(a) level was indistinguishable between these 90 individuals selected for KIV2 typing compared with the complete sample (Kolmogorov-Smirnov p = 0.64), as were the frequencies of CAAD cases and controls (Fisher’s test p = 0.66). The distributions of all non-genetic covariates were similar between the subsample and complete sample (data not shown). Although six SNPs showed significantly greater minor allele frequencies in the sub-sample at a p-value of 0.05 (Supplementary Table 2), these SNPs did not tend to be better predictors of Lp(a) level conditional on KIV2 effects (Figure 1).
Although the KIV2 copy number polymorphism alone accounted for a greater percentage of Lp(a) level variation than the 9 SNPs described above, SNPs added independent explanatory power not captured by the kringle genotype (upper curve in Figure 1). The dominant KIV2 repeat length (see Methods) showed significant association with Lp(a) level (p = 1.1 × 10⁻⁴), and conditional on this dominant repeat, there was no further information for Lp(a) prediction provided by either the short (p = 0.58) or long (p = 0.89) isoform. The dominant KIV2 repeat length combined with 6 SNPs included in backward stepwise regression at a p-value of 0.05 (FDR = 0.16) accounted for 60% of the variation in loge Lp(a) in the subset of 90 individuals for whom KIV2 genotypes were assayed and 57% in controls alone. Although the FDR is rather liberal, the two weakest predictors, rs3798220 and rs10455872 (p = 0.0083 and p = 0.034, respectively), have previously been shown to predict Lp(a) level conditional on KIV2 repeat number.41, 42
Prediction of CAAD by SNPs
Five SNPs, spanning 3 separate LD blocks, showed significant association with CAAD at a p-value of 0.05, corresponding to a FDR of 0.19 (Figure 2 and Table 2). All 5 SNPs showed significant association with Lp(a) level, and for each SNP the same allele associated with increased Lp(a) was also associated with increased risk of CAAD. At more stringent p-value threshold of 0.01, 3 SNPs were significantly associated with CAAD (FDR = 0.065). The most significant SNP, rs10455872, whose minor allele confers an odds ratio of 2.1 per allele (95% CI = 1.3 to 3.2; p = 0.0013), was significant at a family-wise error rate of 0.05 (corresponding to p = 0.0024) estimated by permutation testing.
Figure 2. CAAD association results, gene structure, and LD patterns in the 6q26-27 region.
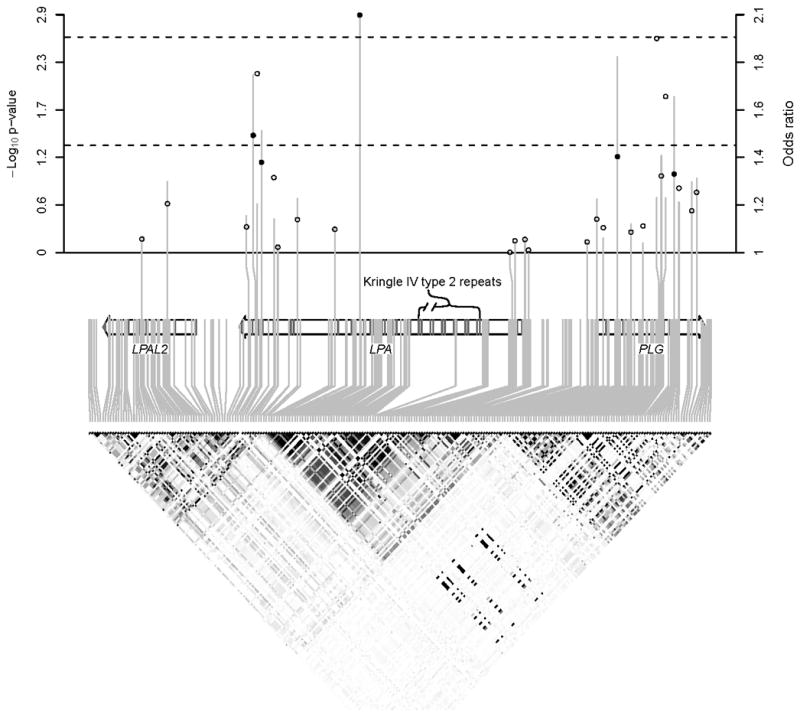
Vertical lines (circles) in the upper panel show −log10 p-values (risk allele odds ratios) for association between tagSNPs and CAAD. Dashed lines indicate p = 0.05 and p = 0.0024 (family wise error rate < 0.05). Solid circles correspond to SNPs with p < 0.05. The lower panel shows HapMap LD, with darker shading indicating larger |r2|.
An additive genetic risk score in which alleles of each of the 9 SNPs were weighted according to their effect on Lp(a) level improved prediction of CAAD risk (OR = 1.5 per unit increase in risk score; p = 7.9 × 10⁻⁵). We also performed a comprehensive search of all 2 and 3 SNP haplotypes that could be formed from the 28 tagSNPs in the region. A 2 SNP haplotype formed by rs10455872 and rs6919346 was significantly associated with CAAD (nominal p = 5.2 × 10⁻⁵; p = 0.020 after Bonferroni correction for 378 two SNP haplotypes tested). Among 3 SNP haplotypes, the rs10455872, rs6919346, rs3123629 system was nearly significant (nominal p = 1.7 × 10⁻⁵; Bonferroni corrected p = 0.054 for 3276 haplotypes tested).
Prediction of CAAD by SNPs conditional on Lp(a)
After accounting for Lp(a) level, CAAD status was no longer associated with genetic variation in the 6q26-27 region. When Lp(a) level was included as a covariate in CAAD analyses, the minimum p-value across the 28 tagSNPs analyzed was 0.088 (FDR = 1). In a model including both Lp(a) level and the genetic risk score described above, Lp(a) level (OR = 1.40 per unit increase; p = 2.6 × 10⁻⁷) but not the risk score (OR = 1.08; p = 0.52) was associated with CAAD. Neither the 2 SNP haplotype system formed by rs10455872 and rs6919346 (nominal p = 0.37), nor the 3 SNP haplotype system formed by the rs10455872, rs6919346, and rs3123629 (nominal p = 0.313) was a significant predictor of CAAD after accounting for Lp(a) level. Among all possible 2 and 3 SNP haplotypes, the minimum p-values observed after conditioning on Lp(a) level (p = 0.044 and 0.0024, respectively) were well within the expectation for the null distribution.
Discussion
We identified 9 SNPs that are significantly associated with Lp(a) level when analyzed jointly and a partially overlapping set of 6 SNPs that were significantly associated with Lp(a) level when analyzed conditional on KIV2 repeat length. Among the 9 SNPs predictive of Lp(a) independent of KIV2 length, 5 overlapped with the set of 7 SNPs described by Clarke et al.22 Among the 6 SNPs predictive of Lp(a) conditional on KIV2 repeat, 4 overlapped with previous reports.41, 42 In particular, rs10455872, which marks a haplotype carrying a low KIV2 copy number, and rs3798220, which is in LD with both the KIV2 copy number polymorphism and the SLC22A3-LPAL2-LPA haplotype associated with coronary artery disease,43 are strongly associated with Lp(a) level. Interestingly, both of these SNPs continued to be associated with Lp(a) level after accounting for KIV2 repeat length, consistent with previous observations.41, 42 It has been proposed that the nonsynonymous SNP rs3798220 may affect protein stability,41 while rs10455872 may be in LD with regulatory variants.44 Alternatively, their continued association with Lp(a) level after regressing on KIV2 effect may reflect inaccuracies in measurement of or statistical modeling of KIV2 repeat length.
Although we identified multiple SNPs that jointly predict Lp(a) level, these SNPs accounted for just over half of the variance in Lp(a) level explained by KIV2 alone. Our ability to only partially capture KIV2 copy number effects using SNP markers is consistent with the theoretical expectation of high expansion and contraction mutation rates for copy number variants and repeat polymorphisms45, 46 as well as previous empirical data suggesting weak LD between the KIV2 copy polymorphism and surrounding variation.47 Moreover, a pentanucleotide repeat polymorphism upstream of LPA reportedly accounts for 10–14% of the variation in Lp(a) level.48 In addition to the possibility that recurrent mutation has placed the same KIV2 and pentanucleotide repeat alleles on multiple haplotype backgrounds, another plausible explanation for the observation that multiple tagSNPs are jointly associated with Lp(a) level is the existence of numerous rare variants in the region which can lead to high rates of synthetic association.49
Our finding that tagSNPs improve prediction of Lp(a) level when combined with KIV2 genotype is consistent with a recent report by Lanktree et al.42 However, in Caucasian individuals Lanktree et al. report that only 36% of the variance in Lp(a) level can be explained by SNPs and KIV2 copy number. In contrast, in a large coronary artery disease cohort Clarke et al.22 report that 36% of Lp(a) level can be explained by rs10455872 and rs3798220 alone. In our CAAD cohort we found that these two SNPs explain only 22% (20% in controls) of Lp(a) variance whereas SNPs and the KIV2 repeat explain 60% (57% in controls). One explanation for such heterogeneous estimates is that ascertainment on vascular disease and for KIV2 typing introduces an upward bias into estimates of percent variance explained in Lp(a); these limitations require that our estimates of the percent variation in Lp(a) explained be interpreted with some caution. However, with regard to ascertainment on CAAD, the differences between the percent variation explained in our total sample compared to controls only were modest, and in randomly ascertained families where variance explained would be expected to be less, Boerwinkle et al.12 estimate that 69% of the variance in Lp(a) is due to KIV2 copy number and 90% of the variance in Lp(a) is due to variation at the LPA locus in general. These mutually inconsistent results highlight the difficulties in accurately assaying and modeling Lp(a) and KIV2 copy number, and underscore the importance of identifying alternative genetic markers in the region.
Our observation that LPA region SNPs and haplotypes predict CAAD extends that of Clarke et al.22 who found that 6q26-27 SNPs are associated with coronary artery disease. In fact, rs10455872 confers a higher risk of carotid disease (OR = 2.1) than any SNP among a panel of 34 markers associated with elevated LDL or decreased HDL (highest OR = 1.8).21 In general, the genetic effects on CAAD that we observe are consistent with those reported by Clarke et al. and others for the LPAL2-LPA-PLG locus. Although due to its low minor allele frequency rs3798220 failed to achieve statistical significance in our study, the odds ratio for the minor allele (1.8) is within the confidence intervals for the effect of this variant on CAD risk reported in other studies.22, 41, 50 We also found, in agreement with Clarke et al., that conditioning on Lp(a) level eliminated the association signal in the 6p26-27 region. This has several implications. First, since SNP genotypes undergo “Mendelian randomization”, their use as an instrumental variable51 indicates that Lp(a) levels are causal for CAAD as well as coronary artery disease, as previously suggested,17 rather than the reverse. Second, because conditioning on Lp(a) level abolished any evidence of association between tagSNPs or haplotypes and CAAD, this argues against the presence of common structural variation, such as non-synonymous changes, within LPA that effect protein function without affecting protein level. Third, in spite of a lack of standardization,23 direct measurement of Lp(a) surpasses use of genetic polymorphisms as a surrogate marker.
Summary
In summary, we identified 9 SNPs that jointly accounted for 30% of the variation in Lp(a) levels. This was less variance explained than by use of KIV2 repeat number alone, but by combining 6 SNPs with KIV2 repeat number we accounted for 60% of the variance in Lp(a) levels. Five SNPs, all of which were strongly associated with Lp(a) levels, predicted CAAD risk, but these associations, as well has haplotype based CAAD association signals within the LPAL2-LPA-PLG region, appeared to be driven exclusively by interindividual variation in Lp(a) levels.
Supplementary Material
Acknowledgments
Most importantly we would like to thank the study participants. We would also like to thank the following people for their technical assistance: Tamara Bacus, Julieann Marshall, Laura McKinstry, Loida Erhard, Karen Nakayama, Jane Ranchalis, and Jeff Rodenbaugh.
Sources of funding: This work was funded by the National Institutes of Health (NIH) PO1 HL 30086 and RO1 HL67406. This work was supported in part by resources from the VA Puget Sound Health Care System, Seattle, Washington, including the Veteran Affairs Epidemiology Research and Information Center Program (award CSP 701S).
Footnotes
Disclosure: The authors have no conflicts of interest to declare.
Author Contributions
JR, RR, FC, and GPJ analyzed the data and wrote the paper.
Publisher's Disclaimer: This is a PDF file of an unedited manuscript that has been accepted for publication. As a service to our customers we are providing this early version of the manuscript. The manuscript will undergo copyediting, typesetting, and review of the resulting proof before it is published in its final citable form. Please note that during the production process errors may be discovered which could affect the content, and all legal disclaimers that apply to the journal pertain.
References
- 1.Goldstein LB, Adams R, Alberts MJ, Appel LJ, Brass LM, Bushnell CD, Culebras A, Degraba TJ, Gorelick PB, Guyton JR, Hart RG, Howard G, Kelly-Hayes M, Nixon JV, Sacco RL. Primary prevention of ischemic stroke: A guideline from the american heart association/american stroke association stroke council: Cosponsored by the atherosclerotic peripheral vascular disease interdisciplinary working group; cardiovascular nursing council; clinical cardiology council; nutrition, physical activity, and metabolism council; and the quality of care and outcomes research interdisciplinary working group: The american academy of neurology affirms the value of this guideline. Stroke. 2006;37:1583–1633. doi: 10.1161/01.STR.0000223048.70103.F1. [DOI] [PubMed] [Google Scholar]
- 2.Samuelson RM, Levy EI, Siddiqui AH, Hopkins LN. The cost of stroke prevention. Stroke. 2009;40:e41–42. doi: 10.1161/STROKEAHA.108.520734. author reply e43. [DOI] [PubMed] [Google Scholar]
- 3.North KE, MacCluer JW, Devereux RB, Howard BV, Welty TK, Best LG, Lee ET, Fabsitz RR, Roman MJ. Heritability of carotid artery structure and function: The strong heart family study. Arterioscler Thromb Vasc Biol. 2002;22:1698–1703. doi: 10.1161/01.atv.0000032656.91352.5e. [DOI] [PubMed] [Google Scholar]
- 4.Zannad F, Visvikis S, Gueguen R, Sass C, Chapet O, Herbeth B, Siest G. Genetics strongly determines the wall thickness of the left and right carotid arteries. Hum Genet. 1998;103:183–188. doi: 10.1007/s004390050804. [DOI] [PubMed] [Google Scholar]
- 5.Jartti L, Ronnemaa T, Kaprio J, Jarvisalo MJ, Toikka JO, Marniemi J, Hammar N, Alfredsson L, Saraste M, Hartiala J, Koskenvuo M, Raitakari OT. Population-based twin study of the effects of migration from finland to sweden on endothelial function and intima-media thickness. Arterioscler Thromb Vasc Biol. 2002;22:832–837. doi: 10.1161/01.atv.0000013313.70875.a7. [DOI] [PubMed] [Google Scholar]
- 6.Lange LA, Bowden DW, Langefeld CD, Wagenknecht LE, Carr JJ, Rich SS, Riley WA, Freedman BI. Heritability of carotid artery intima-medial thickness in type 2 diabetes. Stroke. 2002;33:1876–1881. doi: 10.1161/01.str.0000019909.71547.aa. [DOI] [PubMed] [Google Scholar]
- 7.Fox CS, Polak JF, Chazaro I, Cupples A, Wolf PA, D'Agostino RA, O'Donnell CJ. Genetic and environmental contributions to atherosclerosis phenotypes in men and women: Heritability of carotid intima-media thickness in the framingham heart study. Stroke. 2003;34:397–401. doi: 10.1161/01.str.0000048214.56981.6f. [DOI] [PubMed] [Google Scholar]
- 8.Manolio TA, Boerwinkle E, O'Donnell CJ, Wilson AF. Genetics of ultrasonographic carotid atherosclerosis. Arterioscler Thromb Vasc Biol. 2004;24:1567–1577. doi: 10.1161/01.ATV.0000138789.11433.c1. [DOI] [PubMed] [Google Scholar]
- 9.Klein JH, Hegele RA, Hackam DG, Koschinsky ML, Huff MW, Spence JD. Lipoprotein(a) is associated differentially with carotid stenosis, occlusion, and total plaque area. Arterioscler Thromb Vasc Biol. 2008;28:1851–1856. doi: 10.1161/ATVBAHA.108.169292. [DOI] [PubMed] [Google Scholar]
- 10.Ohira T, Schreiner PJ, Morrisett JD, Chambless LE, Rosamond WD, Folsom AR. Lipoprotein(a) and incident ischemic stroke: The atherosclerosis risk in communities (aric) study. Stroke. 2006;37:1407–1412. doi: 10.1161/01.STR.0000222666.21482.b6. [DOI] [PubMed] [Google Scholar]
- 11.Kraft HG, Kochl S, Menzel HJ, Sandholzer C, Utermann G. The apolipoprotein (a) gene: A transcribed hypervariable locus controlling plasma lipoprotein (a) concentration. Hum Genet. 1992;90:220–230. doi: 10.1007/BF00220066. [DOI] [PubMed] [Google Scholar]
- 12.Boerwinkle E, Leffert CC, Lin J, Lackner C, Chiesa G, Hobbs HH. Apolipoprotein(a) gene accounts for greater than 90% of the variation in plasma lipoprotein(a) concentrations. J Clin Invest. 1992;90:52–60. doi: 10.1172/JCI115855. [DOI] [PMC free article] [PubMed] [Google Scholar]
- 13.Brunner C, Lobentanz EM, Petho-Schramm A, Ernst A, Kang C, Dieplinger H, Muller HJ, Utermann G. The number of identical kringle iv repeats in apolipoprotein(a) affects its processing and secretion by hepg2 cells. J Biol Chem. 1996;271:32403–32410. doi: 10.1074/jbc.271.50.32403. [DOI] [PubMed] [Google Scholar]
- 14.Gavish D, Azrolan N, Breslow JL. Plasma ip(a) concentration is inversely correlated with the ratio of kringle iv/kringle v encoding domains in the apo(a) gene. J Clin Invest. 1989;84:2021–2027. doi: 10.1172/JCI114395. [DOI] [PMC free article] [PubMed] [Google Scholar]
- 15.Utermann G, Kraft HG, Menzel HJ, Hopferwieser T, Seitz C. Genetics of the quantitative lp(a) lipoprotein trait. I. Relation of lp(a) glycoprotein phenotypes to lp(a) lipoprotein concentrations in plasma. Hum Genet. 1988;78:41–46. doi: 10.1007/BF00291232. [DOI] [PubMed] [Google Scholar]
- 16.Kraft HG, Lingenhel A, Kochl S, Hoppichler F, Kronenberg F, Abe A, Muhlberger V, Schonitzer D, Utermann G. Apolipoprotein(a) kringle iv repeat number predicts risk for coronary heart disease. Arterioscler Thromb Vasc Biol. 1996;16:713–719. doi: 10.1161/01.atv.16.6.713. [DOI] [PubMed] [Google Scholar]
- 17.Kamstrup PR, Tybjaerg-Hansen A, Steffensen R, Nordestgaard BG. Genetically elevated lipoprotein(a) and increased risk of myocardial infarction. Jama. 2009;301:2331–2339. doi: 10.1001/jama.2009.801. [DOI] [PubMed] [Google Scholar]
- 18.Sharrett AR, Sorlie PD, Chambless LE, Folsom AR, Hutchinson RG, Heiss G, Szklo M. Relative importance of various risk factors for asymptomatic carotid atherosclerosis versus coronary heart disease incidence: The atherosclerosis risk in communities study. Am J Epidemiol. 1999;149:843–852. doi: 10.1093/oxfordjournals.aje.a009900. [DOI] [PubMed] [Google Scholar]
- 19.Gschwendtner A, Bevan S, Cole JW, Plourde A, Matarin M, Ross-Adams H, Meitinger T, Wichmann E, Mitchell BD, Furie K, Slowik A, Rich SS, Syme PD, MacLeod MJ, Meschia JF, Rosand J, Kittner SJ, Markus HS, Muller-Myhsok B, Dichgans M, Consortium ISG. Sequence variants on chromosome 9p21.3 confer risk for atherosclerotic stroke. Ann Neurol. 2009;65:531–539. doi: 10.1002/ana.21590. [DOI] [PMC free article] [PubMed] [Google Scholar]
- 20.Karvanen J, Silander K, Kee F, Tiret L, Salomaa V, Kuulasmaa K, Wiklund PG, Virtamo J, Saarela O, Perret C, Perola M, Peltonen L, Cambien F, Erdmann J, Samani NJ, Schunkert H, Evans A. The impact of newly identified loci on coronary heart disease, stroke and total mortality in the morgam prospective cohorts. Genet Epidemiol. 2009;33:237–246. doi: 10.1002/gepi.20374. [DOI] [PMC free article] [PubMed] [Google Scholar]
- 21.Ronald J, Rajagopalan R, Ranchalis JE, Marshall JK, Hatsukami TS, Heagerty PJ, Jarvik GP. Analysis of recently identified dyslipidemia alleles reveals two loci that contribute to risk for carotid artery disease. Lipids Health Dis. 2009;8:52. doi: 10.1186/1476-511X-8-52. [DOI] [PMC free article] [PubMed] [Google Scholar]
- 22.Clarke R, Peden JF, Hopewell JC, Kyriakou T, Goel A, Heath SC, Parish S, Barlera S, Franzosi MG, Rust S, Bennett D, Silveira A, Malarstig A, Green FR, Lathrop M, Gigante B, Leander K, de Faire U, Seedorf U, Hamsten A, Collins R, Watkins H, Farrall M. Genetic variants associated with lp(a) lipoprotein level and coronary disease. N Engl J Med. 2009;361:2518–2528. doi: 10.1056/NEJMoa0902604. [DOI] [PubMed] [Google Scholar]
- 23.Marcovina SM, Koschinsky ML, Albers JJ, Skarlatos S. Report of the national heart, lung, and blood institute workshop on lipoprotein(a) and cardiovascular disease: Recent advances and future directions. Clin Chem. 2003;49:1785–1796. doi: 10.1373/clinchem.2003.023689. [DOI] [PubMed] [Google Scholar]
- 24.Jarvik GP, Rozek LS, Brophy VH, Hatsukami TS, Richter RJ, Schellenberg GD, Furlong CE. Paraoxonase (pon1) phenotype is a better predictor of vascular disease than is pon1(192) or pon1(55) genotype. Arterioscler Thromb Vasc Biol. 2000;20:2441–2447. doi: 10.1161/01.atv.20.11.2441. [DOI] [PubMed] [Google Scholar]
- 25.Crawford DC, Nord AS, Badzioch MD, Ranchalis J, McKinstry LA, Ahearn M, Bertucci C, Shephard C, Wong M, Rieder MJ, Schellenberg GD, Nickerson DA, Heagerty PJ, Wijsman EM, Jarvik GP. A common vldlr polymorphism interacts with apoe genotype in the prediction of carotid artery disease risk. J Lipid Res. 2008;49:588–596. doi: 10.1194/jlr.M700409-JLR200. [DOI] [PubMed] [Google Scholar]
- 26.Ober C, Nord AS, Thompson EE, Pan L, Tan Z, Cusanovich D, Sun Y, Nicolae R, Edelstein C, Schneider DH, Billstrand C, Pfaffinger D, Phillips N, Anderson RL, Philips B, Rajagopalan R, Hatsukami TS, Rieder MJ, Heagerty PJ, Nickerson DA, Abney M, Marcovina S, Jarvik GP, Scanu AM, Nicolae DL. Genome-wide association study of plasma lipoprotein(a) levels identifies multiple genes on chromosome 6q. J Lipid Res. 2009;50:798–806. doi: 10.1194/jlr.M800515-JLR200. [DOI] [PMC free article] [PubMed] [Google Scholar]
- 27.Pritchard JK, Stephens M, Donnelly P. Inference of population structure using multilocus genotype data. Genetics. 2000;155:945–959. doi: 10.1093/genetics/155.2.945. [DOI] [PMC free article] [PubMed] [Google Scholar]
- 28.Keating BJ, Tischfield S, Murray SS, Bhangale T, Price TS, Glessner JT, Galver L, Barrett JC, Grant SF, Farlow DN, Chandrupatla HR, Hansen M, Ajmal S, Papanicolaou GJ, Guo Y, Li M, Derohannessian S, de Bakker PI, Bailey SD, Montpetit A, Edmondson AC, Taylor K, Gai X, Wang SS, Fornage M, Shaikh T, Groop L, Boehnke M, Hall AS, Hattersley AT, Frackelton E, Patterson N, Chiang CW, Kim CE, Fabsitz RR, Ouwehand W, Price AL, Munroe P, Caulfield M, Drake T, Boerwinkle E, Reich D, Whitehead AS, Cappola TP, Samani NJ, Lusis AJ, Schadt E, Wilson JG, Koenig W, McCarthy MI, Kathiresan S, Gabriel SB, Hakonarson H, Anand SS, Reilly M, Engert JC, Nickerson DA, Rader DJ, Hirschhorn JN, Fitzgerald GA. Concept, design and implementation of a cardiovascular gene-centric 50 k snp array for large-scale genomic association studies. PLoS One. 2008;3:e3583. doi: 10.1371/journal.pone.0003583. [DOI] [PMC free article] [PubMed] [Google Scholar]
- 29.Marcovina SM, Albers JJ, Gabel B, Koschinsky ML, Gaur VP. Effect of the number of apolipoprotein(a) kringle 4 domains on immunochemical measurements of lipoprotein(a) Clin Chem. 1995;41:246–255. [PubMed] [Google Scholar]
- 30.Marcovina SM, Zhang ZH, Gaur VP, Albers JJ. Identification of 34 apolipoprotein(a) isoforms: Differential expression of apolipoprotein(a) alleles between american blacks and whites. Biochem Biophys Res Commun. 1993;191:1192–1196. doi: 10.1006/bbrc.1993.1343. [DOI] [PubMed] [Google Scholar]
- 31.Marcovina SM, Hobbs HH, Albers JJ. Relation between number of apolipoprotein(a) kringle 4 repeats and mobility of isoforms in agarose gel: Basis for a standardized isoform nomenclature. Clin Chem. 1996;42:436–439. [PubMed] [Google Scholar]
- 32.Fan JB, Oliphant A, Shen R, Kermani BG, Garcia F, Gunderson KL, Hansen M, Steemers F, Butler SL, Deloukas P, Galver L, Hunt S, McBride C, Bibikova M, Rubano T, Chen J, Wickham E, Doucet D, Chang W, Campbell D, Zhang B, Kruglyak S, Bentley D, Haas J, Rigault P, Zhou L, Stuelpnagel J, Chee MS. Highly parallel snp genotyping. Cold Spring Harb Symp Quant Biol. 2003;68:69–78. doi: 10.1101/sqb.2003.68.69. [DOI] [PubMed] [Google Scholar]
- 33.Scheet P, Stephens M. A fast and flexible statistical model for large-scale population genotype data: Applications to inferring missing genotypes and haplotypic phase. Am J Hum Genet. 2006;78:629–644. doi: 10.1086/502802. [DOI] [PMC free article] [PubMed] [Google Scholar]
- 34.The International HapMap Consortium. The international hapmap project. Nature. 2003;426:789–796. doi: 10.1038/nature02168. [DOI] [PubMed] [Google Scholar]
- 35.Carlson CS, Eberle MA, Rieder MJ, Yi Q, Kruglyak L, Nickerson DA. Selecting a maximally informative set of single-nucleotide polymorphisms for association analyses using linkage disequilibrium. Am J Hum Genet. 2004;74:106–120. doi: 10.1086/381000. [DOI] [PMC free article] [PubMed] [Google Scholar]
- 36.Purcell S, Neale B, Todd-Brown K, Thomas L, Ferreira MA, Bender D, Maller J, Sklar P, de Bakker PI, Daly MJ, Sham PC. Plink: A tool set for whole-genome association and population-based linkage analyses. Am J Hum Genet. 2007;81:559–575. doi: 10.1086/519795. [DOI] [PMC free article] [PubMed] [Google Scholar]
- 37.R Development Core Team. R. A language and environment for statistical computing. 2009. [Google Scholar]
- 38.National Cholesterol Education Program (NCEP) Expert Panel on Detection Evaluation and Treatment of High Blood Cholesterol in Adults (Adult Treatment Panel III) Third report of the national cholesterol education program (ncep) expert panel on detection, evaluation, and treatment of high blood cholesterol in adults (adult treatment panel iii) final report. Circulation. 2002;106:3143–3421. [PubMed] [Google Scholar]
- 39.Chobanian AV, Bakris GL, Black HR, Cushman WC, Green LA, Izzo JL, Jr, Jones DW, Materson BJ, Oparil S, Wright JT, Jr, Roccella EJ. Seventh report of the joint national committee on prevention, detection, evaluation, and treatment of high blood pressure. Hypertension. 2003;42:1206–1252. doi: 10.1161/01.HYP.0000107251.49515.c2. [DOI] [PubMed] [Google Scholar]
- 40.Benjamini Y, Hochberg Y. Controlling the false discovery rate: A practical and powerful approach to multiple testing. J Roy Statist Soc Ser B. 1995;57:289–300. [Google Scholar]
- 41.Luke MM, Kane JP, Liu DM, Rowland CM, Shiffman D, Cassano J, Catanese JJ, Pullinger CR, Leong DU, Arellano AR, Tong CH, Movsesyan I, Naya-Vigne J, Noordhof C, Feric NT, Malloy MJ, Topol EJ, Koschinsky ML, Devlin JJ, Ellis SG. A polymorphism in the protease-like domain of apolipoprotein(a) is associated with severe coronary artery disease. Arterioscler Thromb Vasc Biol. 2007;27:2030–2036. doi: 10.1161/ATVBAHA.107.141291. [DOI] [PubMed] [Google Scholar]
- 42.Lanktree MB, Anand SS, Yusuf S, Hegele RA. Comprehensive analysis of genomic variation in the lpa locus and its relationship to plasma lipoprotein(a) in south asians, chinese, and european caucasians. Circ Cardiovasc Genet. 3:39–46. doi: 10.1161/CIRCGENETICS.109.907642. [DOI] [PubMed] [Google Scholar]
- 43.Tregouet DA, Konig IR, Erdmann J, Munteanu A, Braund PS, Hall AS, Grosshennig A, Linsel-Nitschke P, Perret C, DeSuremain M, Meitinger T, Wright BJ, Preuss M, Balmforth AJ, Ball SG, Meisinger C, Germain C, Evans A, Arveiler D, Luc G, Ruidavets JB, Morrison C, van der Harst P, Schreiber S, Neureuther K, Schafer A, Bugert P, El Mokhtari NE, Schrezenmeir J, Stark K, Rubin D, Wichmann HE, Hengstenberg C, Ouwehand W, Ziegler A, Tiret L, Thompson JR, Cambien F, Schunkert H, Samani NJ. Genome-wide haplotype association study identifies the slc22a3-lpal2-lpa gene cluster as a risk locus for coronary artery disease. Nat Genet. 2009;41:283–285. doi: 10.1038/ng.314. [DOI] [PubMed] [Google Scholar]
- 44.Schadt EE, Molony C, Chudin E, Hao K, Yang X, Lum PY, Karsarskis A, Zhang B, Wang S, Suver C, Zhu J, Millstein J, Sieberts S, Lamb J, GuhaThakurta D, Derry J, Storey JD, Avila-Campillo I, Kruger MJ, Johnson JM, Rohl CA, van Nas A, Mehrabian M, Drake TA, Lusis AJ, Smith RC, Guengerich FP, Strom SC, Schuetz E, Rushmore TH, Ulrich R. Mapping the genetic architecture of gene expression in human liver. PLoS Biology. 2008;6:e107. doi: 10.1371/journal.pbio.0060107. [DOI] [PMC free article] [PubMed] [Google Scholar]
- 45.Jarne P, Lagoda PJL. Microsatellites, from molecules to populations and back. Trends in Ecology and Evolution. 1996;11:424–429. doi: 10.1016/0169-5347(96)10049-5. [DOI] [PubMed] [Google Scholar]
- 46.Hastings PJ, Lupski JR, Rosenberg SM, Ira G. Mechanisms of change in gene copy number. Nat Rev Genet. 2009;10:551–564. doi: 10.1038/nrg2593. [DOI] [PMC free article] [PubMed] [Google Scholar]
- 47.Crawford DC, Peng Z, Cheng JF, Boffelli D, Ahearn M, Nguyen D, Shaffer T, Yi Q, Livingston RJ, Rieder MJ, Nickerson DA. Lpa and plg sequence variation and kringle iv-2 copy number in two populations. Hum Hered. 2008;66:199–209. doi: 10.1159/000143403. [DOI] [PMC free article] [PubMed] [Google Scholar]
- 48.Trommsdorff M, Kochl S, Lingenhel A, Kronenberg F, Delport R, Vermaak H, Lemming L, Klausen IC, Faergeman O, Utermann G, et al. A pentanucleotide repeat polymorphism in the 5' control region of the apolipoprotein(a) gene is associated with lipoprotein(a) plasma concentrations in caucasians. J Clin Invest. 1995;96:150–157. doi: 10.1172/JCI118015. [DOI] [PMC free article] [PubMed] [Google Scholar]
- 49.Dickson SP, Wang K, Krantz I, Hakonarson H, Goldstein DB. Rare variants create synthetic genome-wide associations. PLoS Biol. 8:e1000294. doi: 10.1371/journal.pbio.1000294. [DOI] [PMC free article] [PubMed] [Google Scholar]
- 50.Chasman DI, Shiffman D, Zee RY, Louie JZ, Luke MM, Rowland CM, Catanese JJ, Buring JE, Devlin JJ, Ridker PM. Polymorphism in the apolipoprotein(a) gene, plasma lipoprotein(a), cardiovascular disease, and low-dose aspirin therapy. Atherosclerosis. 2009;203:371–376. doi: 10.1016/j.atherosclerosis.2008.07.019. [DOI] [PMC free article] [PubMed] [Google Scholar]
- 51.Ebrahim S, Davey Smith G. Mendelian randomization: Can genetic epidemiology help redress the failures of observational epidemiology? Hum Genet. 2008;123:15–33. doi: 10.1007/s00439-007-0448-6. [DOI] [PubMed] [Google Scholar]
Associated Data
This section collects any data citations, data availability statements, or supplementary materials included in this article.