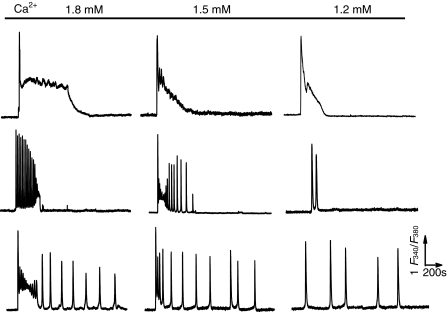
Fig. 4.
Influence of intracellular Ca2+ oscillations by extracellular Ca2+ concentration in single HEK293 cells. Typical traces represent the three main patterns of Ca2+ signal responses, sustained single Ca2+ rise (the upper panel), short lasting (the middle panel) and the typical Ca2+ transients (the bottom panel), to 5 μM Carb in 0.1 μM fura2 loaded cells incubated in the HBSS containing 1.8, 1.5 or 1.2 mM extracellular Ca2+ (3 groups) as indicated. These patterns of Ca2+ signals were found in the 3 groups of cells but with different occurrence proportion, which are further summarized in Table 1. Similar results were obtained from 58–216 cells in at least 16 independent experiments for all panels

