Abstract
In order to guarantee the quality of recombinant therapeutic proteins produced in mammalian cell systems, the straightforward approach in industry is to run the processes as reproducible as possible. It is first shown that considerable distortions in the currently operated processes appear when the initial cell density deviates from its nominal value. Small deviations in the initial cell mass may lead to severe deviations from the desired biomass trajectory. Next, it is shown how to design a fed-batch production process in such a way that it is robust with respect to variations in the viable cell density. A simple open loop strategy is proposed for that purpose. Here we show for the first time at animal cell cultures (CHO cells) that by means of an appropriate glutamine feed rate profile F(t), which keeps the specific growth rate of the cells on a predefined value below its maximal value while maintaining the viabilities on a high level, the diverging viable cell count profiles change over into a robust converging set of profiles. The CHO cells used to validate the procedure could be focused to any specific growth rates below μmax.
Keywords: Mammalian cell culture, Process reproducibility, Open loop control, Quality by design
Introduction
Product quality is of utmost importance for recombinant therapeutic protein production. In order to guarantee consistent product formation on a high quality level, a highly precise production process must be constructed, which forms the product with a high batch-to-batch reproducibility. This is a key requirement in FDA’s/EMA’s PAT (FDA 2004) initiative, as currently the reproducibility obtained in production processes for recombinant proteins from animal cell cultures is not convincing (e.g., Charaniya et al. 2010).
In order to keep the cells under control some limitation is required. From the many possibilities, substrate limitation is most often applied. Here we used glutamine limitation. The production processes should be run in the fed-batch mode, not only in order to increase productivity and to prevent the formation of inhibiting overflow metabolites (Butler 2005; Kuwae et al. 2005; Xie and Wang 2006; Ansorge et al. 2010; Gnoth et al. 2007) but also to increase process reproducibility.
From their history, most animal cell-based production processes are extended batch cultures where medium components are added in small discrete portions or semi-continuously (Wurm 2004). The only reason is to avoid substrate depletion. Thus, a real substrate limitation seldom exists along the entire cultivation period. The concentrations of the substrates must be in the order of magnitude of the saturation constants to run the process truly substrate-limited. Cultures that are in some way growth-limited are necessary to examine the relationship between the specific growth rate μ and the specific product formation rate qP. The latter characterizes the product formation performance of the cells. Different forms of the qp(μ) relationship were reported in literature (Miller et al. 1988; Robinson and Memmert 1991; Jang and Barford 2000).
Dynamics of CHO cultures
From an engineering perspective, optimization of the operational procedure of a cultivation process must be based on mechanistic process knowledge. This is best formulated in terms of dynamic process models that quantitatively describe the system’s response on the possible changes of the adjustable variables.
Their main variables are biomass x and product mass p as well as their corresponding specific rates μ and qP. The product mass p can be expressed as an integral
 |
which states that the viable biomass concentration Xv in a culture of weight W must be kept as high as possible during the entire cultivation time [0:t], and additionally, the performance of the cells, expressed by the specific product formation rate qP, must be maximal as well to obtain a large amount p of product at time t. Longevity is thus an important requirement for a high product mass.
This leads to the requirement of high cell density cultivations, as the biomass concentration X is the variable that can most easily be influenced in a bioreactor. X as well as qP, however, primarily depend on the specific biomass growth rate μ. From that point of view, μ is the straightforward choice of a control variable.
The specific growth rate can be controlled by varying the substrate feed rate in such a way that the culture is limited with respect to glucose or glutamine. With an exponential feed rate, μ can be kept constant at any given value smaller than μmax. Here we chose glutamine limitation to influence the energy metabolism, growth and reduce overflow metabolism as proposed by several authors (e.g., Ljunggren and Häggström 1992, 1994; Tremblay et al. 1993; Wong et al. 2004).
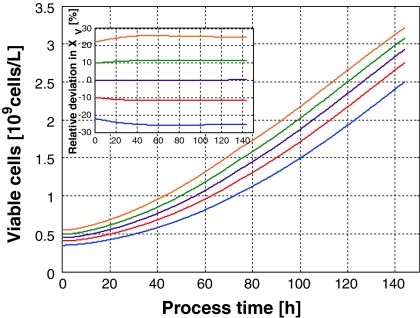
In an industrial production process, the feed rate F(t) must be selected beforehand and made available to the front-end controller at the process during the preparation period. When the profile is chosen in such a way that all cells work at their maximal growth rate μmax, small deviations in the inoculum size will lead to considerable deviations in the volumetric cell count at the end of the cultivation. This can simply be simulated. With the model of Tremblay et al. (1993) the influence of initial cell count concentration in cultivations with a predefined feed rate profile F(t) can simply be shown. Figure 1 shows that the biomass concentration trajectories are clearly diverging.
Fig. 1.
Influence of the initial cell concentration when the process is operated with the same feed rate profile at its maximal growth speed μmax. Note the clear divergence in the viable cell concentration profiles
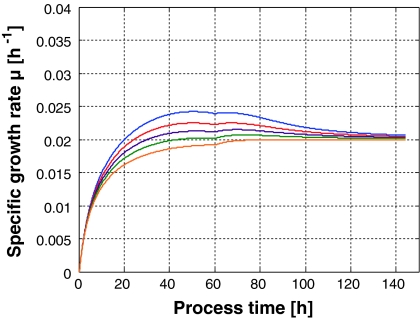
However, when the specific growth rate is chosen in such way that it is all the way smaller than μmax, the process becomes robust with respect to the initial cell concentration. This can easily be understood with a simple simulation depicted in Fig. 2 where the same initial cell counts were used.
Fig. 2.
Specific biomass growth rate in processes operated with a fixed feed rate profile F(t) determined for an exponential feed rate with μset = 0.02 h−1 when the initial biomass concentrations vary around the nominal value by ±20%
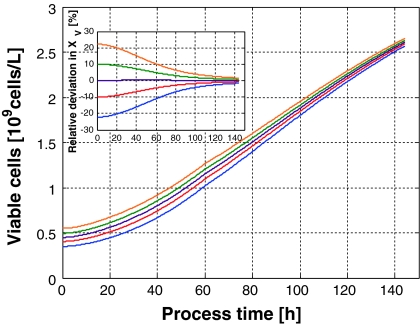
When, at a fixed feeding profile F(t), too many cells are present in the culture they find less substrate than expected for the undisturbed nominal process and hence they reduce their specific growth rate until the desired biomass is obtained. On the other hand, when the inoculum is smaller than the one for which substrate was determined, more substrate for the cells is avaliable as in the undisturbed case and consequently they grow faster until they reach the nominal concentration corresponding to the feed rate F(t). In this case, this open loop controlled culture is a self stabilizing, i.e., a robust system. This can be seen in Fig. 3 when the biomass concentrations belonging to the specific growth rates shown in Fig. 2 are simulated.
Fig. 3.
Biomass concentration X(t)-profiles corresponding to the specific growth rates shown in Fig. 2. Note, there is a strong focusing effect in X(t) which becomes more clear in the plot of the relative deviations from the undisturbed process
From initial deviations of the cell concentration from its nominal value of maximal ±23% only ±5% remain at t = 140 h, i.e., the cell concentration profiles do no longer diverge; contrariwise, there is a strong focusing effect. Similar results were obtained for microbial cultures (Jenzsch et al. 2006).
From the point of view of reproducibility of the biomass concentration profile, a (glutamine) limited fed-batch cultivation is desirable as it stabilizes the process with respect to the biomass growth profiles. In this way a highly robust operational procedure is developed by process design. This is what all manufacturers and authorities claim to aim in. The following sections show how these simulated results can be validated experimentally.
Experimental
Cell line and medium
The cells were sub-clones of the CHO-K1 cell line purchased from Invitrogen (CHO-S, No. 11619-012, Karlsruhe, Germany). This cell line was adapted by Invitrogen to grow as a serum-free suspension culture and is deficient of dehydrofolate reductase (DHFR−). Cells were cultivated in HyClone’s CHOSFM4-Utility Medium (Logan, Utah, USA) enriched with hypoxanthin/thymidin (Gibco 50x, Invitrogen, Karlsruhe) 4 mM NaHCO3, 10 mM HEPES and 1 g/L Pluronic. The initial glucose and glutamine concentration for the batch cultures was 23 and 8 mM, respectively. All fed-batch cultures were started with 16.6 mM glucose and no glutamine within HyClone’s stock medium. The glutamine feed medium contained 20 mM glutamine. It was at the inoculation time. At 75 h the glutamine feed was reconstituted to 200 mL with 20 mM glutamine and additional 50 mL MEM vitamin solution (PAA, Pasching, Austria). The 200 mL glucose feed consisting of 1.5x concentrated CHOSFM4-Utility medium, 83 mM glucose, 50 mL of MEM non-essential and 50 mL MEM essential amino acids (PAA, Pasching, Austria), 3 mL HT-supplement, 250 mg/L myo-inositol and 15 mg/L biotin was started at 75 h.
Bioreactor setup
All experiments were carried out in a 2 L fully equipped Biostat B bioreactor (B. Braun Biotech, Melsungen) standing on a balance (BP34, Sartorius, Göttingen) to online-monitoring the culture weight. The working volume for the batch cultures was 1 L and 0.8–1.2 L for the fed-batch cultures. The ambient conditions were constant at 37 °C, pH 7.15, 20% pO2 and 0.1 L/min air. Until 91 h the culture was aerated via its headspace. Later on, the air was dispersed using a ring sparger. A single Rushton turbine was used and operated at an impeller speed of 60 rpm until the pO2 reached its setpoint. Afterwards, the agitation speed was increased by the pO2 controller to about 300 rpm at 91 h. After the change from head space aeration to air sparging the agitation speed droped down to 80 rpm and again rose to around 200 rpm. The pH was controlled by addition of 1 M NaOH only and the mass of base consumed was measured on-line by a balance (E5500, Sartorius, Göttingen, Germany) and recorded by the computer. Ismatec peristaltic pumps (Wertheim-Mohnfeld, Germany) were used to deliver the feeds to the bioreactor. While glutamine was fed from the beginning, the glucose feed was started at 75 h. Both exponential feed rate profiles were calculated with an initial cell concentration of 0.45 × 10⁹ cells/L and a constant specific growth rate of μset = 0.02 h−1. During entire cultivation the feed stocks were cooled with ice.
Off-line analysis
During the cultivation samples were taken for off-line analysis. The cell concentration and viability was determined with a CASY system (CASY TT, Roche Innovatis AG, Mannheim). Glucose and lactate concentrations were measured using the biochemistry analyzer YSI 2700 SELECT (Yellow Springs Instruments, Yellow Springs, Ohio, USA). Ammonium and glutamine concentrations were determined enzymatically using the ammonium kit (11 112 732 035, R-Biopharm, Darmstadt) and the glutamic acid kit followed by an asparaginase reaction (10 139 092 035, R-Biopharm, Darmstadt).
Results and discussion
Unlimited growth process
Starting point of the investigations reported are the unlimited growth processes usually applied in industrial production plants. Substrate is supplied in excess in order to avoid that the cells “suffer from insufficient food supply”. The situation is thus the same as in batch cultures, the cells grow in a not-substrate-limited way at their maximal specific growth rates. At the accompanying example, the value of the maximal specific growth rate was determined to be 0.038 h−1.
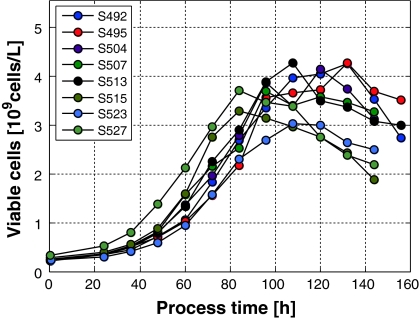
In a series of experiments, the inoculum size is varied within a cell concentration interval of ±20%. The corresponding biomass trajectories will considerably disperse as shown in Fig. 4. Unlimited growth appears in batch processes during most of the cultivation time.
Fig. 4.
Viable CHO-cell concentrations of 8 batch processes plotted as a function of time. The initial theoretical setpoint concentration calculated for inoculation was 0.25 × 10⁹ cells/L. The different batches can be distinguished via their study numbers, e.g., S492, by which are used as identifiers in our data base
At 84 h (=3.5d) cultivation time, the viable cell density deviates up to 20% from its nominal value. This is much too high for a precise production process. As can be seen by comparing all experiments depicted in Fig. 4, the maximal viable cell concentration and the transfer to the stationary growth phase is reached at different cultivation times. If the harvest time tf would be fixed, e.g., at tf = 84 h, high variations in the cell count appear. Hence, alternatives must be chosen that remove this strong influence of the inoculum size on the biomass concentration during most of the cultivation time. Next we discuss operation in the fed-batch mode.
Fed-batch process
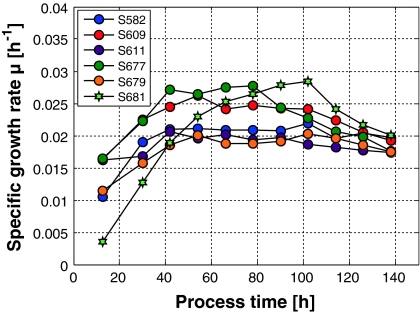
In true fed-batch processes the cells are grown under substrate limited conditions. Here we discuss CHO cell growth in a glutamine limited way. Figure 5 shows a couple of μ-profiles determined in fed-batch cultures that were all operated with the same feed rate profile F(t), μset was taken as 0.02 h−1. The results depicted in Fig. 5 quite nicely resemble the behavior of the simulations shown in Fig. 2.
Fig. 5.
Specific growth rates of 6 cultivations inoculated with ±20% deviation from the theoretical setpoint inoculation concentration of 0.45 × 10⁹ cells/L
One of the cultures (S681) showed a longer lag-phase. This could not be explained so far as the pre-culture conditions and the harvest time of the seeding culture (mid-exponential phase) were seemingly the same as in the other experiments. However, this failed run nevertheless finally approached the desired specific growth rate and the asymptotically approached viable cell density at the same time as the others.
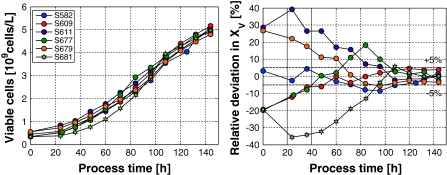
The corresponding viable cell densities are shown on the left hand side of Fig. 6. Here, once again the focusing effect becomes obvious. Although the inocula varied within ±20% around the reference value, the values at the end of the cultivations were all within the ±5% margin. This becomes more pronounced in the right part of the figure where the relative deviations from the desired profile are plotted.
Fig. 6.
Left Viable cell concentrations of 8 fed-batch cultivations as function of time. The nominal initial cell concentration was 0.45 × 10⁹cells/L. Right Relative deviation of the viable cell concentration for the same 8 fed-batch cultivations depicted in the left part
Clearly, in many companies the variations in the inocula are considerably smaller. The large deviations from the set point taken in these experiments were used to show that the method is able to cope even with very large errors.
Adjusting the specific growth rate
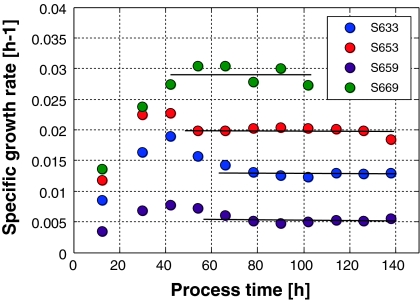
It is not only the fact that the process reproducibility can be enhanced using this type of open loop control. The technique can also be used to precisely adjust the specific growth rates to values smaller than μmax. Typical examples are shown in Fig. 7. Hence, in physiological investigations one can avoid lengthy continuous culture experiments and replace them by robust fed-batch cultivations to investigate the cell behavior at fixed growth states.
Fig. 7.
Series of open-loop-controlled fed-batch cultures where the setpoint of the specific growth rate of the cells was chosen to be 0.005, 0.013, 0.02, and 0.28 h−1
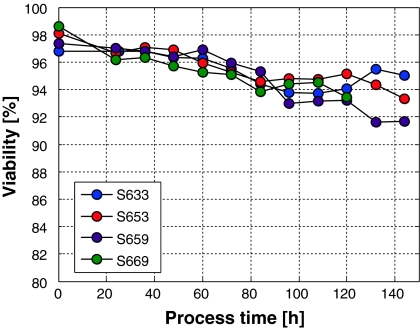
Cultivation S669 was shorter than the others since an accumulation of ammonia with a final concentration of 4.9 mM appeared and the specific growth rate could no longer be hold. In the previous batch experiments it was found that growth inhibition by ammonia became visible at 4.4 mM ammonia (data not shown). One might argue that these controlled experiments have some severe influences on the cells’ viability within the process time. This is not the case. As shown in Fig. 8, the viability can be kept above 93% in most cases.
Fig. 8.
Viability profiles from the experiments shown in Fig. 7. The symbols are the same as in Fig. 7
Only at the very small specific growth rates (S659), the viability drops below 92% at the end of the cultivation as shown in Fig. 8.
Conclusions
Here we discuss a technique by which process robustness and, thus, high process quality is obtained by design of an appropriate operational procedure for mammalian cell culturing processes.
When the biomass growth rate in a fed-batch cultivation of the mammalian cells is chosen smaller than the maximal growth rate, the process becomes robust with respect to deviations from the nominal biomass concentration pattern. Hence, the process becomes highly reproducible as demanded from the product quality point of view. As these processes are deterministic in nature, a high reproducibility in the biomass concentration profiles will lead to a high reproducibility in other state variables, e.g., the product profiles as well, as was already found in microbial systems (Gnoth et al. 2010).
The method is of particular importance where the qP(μ)-relationship directs the process operation towards lower μ values, i.e., when higher specific product formation rates are to be expected at lower specific growth rates. There are some hints in literature that this is often the case (Robinson and Memmert 1991; Miller et al. 1988 etc.). In cases where the qP(μ)-relationship has a monotonously rising positive behavior, one must pay for the high reproducibility with a small productivity loss.
In industrial practice the large deviations from the inoculum size used in the experiments reported do not appear. In the validation experiments presented here, they were chosen so big in order to clearly show the high capture capability of the method with respect of deviations of the inoculum size from the desired value. Correspondingly, the clearance from the maximal specific growth rate of the cells need not be very high.
This method can immediately be transferred to many production processes as these are most often run in an open loop controlled mode. The technique is not only of interest for the manufacturing step in industrial plants but also for the last two or three cultures performed during the cell expansion in the inoculum ‘train’ (Charaniya et al. 2010).
Acknowledgments
The financial support from the “Excellence Initiative” of the German federal state “Sachsen-Anhalt” is gratefully acknowledged.
References
- Ansorge S, Esteban G, Schmid G. On-line monitoring of responses to nutrient feed additions by multi-frequency permittivity measurements in fed-batch cultivations of CHO cells. Cytotechnology. 2010;62:121–132. doi: 10.1007/s10616-010-9267-z. [DOI] [PMC free article] [PubMed] [Google Scholar]
- Butler M. Animal cell cultures: recent achievements and perspectives in the production of biopharmaceuticals. Appl Microbiol Biotechnol. 2005;68(3):283–291. doi: 10.1007/s00253-005-1980-8. [DOI] [PubMed] [Google Scholar]
- Charaniya S, Le H, Rangwala H, Mills K, Johnsonc K, Karypis G, Hu WS. Mining manufacturing data for discovery of high productivity process characteristics. J Biotechnol. 2010;147:186–197. doi: 10.1016/j.jbiotec.2010.04.005. [DOI] [PubMed] [Google Scholar]
- FDA (2004) Guidance for industry: PAT—a framework for innovative pharmaceutical manufacturing and quality assurance. http://www.fda.gov/cvm/guidance/published.html
- Gnoth S, Jenzsch M, Simutis R, Lübbert A. Process analytical technology (PAT): batch-to-batch-reproducibility of fermentation processes by robust process operational design and control. J Biotechnol. 2007;132:180–186. doi: 10.1016/j.jbiotec.2007.03.020. [DOI] [PubMed] [Google Scholar]
- Gnoth S, Simutis R, Lübbert A. Selective expression of the soluble product fraction in Escherichia coli cultures employed in recombinant protein production processes. Appl Microbiol Biotechnol. 2010;87:2047–2058. doi: 10.1007/s00253-010-2608-1. [DOI] [PubMed] [Google Scholar]
- Jang JD, Barford JP. Effect of feed rate on growth rate and antibody production in the fed-batch culture of murine hybridoma cells. Cytotechnology. 2000;32:229–242. doi: 10.1023/A:1008169417980. [DOI] [PMC free article] [PubMed] [Google Scholar]
- Jenzsch M, Gnoth S, Beck M, Kleinschmidt M, Simutis R, Lübbert A. Open loop control of the biomass concentration within the growth phase of recombinant protein production processes. J Biotechnol. 2006;127:84–94. doi: 10.1016/j.jbiotec.2006.06.004. [DOI] [PubMed] [Google Scholar]
- Kuwae S, Ohda T, Tamashima H. Development of a fed-batch culture process for enhanced production of recombinant human antithrombin by Chinese hamster ovary cells. J Biosci Bioeng. 2005;100:502–510. doi: 10.1263/jbb.100.502. [DOI] [PubMed] [Google Scholar]
- Ljunggren J, Häggström L. Glutamine limited fed-batch culture reduces the overflow metabolism of amino acids in myeloma cells. Cytotechnology. 1992;8:45–56. doi: 10.1007/BF02540029. [DOI] [PubMed] [Google Scholar]
- Ljunggren J, Häggström L. Catabolic control of hybridoma cells by glucose and glutamine limited fed batch cultures. Biotechnol Bioeng. 1994;44:808–818. doi: 10.1002/bit.260440706. [DOI] [PubMed] [Google Scholar]
- Miller WM, Blanch HW, Wilke CR. A kinetic analysis of hybridoma growth and metabolism in batch and continuous suspension culture: effect of nutrient concentration, dilution rate, and pH. Biotechnol Bioeng. 1988;32:947–965. doi: 10.1002/bit.260320803. [DOI] [PubMed] [Google Scholar]
- Robinson DK, Memmert KW. Kinetics of recombinant immunoglobulin production by mammalian cells in continuous culture. Biotechnol Bioeng. 1991;38:972–976. doi: 10.1002/bit.260380903. [DOI] [PubMed] [Google Scholar]
- Tremblay Md, Perrier M, Chavarie C, Archambault J. Fed-batch culture of hybridoma cells: comparison of optimal control approach and closed loop strategies. Bioproc Eng. 1993;9:13–21. doi: 10.1007/BF00389535. [DOI] [Google Scholar]
- Wong DCF, Wong KTK, Goh LT, Heng CK, Yap MGS. Impact of dynamic online fed-batch strategies on metabolism, productivity and N-glycosylation quality in CHO cell cultures. Biotechnol Bioeng. 2004;89:164–177. doi: 10.1002/bit.20317. [DOI] [PubMed] [Google Scholar]
- Wurm F. Production of recombinant protein therapeutics in cultivated mammalian cells. Nat Biotechnol. 2004;22(11):1393–1398. doi: 10.1038/nbt1026. [DOI] [PubMed] [Google Scholar]
- Xie L, Wang DIC. Fed-batch cultivation of animal cells using different medium design concepts and feeding strategies. Biotechnol Bioeng. 2006;95:270–284. doi: 10.1002/bit.21160. [DOI] [PubMed] [Google Scholar]


