

Abstract
Bacillus anthracis shares many regulatory loci with the nonpathogenic Bacillus species Bacillus subtilis. One such locus is sinIR, which in B. subtilis controls sporulation, biofilm formation, motility, and competency. As B. anthracis is not known to be motile, to be naturally competent, or to readily form biofilms, we hypothesized that the B. anthracis sinIR regulon is distinct from that of B. subtilis. A genome-wide expression microarray analysis of B. anthracis parental and sinR mutant strains indicated limited convergence of the B. anthracis and B. subtilis SinR regulons. The B. anthracis regulon includes homologues of some B. subtilis SinR-regulated genes, including the signal peptidase gene sipW near the sinIR locus and the sporulation gene spoIIE. The B. anthracis SinR protein also negatively regulates transcription of genes adjacent to the sinIR locus that are unique to the Bacillus cereus group species. These include calY and inhA1, structural genes for the metalloproteases camelysin and immune inhibitor A1 (InhA1), which have been suggested to be associated with virulence in B. cereus and B. anthracis, respectively. Electrophoretic mobility shift assays revealed direct binding of B. anthracis SinR to promoter DNA from strongly regulated genes, such as calY and sipW, but not to the weakly regulated inhA1 gene. Assessment of camelysin and InhA1 levels in culture supernates from sinR-, inhA1-, and calY-null mutants showed that the concentration of InhA1 in the culture supernatant is inversely proportional to the concentration of camelysin. Our data are consistent with a model in which InhA1 protease levels are controlled at the transcriptional level by SinR and at the posttranslational level by camelysin.
Bacillus species are developmental bacteria that cycle between a dormant spore state and a metabolically active vegetative cell state. Vegetative cells can grow as planktonic cells or in multicellular biofilms. Environmental cues affect cellular and community morphologies via complex regulatory systems that are generally conserved throughout the genus. One such system is the pleiotropic SinIR regulatory pair. The sin locus (sporulation inhibitor) was originally described for Bacillus subtilis as a component of the sporulation cascade. Subsequent studies revealed that in addition to negatively regulating several genes involved in sporulation, SinR also regulates motility, competency, proteolysis, and biofilm formation genes in B. subtilis (3, 15, 16, 35, 37, 40, 42, 45, 48, 65). The SinR protein binds a conserved DNA sequence upstream of the translational start site of target genes to either positively or negatively control transcription. SinI, encoded by a gene adjacent to sinR, is a SinR antagonist and binds directly to the SinR protein to inhibit its activity (2). In batch culture, SinR is expressed throughout growth, while SinI expression is limited to stationary phase (29, 57). Thus, SinR-controlled gene expression is relieved when cultures transition from exponential to stationary phase.
While SinIR function and the sin regulon are well established in B. subtilis, there are few reports concerning the SinIR regulatory system in other Bacillus species. Bacillus anthracis, the etiological agent of anthrax, has a sinIR locus but is devoid of multiple characteristics associated with SinIR function in B. subtilis. Unlike B. subtilis, B. anthracis is nonmotile, does not produce naturally competent cells, and does not readily produce biofilms (6, 49, 55). Although known and potential virulence factors of B. anthracis have been shown to be produced in a growth-phase-dependent manner, there are no reports of control of these factors by SinIR during growth in batch culture. One study indicates that in Bacillus thuringiensis, an insect pathogen closely related to B. anthracis (24, 60, 64), the SinIR system controls expression of the immune inhibitor A1 gene inhA1; overexpression of sinR in B. thuringiensis results in decreased expression of inhA1, while overexpression of sinI results in elevated inhA1 transcript levels (32). InhA1 is a secreted metalloprotease that degrades insect antimicrobial peptides and enhances the ability of B. thuringiensis to escape from macrophages (52). B. anthracis also produces an InhA1 protease that has been suggested to be a virulence factor. The B. anthracis protease cleaves von Willebrand factor and prothrombin, proteins associated with the coagulation cascade, as well as extracellular matrix proteins (17-19, 38, 52). SinIR control of B. anthracis inhA1 gene expression has not been reported.
In the work described here, we examined the role of the SinIR system in B. anthracis using genome-wide expression microarray and immunoblot analyses to assess transcriptional and posttranslational regulation of SinRI-regulated genes. We show that in addition to homologues of some B. subtilis SinR-regulated genes, the B. anthracis SinR protein negatively regulates transcription of genes adjacent to the sinIR locus that are unique to the Bacillus cereus group species (B. anthracis, B. cereus, and B. thuringiensis). Our data show that InhA1 protease levels are regulated at the transcriptional level by the SinIR system and at the posttranslational level by a second SinR-regulated protease, camelysin.
MATERIALS AND METHODS
Strains and culture conditions.
B. anthracis strains and plasmids are described in Table 1. The virulent Ames strain (pXO1+ pXO2+) and the Ames mutant UTA21 were used for transcriptional profiling experiments. The attenuated Sterne strain 7702 (pXO1+ pXO2−) and isogenic mutants were employed for all other studies. Unless noted otherwise, B. anthracis strains were cultured at 37°C with shaking (200 rpm) in Luria-Bertani (LB) medium with 0.5% glycerol for RNA and protein isolation or in nutrient broth yeast (NBY) medium for optimal InhA1 protein secretion. Escherichia coli strain TG-1 was used as a host for cloning. E. coli strains were cultured in LB at 37°C with shaking (200 rpm). Antibiotics were added as appropriate: kanamycin (100 μg/ml), spectinomycin (100 μg/ml for B. anthracis and 50 μg/ml for E. coli), erythromycin (5 μg/ml for B. anthracis and 150 μg/ml for E. coli), and carbenicillin (100 μg/ml).
TABLE 1.
Strains and plasmids used in this study
| Strain or plasmid | Characteristica | Source or reference |
|---|---|---|
| Strains | ||
| Ames | Virulent strain; pX01+ pX02+ | 55 |
| UTA21 | sinR-null mutant; derivative of Ames | This study |
| 7702 | Sterne strain; pXO1+ pXO2− | 35 |
| UT315 | sinR-null mutant, derivative of 7702; Spcr | This study |
| UT345 | inhA1-null mutant derivative of 7702 | This study |
| UT356 | calY-null mutant derivative of 7702; Spcr | This study |
| UT365 | sinI-null mutant derivative of 7702 | This study |
| UT371 | sinI sinR-null mutant derivative of 7702 | This study |
| Plasmids | ||
| pUTE973 | Expression vector with IPTG-inducible hyperspank promoter; Kanr Ampr | This study |
| pUTE980 | pUT973 containing inducible calY | This study |
| pET28b | Expression vector with IPTG-inducible T7 promoter; Kanr | Novagen |
| pUTE964 | pET28b containing his-sinR | This study |
| pUTE583 | Vector used for allelic exchange; Ermr | 11 |
| pHY304 | Temperature-sensitive vector used for markerless deletion; Ermr | 8 |
Null mutants were created by allelic exchange (Spcr) or markerless deletion. Spcr, spectinomycin resistant; Kanr, kanamycin resistant; Ermr, erythromycin resistant.
DNA isolation and manipulation.
Cloning experiments employing E. coli were performed using standard protocols (1). Plasmid DNA was extracted from E. coli using a Wizard miniprep kit (Promega, Madison, WI) in accordance with the manufacturer's recommendations. Unmethylated plasmid DNA from E. coli strain GM2163 was used for electroporation of B. anthracis (41). DNA was amplified using PCR and Phusion polymerase (New England Biolabs, Ipswich, MA) unless otherwise noted. Oligonucleotide primers are described in Table S1 in the supplemental material. PCR products were purified using a Qiagen gel purification kit (Qiagen, Valencia, CA). Restriction enzymes were purchased from New England Biolabs. T4 DNA ligase was purchased from Promega. Chromosomal DNA was extracted from B. anthracis using a Mo Bio genomic isolation kit (Mo Bio Laboratories, Solana Beach, CA).
Construction of B. anthracis mutants.
B. anthracis null strains were constructed as allelic exchange mutants or as markerless gene deletion mutants. Allelic exchange mutants, in which specific DNA sequences were replaced with the Ω-spectinomycin resistance cassette, were constructed using pUTE583 as described previously (11).
Markerless deletions were created using pHY304, a temperature-sensitive vector harboring an erythromycin resistance gene (8). DNA fragments corresponding to approximately 1-kb sequences upstream and downstream of the locus to be deleted were cloned in tandem into pHY304. The DNA inserts for the deletion constructs were generated using PCR and EasyA Taq (Stratagene, La Jolla, CA) to amplify upstream and downstream sequences separately or using splicing by overlap extension (SOE) PCR to amplify a single DNA fragment deleted for the gene of interest (36).
To obtain a markerless mutant, the specific pHY304 construct was introduced into B. anthracis using electroporation (41). The electroporation mixture was plated on LB agar containing erythromycin and incubated at 30°C for 2 days to select isolates containing the plasmid. Clones were verified using PCR (Taq polymerase; NEB, Ipswich, MA), restreaked on the same medium, and incubated at 30°C. A single colony was used to inoculate LB broth containing erythromycin, and the culture was incubated at 30°C for 16 h. To obtain an isolate in which the pHY304 derivative had integrated into the chromosome by single crossover recombination, the culture was passaged at a 1:100 dilution into LB containing erythromycin and cultured at 41°C (the nonpermissive temperature for pHY304) for 10 to 14 h. Following a second passage at 1:1,000 under the same conditions, the culture was streaked onto selective LB agar and incubated at 41°C for 10 h. To allow excision of a pHY304 derivative from the B. anthracis chromosome, a single colony of a clone harboring an integrated plasmid was inoculated into LB broth without antibiotic, cultured at 30°C until turbid, and then passaged at a 1:100 dilution multiple times in LB. Starting with passage 3, excision of the pHY304 derivative was assessed by plating serial dilutions of the culture on LB agar and incubating them at 30°C for 16 h. Single colonies were patched to LB agar with and without erythromycin and incubated at 37°C for 16 h. Erythromycin-sensitive isolates were screened for loss of the plasmid and deletion of specific sequences using PCR (Taq polymerase; NEB, Ipswich, MA) and primers corresponding to DNA sequences flanking the locus.
RNA purification.
Approximately 1 × 10⁶ spores were inoculated into 25 ml of LB broth, and cultures were incubated until mid-exponential (optical density at 600 nm [OD600] = 0.5 to 0.6) or early stationary (OD600 = 3.5 to 3.9) growth phase. Six-milliliter samples were taken during exponential phase, and 2-ml samples were collected during the stationary phase of growth. Cells were pelleted at 2,400 × g for 10 min at 4°C. All subsequent centrifugation steps were at 16,000 × g, and samples were kept on ice except where noted. All but 500 μl of culture supernate was decanted. Cells were resuspended and transferred to a 1.5-ml screw-cap tube containing 500 μl of 0.1-mm zirconia/silica beads (BioSpec Products, Bartlesville, OK) and 500 μl of acid phenol warmed to 65°C (Sigma Aldrich, St. Louis, MO). The cell suspension was subjected to bead beating for 1 min using a Mini BeadBeater (BioSpec Products). The tube was placed at 65°C for 5 min, and the bead beating was repeated. Following centrifugation for 3 min at 16,000 × g at 4°C, the aqueous phase was transferred to a new 2-ml tube. Acid phenol (500 μl) was added, and the tube was held at room temperature (RT) for 5 min, followed by vigorous shaking for 15 s. Following centrifugation as before, the aqueous phase was transferred to a new 2-ml tube, 0.3 volumes of chloroform was added, and the contents were shaken vigorously for 15 s. The suspension was incubated for 10 min at room temperature and inverted frequently to avoid separation of phases. Following centrifugation, the aqueous phase was mixed with 250 μl of diethylpyrocarbonate-treated water and 500 μl of isopropanol. After incubation at room temperature for 10 min, RNA was pelleted using centrifugation for 15 min. Pellets were washed in 75% cold ethanol, air dried, and resuspended in 50 μl of diethylpyrocarbonate-treated water. The final concentrations of RNA ranged from 700 to 3,400 ng/μl, as determined using a NanoDrop ND-1000 (NanoDrop Technologies, Wilmington, DE). RNA (20 μg) was DNase treated three times using Turbo DNA-free (Ambion, Austin, TX) according to the specifications of the supplier, and the quality and quantity of RNA were assessed using a Bioanalyzer 2100 system (Agilent Technologies, Santa Clara, CA). RNA was stored at −80°C.
Transcriptional profiling.
A custom Affymetrix (Affymetrix, Inc., Santa Clara, CA) microarray containing 16 antisense oligonucleotide probe pairs for each gene in the Ames ancestor genome was used for microarray experiments. RNA samples were isolated from three independent cultures of each of the strains analyzed (parent and sinR mutant) per time point (exponential and stationary phase), giving 12 samples total. cDNA was created from 5.6 μg of each RNA sample using random primers and Superscript III according to the manufacturer's protocol (Invitrogen, Carlsbad, CA). Following cDNA synthesis, RNA was removed by NaOH hydrolysis and the cDNA purified by phenol-chloroform extraction followed by ethanol precipitation. Each cDNA sample (8 μg) was fragmented using DNase I (Promega), biotin labeled using the Affymetrix GeneChip labeling reagent (Affymetrix, Santa Clara, CA) and terminal deoxytransferase (Promega), and hybridized to the microarray (one array per cDNA sample). After overnight incubation with rotation (40°C at 60 rpm), the 12 microarrays were washed and scanned using standard Affymetrix protocols.
Gene expression estimates were calculated using GCOS software version 1.4 (Affymetrix, Santa Clara, CA), and data were normalized across samples. The data were transferred from GCOS into EXCEL and analyzed using three independent methods. For manual analysis, EXCEL was used to subtract background (signal intensities of <50), the signal for each gene was averaged across the three replicates per strain per time point, and the fold change (parent/sinR mutant) was determined. Two programs, Arraystar (DNAstar, Madison, WI) and dCHIP (Wing Wong and Cheng Li labs, Harvard, Cambridge, MA) were used to confirm differential gene expression. For the Arraystar analysis, raw data were imported from EXCEL, and fold change was determined for each gene, with those greater than 2-fold being reported. Similarly, for dCHIP analysis, raw data were imported from EXCEL, a background signal of 100 was subtracted, fold change was determined, and genes with fold changes of greater than 1.5 were reported.
Changes in gene expression of sipW (GBAA1287), tasA (GBAA1288), calY (GBAA1290), and GBAA_pX02_0023 were confirmed using semiquantitative reverse transcription-PCR (RT-PCR). Reactions used gene-specific primers (see Table S1 in the supplemental material), cDNA made as described above, RNA controls, and DNA controls (25). The 16S gene amplified from cDNA was used as a loading control. Changes in inhA1 (GBAA1295) were confirmed using quantitative RT-PCR, and data were normalized to the levels for the housekeeping gene gyrB (25).
Coomassie and Western blot analysis.
To assess cell-associated and secreted (non-cell-associated) protein, 2-ml culture samples were centrifuged at 6,000 × g at RT for 5 min. Cell pellets were stored at −20°C and thawed on ice prior to resuspension in 75 μl resuspension buffer (50 mM Tris, 3 mM sodium azide, pH 7.6) and 75 μl 2× SDS loading buffer (25% 0.5 M Tris, pH 6.8, 2.5% SDS, 20% glycerol, 0.05% β-mercaptoethanol, 0.02% bromo).
Culture supernates were filtered through a 0.22 μM SFCA filter (Nalgene, Rochester, NY). Supernatant proteins were precipitated using deoxycholate and trichloroacetic acid (12) at 0.01% and 15%, respectively, and incubated on ice for 30 min or stored at −20°C overnight. Frozen supernatant samples were thawed on ice, and precipitated protein was pelleted at 16,000 × g for 20 min at 4°C. Protein pellets were washed with 1 ml of cold acetone at −20°C and incubated on ice for 10 min. Precipitated protein was then pelleted as described above. The acetone was removed, and pellets were air dried for 5 min before being resuspended in 50 μl of resuspension buffer and 50 μl of 2× SDS loading buffer.
InhA1 and camelysin-associated peptides used for antiserum production were predicted as surface-exposed amino acids by Genscript Corporation (Piscataway, NJ). α-InhA1 and α-camelysin antisera against peptides LPDKDIKTIDPAFG and TLADLQKTDPDLLA, respectively, were generated in rabbits by Genscript (Piscataway, NJ). α-InhA1 and α-camelysin antisera were purified using Pierce Nab spin columns for antibody purification per the manufacturer's instructions (Thermo Scientific, Rockford, IL). α-TasA (raised against purified TasA from B. subtilis) was a gift from Adam Driks (Loyola University).
Samples derived from culture supernates and cell pellets were subjected to SDS-PAGE. Gel-imbedded proteins were stained with Coomassie blue (G-250) or transferred to a nitrocellulose membrane using a semidry blotter and Towbin buffer (3.94 g Tris base, 14.4 g glycine, and 10% methanol) for Western blotting. Membranes were blocked in TBS-T (20 mM Tris base, 137 mM NaCl, 0.1% Tween 20 [pH 7.6]) with 3% bovine serum albumin (BSA) for 1 h at room temperature prior to exposure to primary antibody for 1 h. α-InhA1 and α-camelysin antisera were used at a concentration of 1:1,000 in TBS-T, and α-TasA antibody was used at 1:5,000. Membranes were rinsed in TBS-T three times for 5 min each and then exposed to horseradish peroxidase (HRP)-conjugated goat α-rabbit antibody (Bio-Rad, Hercules, CA) at a concentration of 1:100,000 for 1 h at room temperature. Membranes were rinsed as described above and developed using Pierce SuperSignal West Dura extended-duration substrate (Thermo Scientific, Rockford, IL).
Purification of recombinant B. anthracis SinR.
Recombinant SinR (rSinR) protein was purified from E. coli using a protocol modified from the method of Kearns et al. (39). Briefly, DNA containing the sinR coding sequence was amplified using PCR and primers KP168 and KP169 (see Table S1 in the supplemental material). The PCR product was cloned into the NheI and XhoI restriction sites of expression vector pET28b (Novagen, Gibbstown, NJ) to create an inducible gene encoding a thrombin-cleavable amino-terminal His-tagged SinR protein. The plasmid, pUTE964, was transformed into the E. coli Rosetta strain expressing pLysS. The strain was grown in 600 ml of LB broth to an OD600 of approximately 0.8. IPTG (isopropyl β-d-thiogalactoside; 1 mM) was added, and incubation continued for 3 h. Cells were pelleted using centrifugation (10 min at 1,370 × g), resuspended in 10.8 ml of lysis buffer (20 mM Tris, 2 mM EDTA, pH 8.0), and frozen at −80°C. Following three cycles of freeze-thawing, cell debris was pelleted at 16,000 × g at 4°C for 20 min. The supernatant fraction was mixed with 1 ml of nitrilotriacetic acid (NTA)-Ni agarose beads (Qiagen) rotating at 4°C for 1 h, and unbound protein was removed from the beads in five washes (5× bed volume each) with wash buffer (50 mM Tris-HCl, 500 mM NaCl, and 20 mM imidazole, pH 8.5). Beads were pelleted at 1,370 × g for 5 min. The NTA-Ni agarose beads and associated protein were resuspended in 1 ml of elution buffer (10 mM Tris-HCl, 10 mM MgCl2, 1 mM EDTA, 0.3 mM dithiothreitol [DTT], 5% glycerol, 1 mM phenylmethylsulfonyl fluoride [PMSF], pH 8.5), and bound protein was released from the beads using biotinylated thrombin (4.2 μl; Novagen, Gibbstown, NJ) in a 16-h reaction mixture rotating at room temperature. The protein slurry was loaded on a column, and rSinR and thrombin were eluted by gravity flow. Biotinylated thrombin was isolated from the rSinR by use of absorption to streptavidin-agarose beads in a 1-h reaction mixture rotating at RT. Thrombin-bound beads were pelleted at 16,000 × g at 4°C for 20 min, and supernatant containing rSinR was removed. Purified rSinR was dialyzed overnight at 4°C in 10 mM Tris-HCl containing 50 mM NaCl, 1 mM EDTA, 5% glycerol, and 1 mm DTT at pH 8.5. Protein purity was assessed following 12% SDS-PAGE and Coomassie blue staining. Protein concentration was determined using OD280, and protein was stored at −80°C.
EMSAs.
Electrophoretic mobility shift assays (EMSAs) were performed using a Pierce Light Shift EMSA kit (Thermo Fisher Scientific, Rockford, IL). Biotinylated DNA probes corresponded to the promoter regions of three genes implicated as SinR targets in microarray experiments, sipW, calY, and inhA1, and one gene, the Npr599 gene, not implicated as SinR regulated. Probes were generated using PCR and biotinylated primers (see Table S1 in the supplemental material) and purified using a Qiagen gel purification kit. Probe (0.1 nM) and 2 μg of poly(dI-dC) were added to reaction buffer (10 mM Tris, 50 mM KCl, 1 mM DTT, 0.1% NP-40, and 20 mM MgCl2, pH 7.5). Five reactions were set up for each probe tested, with one reaction mixture receiving no rSinR protein and the remaining four reaction mixtures containing increasing concentrations of rSinR protein (0.4, 2.0, 10, and 50 nM). Samples were incubated at 37°C for 35 min and then electrophoresed in a TBE gel containing 5% bis-acrylamide at room temperature for 1 h at 100 V. DNA was transferred from the gels to nitrile membranes using a semidry apparatus (280 mA for 13 min). Following cross-linking using a using a UV cross-linker (UVC500; GE Healthcare, Piscataway, NJ), membranes were blocked, washed, and developed according to the Pierce Light Shift EMSA kit protocol.
IPTG-inducible expression of camelysin in B. anthracis.
Plasmid pdr111Hyperspank (5), containing the IPTG-inducible promoter Phyperspank, was modified as follows for use in B. anthracis. The ori1030 gene from pHT304 (21) was cloned in the BamHI restriction site. The spectinomycin resistance gene was replaced with an Omega cassette carrying a kanamycin resistance gene by digesting the vector with EcoRI and SacII and inserting ΩKan, creating pUTE973 (Table 1). The calY gene, carrying its native ribosomal binding site, was amplified from B. anthracis genomic DNA with primers KP183 and KP184 (see Table S1 in the supplemental material) and cloned into the SalI and SphI restriction sites of pUTE973 such that transcription of the calY gene was driven by the IPTG-inducible promoter. The calY expression vector was named pUTE980 (Table 1). Camelysin and InhA1 levels produced by each strain were assessed by Western blot analysis. Where indicated, densitometry was utilized to quantify the signal intensity of protein bands.
Microarray data accession number.
The raw data were deposited at the MIAME compliant Gene Expression Omnibus (GEO) database at the National Center for Biotechnology Information (http://www.ncbi.nlm.nih.gov/geo/) and are accessible through accession number GSE22559.
RESULTS
Comparison of sin loci.
In B. subtilis, the sinI and sinR genes are adjacent to each other on the chromosome and are cotranscribed (57). The sinIR genes of B. anthracis are aligned similarly. The amino acid sequences of the SinR proteins are 67% identical between B. subtilis and B. anthracis, with conserved residues spanning the length of the proteins. Eighteen of 20 conserved residues in the B. subtilis SinR helix-turn-helix motif are identical to those of the B. anthracis SinR protein, and the two nonconserved residues represent conservative substitutions. In addition, the region of SinR that is predicted to interact with SinI (43) is moderately conserved; 21 of 29 residues are identical in the SinR proteins of the two species. The B. subtilis and B. anthracis SinI proteins are conserved to a lesser degree, exhibiting 42% identity and 76% similarity throughout. Eleven of the 26 SinI amino acid residues predicted to interact with SinR are identical in the SinI proteins of the two species, and there is less similarity in the remainder of the SinI amino acid sequences (43).
There are notable differences between B. subtilis and B. anthracis with regard to sequences adjacent to sinIR (Fig. 1). One target of the B. subtilis SinIR regulatory system, the tricistronic operon composed of yqxM, sipW, and tasA, is located immediately downstream of the B. subtilis sin operon in the opposite orientation. The yqxM-sipW-tasA operon is associated with biofilm formation by B. subtilis (15). The yqxM gene encodes a lipoprotein, while sipW encodes a signal peptidase, and tasA encodes a cell-associated filamentous antimicrobial protein. B. anthracis lacks the yqxM gene, and although the tandem sipW (GBAA1287) and tasA (GBAA1288) genes are present, they are separated from sinIR by two open reading frames (ORFs), GBAA1289 and GBAA1290, that are absent in B. subtilis. GBAA1289 is annotated as encoding a hypothetical protein containing a nonsense mutation and is likely a pseudogene. ORF1290 is designated calY because the ORF is predicted to encode a protein with an amino acid sequence that is more than 90% identical to the calY-encoded protein, camelysin, of B. cereus (reference 33 and NCBI BLAST). B. cereus camelysin is a cell-surface-associated protease. Sequences upstream of sinIR also differ between B. subtilis and B. anthracis. In B. anthracis, inhA1, encoding the InhA1 protease associated with culture supernates, is located upstream of sinI and in the opposite orientation. In B. subtilis, yqhG lies 977 bp upstream of sinI and in the same orientation; the inhA1 gene is not present. An orthologue of yqhG, which encodes a conserved hypothetical protein, is present on the chromosome of B. anthracis at a distant locus, GBAA4451. Analysis of the available genome sequences of species closely related to B. anthracis, B. cereus and B. thuringiensis, indicates that the extended sin loci in these species match that of B. anthracis.
FIG. 1.

Schematic representation of the sin loci of B. subtilis and B. anthracis. Open reading frames are represented by block arrows.
Assessment of the sinR regulon in B. anthracis.
Differences in sinIR-associated phenotypes of B. subtilis and B. anthracis and structural dissimilarities in the regions adjacent to the sin locus suggest disparities in the sinR regulons of the two species. To determine the sinR regulon of B. anthracis, we conducted genome-wide transcriptional profiling experiments comparing the fully virulent Ames strain to an isogenic sinR-null mutant. We compared transcript levels at the exponential and stationary phases of growth (see Fig. S1 in the supplemental material). Figure 2 A shows data obtained by manual analysis. Genes exhibiting a 2-fold or greater difference in regulation between the parent and sinR strains when data were assessed using three independent analysis programs were designated sinR regulated (Table S2). Most of the 40 sinR-regulated genes were affected during stationary phase and unaffected during exponential phase. Fewer genes were controlled during exponential phase. Notably, sipW, tasA, and calY were negatively regulated by sinR in both growth phases, while inhA1 was negatively controlled only in exponential phase (Fig. 2A and Table S2).
FIG. 2.

sinR-controlled transcriptome of B. anthracis. (A) Scatter plot of ORFs differentially regulated in the sinR mutant (UTA21) relative to the parent strain (Ames). Data from microarray experiments were analyzed using EXCEL to subtract background and to determine the averages of results from three replicates per strain per time point (see Materials and Methods). Data are presented as log2 fold changes. (B and C) Genes exhibiting 2-fold or greater differences in regulation between the parent and sinR strains when microarray data were assessed using three independent analysis programs were designated sinR regulated. (B) sinR-regulated genes during exponential growth phase grouped by annotated function. (C) sinR-regulated genes during stationary growth phase grouped by annotated function.
The most highly regulated genes are located near the sin locus. The calY, sipW, and tasA gene transcript levels were elevated up to 143-, 50-, and 59-fold, respectively, in the sinR mutant strain during exponential phase, indicating negative regulation by SinR (Fig. 2A; see also Table S2 in the supplemental material). Microarray data for these genes and pXO2_0023 were verified using semiquantitative RT-PCR (Fig. S2). Note that probes representing GBAA1289, the presumed pseudogene near sinIR, were not represented in the array. In contrast to that of the genes downstream of sinIR, microarray data indicated that the expression of the upstream gene inhA1 was elevated only 2.0- to 2.9-fold in the sinR mutant. The relatively small effect of sinR on inhA1 during exponential phase was in agreement with quantitative RT-PCR data for inhA1 which showed a 3.8-fold elevation of inhA1 expression in the absence of sinR (data not shown). Moreover, elevated inhA1 expression was observed only with the use of RNA from exponential-phase cultures, unlike the differences in calY, sipW, and tasA expression, which were apparent at the exponential and stationary phases (Table S2). The three most highly sinR-regulated genes distant from the sin locus, GBAA1075 (exonuclease/exonuclease phosphatase), GBAA3645 (oligopeptide-binding protein [oppA]), and GBAA5262 (hypothetical exported repetitive protein), were negatively regulated up to 8.0-, 6.0-, and 9.7-fold, respectively (Table S2).
The majority of sinR-regulated genes were located on the chromosome; however, a number of genes within a putative operon, GBAA_pXO2_0028-GBAA_pXO2_53, on the pX02 virulence plasmid were positively regulated (2.2- to 4.6-fold) during stationary phase of growth. We note that not all of the genes of the putative 26-gene operon were found to be regulated in our analysis. While the genes in the operon are largely annotated as conserved hypotheticals, GBAA_pXO2_0023 is annotated as encoding a type IV secretion system protein (34, 53). B. subtilis does not carry homologues of these sinR-regulated pXO2 genes.
The sinR-regulated genes of B. anthracis are grouped according to annotated function in Fig. 2B and C. Only seven genes were identified as sinR regulated during the exponential phase of growth, with the largest class of genes annotated as encoding proteins with degradative properties, including the secreted protease genes inhA1 and calY, sipW, and the nuclease-encoding gene GBAA1075. Additional genes regulated by sinR during exponential growth phase include a regulatory gene (GBAA3305) and two genes that did not fall into any distinct category (tasA and oppA [GBAA3645]) (see Table S2 in the supplemental material). In contrast, 38 genes were determined to be sinR regulated during the stationary growth phase, with the largest class of genes annotated as encoding conserved hypothetical proteins. Additional classes of sinR-regulated genes during stationary phase of growth were six genes that did not fall into any distinct category, five genes involved in sporulation, including spoIIE and spoIIGA, and genes associated with metabolism (five), regulation (two), and degradation (three) (Table S2). Considering that some of the sinR-controlled genes are annotated as factors affecting transcription, it is likely that some members of the regulon are indirectly controlled by SinR.
Comparison of the sinR regulons of B. anthracis and B. subtilis.
In B. subtilis, the sinR regulon is composed of at least 35 genes (3, 15, 16, 35, 37, 40, 42, 45, 47, 48, 65). Eighteen of these genes were revealed in a transcriptional profiling experiment comparing sinR- to sinI-null mutants during the exponential phase of growth (15). Our transcriptional profiling data indicate only limited convergence of sinR-regulated genes from B. anthracis and B. subtilis (Fig. 3). Interestingly, approximately half of the genes controlled by sinR in each species do not have homologues in the other species (e.g., 21 genes that are sinR regulated in B. anthracis have no homologue in B. subtilis). Of the 35 genes regulated by sinR in B. subtilis and the 40 genes regulated by sinR in B. anthracis, only four genes were common to both regulons (tasA, sipW, spoIIE, and spoIIG). Surprisingly, 16 sinR-regulated genes of B. subtilis have homologues in B. anthracis that did not exhibit SinR-regulated expression in our transcriptional profiling experiment. Likewise, 15 sinR-regulated genes of B. anthracis have homologues in B. subtilis that have not been reported as sinR controlled in that species.
FIG. 3.

Comparison of the sinR regulons of B. anthracis and B. subtilis. sinR-regulated genes are indicated (exponential and stationary growth phases) from B. anthracis transcriptional profiling experiments (this study) and from B. subtilis literature (3, 15, 16, 35, 37, 40, 42, 45, 47, 48, 65).
Specific binding of rSinR to promoter DNA.
Direct binding of B. subtilis SinR to specific DNA sequences has been biochemically verified for three B. subtilis promoters containing a total of eight binding sites. The consensus sequence GTTCTYT, in which Y is C or T, was derived from these sites plus similar sequences found in the promoters of other sinR-regulated genes of B. subtilis (15). We examined the promoter regions of sinR-regulated B. anthracis genes for sequence similarity to the B. subtilis consensus sequence. Sequences upstream of the B. anthracis sinR-regulated genes bearing some similarity to the B. subtilis consensus sequence are shown in Table S2 in the supplemental material. In some cases, multiple potential SinR binding sites are apparent upstream of a single gene, as has been reported for sinR-regulated genes in B. subtilis (15). Many B. anthracis sinR-regulated genes, including highly regulated genes such as calY and sipW and genes exhibiting relatively low levels of regulation by sinR, such as inhA1, contain upstream sequences similar to the B. subtilis SinR consensus sequence. These data and the significant amino acid sequence similarity of the B. anthracis and B. subtilis SinR proteins suggest that the limited convergence of the B. subtilis and B. anthracis regulons is due to a difference in SinR function in the two species.
To determine if B. anthracis SinR binds specifically to promoter regions of target genes, we performed electrophoretic mobility shift assays (EMSAs) using rSinR purified from E. coli and DNA probes corresponding to sequences upstream of the sinR-regulated genes calY, sipW, and inhA1 and a gene unaffected by sinR, the Npr599 gene (see Table S2 in the supplemental material). When a 10 nM or higher concentration of rSinR was present in the binding reaction mixture, the gel mobility of the calY and sipW promoter probes was retarded compared to that of the free probe (Fig. 4). Probes representing the non-sinR-regulated Npr599 gene promoter and the weakly (2.0- to 3.8-fold) regulated inhA1 promoter did not exhibit a shift, even when the rSinR concentration was increased to 4.2 μM (data not shown). The results show that B. anthracis SinR is a DNA-binding protein that binds specifically to the promoter regions of highly regulated target genes. The lack of SinR binding to the inhA1 promoter, despite the presence of an apparent consensus sequence for SinR binding, suggests that either the relatively small change in inhA1 expression in a sinR-null mutant is indirectly related to SinR or the affinity of SinR for the inhA1 promoter is greatly diminished compared to the SinR affinity for the highly regulated sipW and calY promoters.
FIG. 4.
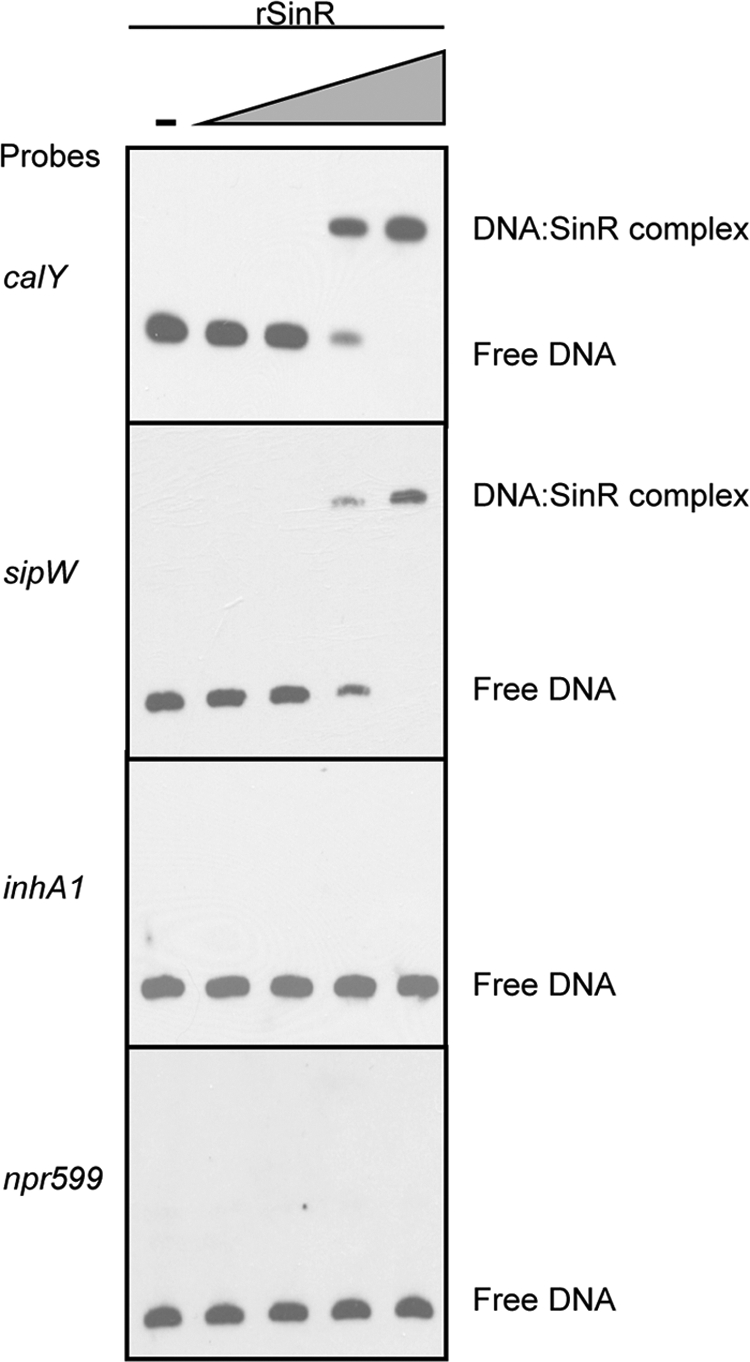
Specific binding of recombinant B. anthracis SinR to the promoters of sinR-regulated genes calY and sipW. EMSAs were performed using 0.1 nM probe DNA and increasing concentrations of purified rSinR, 0 nM, 0.4 nM, 2 nM, 10 nM, and 50 nM. The Npr599 gene promoter probe was used as a negative control.
sin control of secreted proteases.
Regulation of genes encoding the proteases camelysin and InhA1 by sinR is intriguing given that InhA1 has been implicated in anthrax pathogenesis and that homologues of camelysin produced by B. cereus and B. thuringiensis are active against host substrates (13, 14, 17-19, 33, 38, 51). Negative regulation of inhA1 by sinR is relatively weak, and InhA1 has been reported to be an abundant protein in the B. anthracis secretome, whereas calY is repressed 140-fold by sinR and does not appear to be a major component of the B. anthracis secretome (13).
We asked if InhA1 and camelysin protein levels reflect the effects of sinR on inhA1 and calY transcription. Parent and sinR-, sinI-, and sinIR-null mutant strains were cultured, and cell pellets and supernates were collected at the exponential (OD600, ≈1.6; 4 h), transition (OD600, ≈3.1; 6 h), and stationary (OD600, ≈3.1; 8 h) phases of growth. Protein samples were assessed for camelysin, InhA1, and TasA (the product of a sinR-controlled gene that is common to B. subtilis and B. anthracis) using Western blotting (Fig. 5). The mobilities of cross-reactive proteins relative to size markers (not shown) were as expected for all three proteins (camelysin, 27 kDa; InhA1, 82 kDa; and TasA, 31 kDa) (13, 62). Consistent with the transcriptional profiling data, the sinR mutant produced substantially higher levels of camelysin and TasA than the parent strain. Moreover, camelysin and TasA levels were less abundant in the sinI mutant during the transition and stationary phases than in the parent strain, while the protein levels associated with the sinIR double mutant matched those of the sinR-null mutant. These results are consistent with the B. subtilis model in which SinR regulates target gene expression and SinI inhibits SinR activity. Unlike the results obtained for camelysin and TasA, InhA1 levels did not reflect the transcriptional profiling data. Steady-state levels of InhA1 were detected in the supernate of the parent strain during the stationary phase of growth, but surprisingly, InhA1 protein levels were decreased in the sinR mutant and elevated in the sinI-null mutant. These experiments were also performed using a different strain background (Ames cured of pXO1 and pXO2), and identical results were obtained (data not shown). The InhA1 results are indicative of a gene product under posttranscriptional regulation.
FIG. 5.

Effects of B. anthracis sinR and sinI on Camelysin, TasA, and InhA1 levels. The parent strain 7702 and sinR, sinI, and sinIR mutants (UT315, UT365, and UT371, respectively) were cultured in NBY, and samples were taken during the exponential phase (OD600, ≈1.6; 4 h), transition phase (OD600, ≈3.1; 6 h), and stationary phase (OD600, ≈3.1; 8 h) of growth. Cell pellets were used to assess camelysin and TasA, and culture supernatant was used to assess InhA1. Western blot analyses were performed with camelysin-, TasA-, and InhA1-specific antibodies.
Further examination of InhA1 and camelysin levels during culture of the parent strain revealed that InhA1 and camelysin levels are inversely correlated during stationary phase. As camelysin levels decreased, InhA1 levels increased (Fig. 6 A). To obtain a better understanding of the relationship between camelysin and InhA1, individual isogenic protease mutant strains were created and InhA1 levels in the culture supernatant were assessed using Western blot analysis. As shown in Fig. 6B, in early-stationary-phase growth, InhA1 levels were significantly higher in the calY mutant strain than in the parent strain, while camelysin levels were unchanged in the absence of inhA1. To negate the effects of sinIR-mediated control of calY on InhA1 levels, we expressed the calY gene from an IPTG-inducible promoter in a calY-null mutant background. Levels of InhA1 and camelysin were assessed with increasing concentrations of IPTG (Fig. 6C). Again, camelysin and InhA1 protein levels were inversely related; as camelysin levels increased, InhA1 levels decreased. Taken together, these results suggest that InhA1 is degraded in supernates of cells in which camelysin synthesis is derepressed.
FIG. 6.

Relationship between camelysin and InhA1 levels. Western blot experiments employed cell-associated protein (for camelysin) and cell supernatant protein (for InhA1). (A) Endogenous camelysin and InhA1 levels in the parent strain. Strain 7702 was cultured in NBY, and samples were taken every 2 h, beginning at the transition phase of growth. A corresponding growth curve for 7702 is shown. (B) Camelysin and InhA1 levels in early-stationary-phase samples from the parent strain and the inhA1 and calY mutants (UT345 and UT356, respectively). (C) Camelysin and InhA1 levels produced by 7702 and a B. anthracis calY mutant carrying an IPTG-inducible calY gene (pUTE980). The abundances of calY and inhA1 relative to that of the parent strain 7702 containing the empty vector (EV) were determined using densitometry. Data are presented as fold changes.
DISCUSSION
The common physiology of Bacillus species reflects their genomic synteny and gene sequence similarity (53, 61). Multiple metabolic and regulatory loci, studied primarily for the archetype species B. subtilis, have functional homologues in other Bacillus species. For these spore-forming bacteria, shared systems controlling cell development are particularly notable (4, 7, 22, 23, 27, 44, 46, 50, 56, 67). Here, we examined function of the sinIR locus in B. anthracis. The comparable locus in B. subtilis was first characterized as part of the extensive sporulation network (30, 59). Subsequent studies revealed that B. subtilis sinIR plays a regulatory role in multiple-growth-phase-associated phenotypes (15, 31, 35, 45, 47). The results reported here reveal that the B. anthracis sinIR locus and the associated regulon exhibit some similarity to those of B. subtilis, but also significant differences.
The SinIR regulatory system is composed of the DNA-binding protein SinR, which controls transcription of target promoters, and the SinR antagonist SinI, which when bound to SinR prevents its association with DNA (2). Given the similarity of the SinR and SinI amino acid sequences and data generated in our study, it is likely that the molecular mechanisms for function of the B. anthracis and B. subtilis proteins are equivalent. We have shown that B. anthracis SinR has specific DNA-binding activity for highly sinIR-regulated promoters. We determined that many sinIR-regulated genes of B. anthracis possess promoter DNA sequences with similarity to the SinR recognition sequence established in B. subtilis. Finally, a B. anthracis sinI-null mutant displays the expected phenotypes for SinR-controlled genes.
Differences in the sinR regulons of B. anthracis and B. subtilis appear to be primarily due to disparities in target gene content. Approximately half of the genes reported to be sinR regulated in either B. anthracis or B. subtilis do not have homologues in the other species. Several sinIR-regulated genes of B. subtilis are associated with species-specific phenotypes, including those involving biofilm formation, motility, and competency (3, 35, 42, 45). In B. subtilis, sinIR negatively controls the biofilm-associated extrapolysaccharide genes (eps) and the biofilm structural protein gene yqxM (15). B. anthracis, which does not readily form biofilms, is missing these sinIR-regulated genes. Likewise, B. anthracis is nonmotile and does not carry a homologue of the B. subtilis sinIR-regulated sigD gene (42), which encodes a transcriptional regulator of B. subtilis motility genes. Finally, two key competency genes, comS and srf, are sinIR-regulated in B. subtilis (45) but absent in B. anthracis.
In B. subtilis and B. anthracis, several genes of the sinR regulon encode degradative enzymes, some of which are present in one species but not the other. Among these are the B. subtilis gene aprX, encoding a serine protease (65), and the B. anthracis genes inhA1 and calY, encoding the InhA1 and camelysin secreted metalloproteases, respectively. The inhA1 and calY genes are present in all primary species of the B. cereus group (B. anthracis, B. thuringiensis, and B. cereus). InhA1 was first identified as a B. thuringiensis protease that promotes survival of the bacterium in the hemolymph of infected insects (26, 58). Subsequently, it was shown that InhA1 degrades the cecropin and attacin insect antimicrobial peptides (20). Ramarao and Lereclus (52) further demonstrated a link between InhA1 and the immune response by showing that InhA1 enhances escape of B. thuringiensis from macrophages. It is notable that in B. thuringiensis, overexpression of sinR results in repression of inhA1 expression (32), in agreement with our B. anthracis data revealing increased inhA1 expression in a sinR-null mutant. Similar to its orthologue in B. thuringiensis, InhA1 from B. anthracis cleaves a number of host proteins, including proteins involved in the coagulation cascade (including von Willebrand factor and prothrombin) as well as extracellular matrix proteins (17-19, 38).
Camelysin, the other sinR-regulated secreted protease of B. anthracis, was first described as a casein-lytic protein of B. cereus (33). Substrates of B. cereus camelysin include host cell matrix proteins such as collagen and actin as well as proteins of the coagulation cascade (28). A camelysin homologue in B. thuringiensis has been reported to activate Cyt2Ba, a protein toxin that exhibits activity against the Dipteran order of insects (51). The function of the B. anthracis camelysin has not been described previously.
The degrees of sinR-mediated transcriptional control of the B. anthracis inhA1 and calY genes differ considerably. The calY gene is the most highly sinR-regulated gene identified in our study, and SinR directly binds the promoter region of the gene, while inhA1 is only weakly regulated by sinR and we were unable to demonstrate binding of SinR to the inhA1 promoter region. The weak regulation of inhA1 by sinR is puzzling considering that the inhA1 promoter region harbors two putative SinR-binding sites with the sequence GTTATAA, similar to the SinR recognition sequence established for B. subtilis (GTTCTYT) (15) and to sequences in the promoter regions of the highly regulated B. anthracis genes. In B. subtilis and B. anthracis, the number of putative SinR-binding sites upstream of individual sinR-regulated genes ranges from one to four, but a relationship between the number or position of sites and the degree of SinR control has not been established. It is possible that single-nucleotide differences in binding sites affect the affinity of SinR for the DNA. Finally, it is notable that a sinR paralogue in B. subtilis, SlrR, has been demonstrated to work in tandem with SinR to regulate select targets (9, 10), but a slrR homologue is not apparent in B. anthracis.
Although sinR has a relatively small effect on inhA1 transcription, the regulatory gene has a large effect on InhA1 levels in culture supernates. Our data suggest that increased InhA1 in cultures of a sinI-null mutant is associated with sinR-mediated control of calY. When B. anthracis is cultured in rich complex media, InhA1 is one of the most abundant proteins in stationary-phase culture supernates, while camelysin levels are relatively low (13). In a sinR-null mutant, InhA1 levels are reduced dramatically and camelysin levels are increased. Comparison of InhA1 and camelysin levels revealed an inverse relationship between InhA1 and camelysin, with InhA1 levels increasing as camelysin levels decrease. Moreover, when we artificially induced calY expression, we observed a coincident decrease in InhA1. Taken together, our data support a model in which InhA1 is degraded by camelysin or a protease under its control when calY gene expression is derepressed.
InhA1 is a major component of the B. anthracis secretome that appears to degrade host substrates with relatively little specificity (13, 17-19, 38). A system in which InhA1 levels are controlled transcriptionally and posttranslationally in response to the growth phase-associated activity of SinR suggests that limitation of InhA1 is beneficial in certain environments. Interestingly, in B. thuringiensis inhA1 transcription is controlled by another growth phase-associated regulator, AbrB (32). The weak nucleotide sequence conservation of the reported AbrB recognition site (63, 66) makes it difficult to predict whether the B. anthracis inhA1 gene is controlled similarly. Nevertheless, involvement of AbrB in addition to SinR in InhA1 expression would provide an interesting link between the protease and the well-established virulence factors of the bacterium. In B. anthracis, AbrB controls transcription of the pleotropic virulence gene regulator atxA (54, 63). Future studies addressing the effects of transition state regulators such as SinIR on temporal expression of virulence genes in the context of infection and on gene expression during B. anthracis growth in other environments will further our understanding of target gene function.
Supplementary Material
Acknowledgments
We thank Alan D. Grossman for plasmid pdr111Hyperspank, Maria Hadjifrangiskou for adapting plasmid pdr111Hyperspank for use in B. anthracis, Craig E. Rubins for pHY304, and Adam Driks for supplying the TasA antisera. Real-time quantitative PCR (qPCR) assays were performed in the Quantitative Genomics Core Laboratory at The University of Texas Health Sciences Center in Houston, TX.
This work was supported by National Institutes of Health grants R01 AI33537 and U54 AI057156 to T.M.K. K.J.P. was supported by the Ruth L. Kirschstein National Research Service Award T32 AI55449.
The contents are solely the responsibility of the authors and do not necessarily represent the official views of the NIH.
Footnotes
Published ahead of print on 3 December 2010.
Supplemental material for this article may be found at http://jb.asm.org/.
REFERENCES
- 1.Ausubel, F. M. (ed.). 1993. Current protocols in molecular biology. Greene Publishing Associates and Wiley-Interscience, New York, NY.
- 2.Bai, U., I. Mandic-Mulec, and I. Smith. 1993. SinI modulates the activity of SinR, a developmental switch protein of Bacillus subtilis, by protein-protein interaction. Genes Dev. 7:139-148. [DOI] [PubMed] [Google Scholar]
- 3.Barilla, D., T. Caramori, and A. Galizzi. 1994. Coupling of flagellin gene transcription to flagellar assembly in Bacillus subtilis. J. Bacteriol. 176:4558-4564. [DOI] [PMC free article] [PubMed] [Google Scholar]
- 4.Bergman, N. H., et al. 2006. Transcriptional profiling of the Bacillus anthracis life cycle in vitro and an implied model for regulation of spore formation. J. Bacteriol. 188:6092-6100. [DOI] [PMC free article] [PubMed] [Google Scholar]
- 5.Britton, R. A., et al. 2002. Genome-wide analysis of the stationary-phase sigma factor (sigma-H) regulon of Bacillus subtilis. J. Bacteriol. 184:4881-4890. [DOI] [PMC free article] [PubMed] [Google Scholar]
- 6.Brown, E. R., W. B. Cherry, M. D. Moody, and M. A. Gordon. 1955. The induction of motility in Bacillus anthracis by means of bacteriophage lysates: significance for the relationship of Bacillus anthracis to Bacillus cereus. J. Bacteriol. 69:590-602. [DOI] [PMC free article] [PubMed] [Google Scholar]
- 7.Brunsing, R. L., et al. 2005. Characterization of sporulation histidine kinases of Bacillus anthracis. J. Bacteriol. 187:6972-6981. [DOI] [PMC free article] [PubMed] [Google Scholar]
- 8.Chaffin, D. O., L. M. Mentele, and C. E. Rubens. 2005. Sialylation of group B streptococcal capsular polysaccharide is mediated by cpsK and is required for optimal capsule polymerization and expression. J. Bacteriol. 187:4615-4626. [DOI] [PMC free article] [PubMed] [Google Scholar]
- 9.Chai, Y., R. Kolter, and R. Losick. 2009. Paralogous antirepressors acting on the master regulator for biofilm formation in Bacillus subtilis. Mol. Microbiol. 74:876-887. [DOI] [PMC free article] [PubMed] [Google Scholar]
- 10.Chai, Y., T. Norman, R. Kolter, and R. Losick. 2010. An epigenetic switch governing daughter cell separation in Bacillus subtilis. Genes Dev. 24:754-765. [DOI] [PMC free article] [PubMed] [Google Scholar]
- 11.Chen, Y., F. C. Tenover, and T. M. Koehler. 2004. Beta-lactamase gene expression in a penicillin-resistant Bacillus anthracis strain. Antimicrob. Agents Chemother. 48:4873-4877. [DOI] [PMC free article] [PubMed] [Google Scholar]
- 12.Chevallet, M., H. Diemer, A. Van Dorssealer, C. Villiers, and T. Rabilloud. 2007. Toward a better analysis of secreted proteins: the example of the myeloid cells secretome. Proteomics 7:1757-1770. [DOI] [PMC free article] [PubMed] [Google Scholar]
- 13.Chitlaru, T., O. Gat, Y. Gozlan, N. Ariel, and A. Shafferman. 2006. Differential proteomic analysis of the Bacillus anthracis secretome: distinct plasmid and chromosome CO2-dependent cross talk mechanisms modulate extracellular proteolytic activities. J. Bacteriol. 188:3551-3571. [DOI] [PMC free article] [PubMed] [Google Scholar]
- 14.Chitlaru, T., et al. 2007. Identification of in vivo-expressed immunogenic proteins by serological proteome analysis of the Bacillus anthracis secretome. Infect. Immun. 75:2841-2852. [DOI] [PMC free article] [PubMed] [Google Scholar]
- 15.Chu, F., D. B. Kearns, S. S. Branda, R. Kolter, and R. Losick. 2006. Targets of the master regulator of biofilm formation in Bacillus subtilis. Mol. Microbiol. 59:1216-1228. [DOI] [PubMed] [Google Scholar]
- 16.Chu, F., et al. 2008. A novel regulatory protein governing biofilm formation in Bacillus subtilis. Mol. Microbiol. 68:1117-1127. [DOI] [PMC free article] [PubMed] [Google Scholar]
- 17.Chung, M. C., et al. 2009. Activation of plasminogen activator inhibitor implicates protease InhA in the acute-phase response to Bacillus anthracis infection. J. Med. Microbiol. 58:737-744. [DOI] [PubMed] [Google Scholar]
- 18.Chung, M. C., et al. 2008. Degradation of circulating von Willebrand factor and its regulator ADAMTS13 implicates secreted Bacillus anthracis metalloproteases in anthrax consumptive coagulopathy. J. Biol. Chem. 283:9531-9542. [DOI] [PubMed] [Google Scholar]
- 19.Chung, M. C., et al. 2006. Secreted neutral metalloproteases of Bacillus anthracis as candidate pathogenic factors. J. Biol. Chem. 281:31408-31418. [DOI] [PubMed] [Google Scholar]
- 20.Dalhammar, G., and H. Steiner. 1984. Characterization of inhibitor A, a protease from Bacillus thuringiensis which degrades attacins and cecropins, two classes of antibacterial proteins in insects. Eur. J. Biochem. 139:247-252. [DOI] [PubMed] [Google Scholar]
- 21.de Souza, M. T., M. M. Lecadet, and D. Lereclus. 1993. Full expression of the cryIIIA toxin gene of Bacillus thuringiensis requires a distant upstream DNA sequence affecting transcription. J. Bacteriol. 175:2952-2960. [DOI] [PMC free article] [PubMed] [Google Scholar]
- 22.Driks, A. 2002. Maximum shields: the assembly and function of the bacterial spore coat. Trends Microbiol. 10:251-254. [DOI] [PubMed] [Google Scholar]
- 23.Driks, A. 2002. Overview: development in bacteria: spore formation in Bacillus subtilis. Cell. Mol. Life Sci. 59:389-391. [DOI] [PMC free article] [PubMed] [Google Scholar]
- 24.Drobniewski, F. A. 1993. Bacillus cereus and related species. Clin. Microbiol. Rev. 6:324-338. [DOI] [PMC free article] [PubMed] [Google Scholar]
- 25.Drysdale, M., A. Bourgogne, S. G. Hilsenbeck, and T. M. Koehler. 2004. atxA controls Bacillus anthracis capsule synthesis via acpA and a newly discovered regulator, acpB. J. Bacteriol. 186:307-315. [DOI] [PMC free article] [PubMed] [Google Scholar]
- 26.Edlund, T., I. Siden, and H. G. Boman. 1976. Evidence for two immune inhibitors from Bacillus thuringiensis interfering with the humoral defense system of saturniid pupae. Infect. Immun. 14:934-941. [DOI] [PMC free article] [PubMed] [Google Scholar]
- 27.Fisher, N., and P. Hanna. 2005. Characterization of Bacillus anthracis germinant receptors in vitro. J. Bacteriol. 187:8055-8062. [DOI] [PMC free article] [PubMed] [Google Scholar]
- 28.Fricke, B., et al. 2001. The cell envelope-bound metalloprotease (camelysin) from Bacillus cereus is a possible pathogenic factor. Biochim. Biophys. Acta 1537:132-146. [DOI] [PubMed] [Google Scholar]
- 29.Gaur, N. K., K. Cabane, and I. Smith. 1988. Structure and expression of the Bacillus subtilis sin operon. J. Bacteriol. 170:1046-1053. [DOI] [PMC free article] [PubMed] [Google Scholar]
- 30.Gaur, N. K., E. Dubnau, and I. Smith. 1986. Characterization of a cloned Bacillus subtilis gene that inhibits sporulation in multiple copies. J. Bacteriol. 168:860-869. [DOI] [PMC free article] [PubMed] [Google Scholar]
- 31.Gaur, N. K., J. Oppenheim, and I. Smith. 1991. The Bacillus subtilis sin gene, a regulator of alternate developmental processes, codes for a DNA-binding protein. J. Bacteriol. 173:678-686. [DOI] [PMC free article] [PubMed] [Google Scholar]
- 32.Grandvalet, C., M. Gominet, and D. Lereclus. 2001. Identification of genes involved in the activation of the Bacillus thuringiensis inhA metalloprotease gene at the onset of sporulation. Microbiology 147:1805-1813. [DOI] [PubMed] [Google Scholar]
- 33.Grass, G., et al. 2004. Camelysin is a novel surface metalloproteinase from Bacillus cereus. Infect. Immun. 72:219-228. [DOI] [PMC free article] [PubMed] [Google Scholar]
- 34.Grynberg, M., Z. Li, E. Szczurek, and A. Godzik. 2007. Putative type IV secretion genes in Bacillus anthracis. Trends Microbiol. 15:191-195. [DOI] [PubMed] [Google Scholar]
- 35.Guillen, N., Y. Weinrauch, and D. A. Dubnau. 1989. Cloning and characterization of the regulatory Bacillus subtilis competence genes comA and comB. J. Bacteriol. 171:5354-5361. [DOI] [PMC free article] [PubMed] [Google Scholar]
- 36.Horton, R. M., H. D. Hunt, S. N. Ho, J. K. Pullen, and L. R. Pease. 1989. Engineering hybrid genes without the use of restriction enzymes: gene splicing by overlap extension. Gene 77:61-68. [DOI] [PubMed] [Google Scholar]
- 37.Kallio, P. T., J. E. Fagelson, J. A. Hoch, and M. A. Strauch. 1991. The transition state regulator Hpr of Bacillus subtilis is a DNA-binding protein. J. Biol. Chem. 266:13411-13417. [PubMed] [Google Scholar]
- 38.Kastrup, C. J., et al. 2008. Spatial localization of bacteria controls coagulation of human blood by ‘quorum acting’. Nat. Chem. Biol. 4:742-750. [DOI] [PMC free article] [PubMed] [Google Scholar]
- 39.Kearns, D. B., F. Chu, S. S. Branda, R. Kolter, and R. Losick. 2005. A master regulator for biofilm formation by Bacillus subtilis. Mol. Microbiol. 55:739-749. [DOI] [PubMed] [Google Scholar]
- 40.Kodgire, P., M. Dixit, and K. K. Rao. 2006. ScoC and SinR negatively regulate epr by corepression in Bacillus subtilis. J. Bacteriol. 188:6425-6428. [DOI] [PMC free article] [PubMed] [Google Scholar]
- 41.Koehler, T. M., Z. Dai, and M. Kaufman-Yarbray. 1994. Regulation of the Bacillus anthracis protective antigen gene: CO2 and a trans-acting element activate transcription from one of two promoters. J. Bacteriol. 176:586-595. [DOI] [PMC free article] [PubMed] [Google Scholar]
- 42.Kuroda, A., and J. Sekiguchi. 1993. High-level transcription of the major Bacillus subtilis autolysin operon depends on expression of the sigma D gene and is affected by a sin (flaD) mutation. J. Bacteriol. 175:795-801. [DOI] [PMC free article] [PubMed] [Google Scholar]
- 43.Lewis, R. J., J. A. Brannigan, W. A. Offen, I. Smith, and A. J. Wilkinson. 1998. An evolutionary link between sporulation and prophage induction in the structure of a repressor:anti-repressor complex. J. Mol. Biol. 283:907-912. [DOI] [PubMed] [Google Scholar]
- 44.Liu, H., et al. 2004. Formation and composition of the Bacillus anthracis endospore. J. Bacteriol. 186:164-178. [DOI] [PMC free article] [PubMed] [Google Scholar]
- 45.Liu, L., M. M. Nakano, O. H. Lee, and P. Zuber. 1996. Plasmid-amplified comS enhances genetic competence and suppresses sinR in Bacillus subtilis. J. Bacteriol. 178:5144-5152. [DOI] [PMC free article] [PubMed] [Google Scholar]
- 46.Lopez, D., and R. Kolter. 2010. Extracellular signals that define distinct and coexisting cell fates in Bacillus subtilis. FEMS Microbiol. Rev. 34:134-149. [DOI] [PubMed] [Google Scholar]
- 47.Mandic-Mulec, I., L. Doukhan, and I. Smith. 1995. The Bacillus subtilis SinR protein is a repressor of the key sporulation gene spo0A. J. Bacteriol. 177:4619-4627. [DOI] [PMC free article] [PubMed] [Google Scholar]
- 48.Mandic-Mulec, I., N. Gaur, U. Bai, and I. Smith. 1992. Sin, a stage-specific repressor of cellular differentiation. J. Bacteriol. 174:3561-3569. [DOI] [PMC free article] [PubMed] [Google Scholar]
- 49.Mirończuk, A. M., Á. T. Kovács, and O. P. Kuipers. 2008. Induction of natural competence in Bacillus cereus ATCC14579. Microb. Biotechnol. 1:226-235. [DOI] [PMC free article] [PubMed] [Google Scholar]
- 50.Moir, A., B. M. Corfe, and J. Behravan. 2002. Spore germination. Cell. Mol. Life Sci. 59:403-409. [DOI] [PMC free article] [PubMed] [Google Scholar]
- 51.Nisnevitch, M., et al. 2006. Cyt2Ba of Bacillus thuringiensis israelensis: activation by putative endogenous protease. Biochem. Biophys. Res. Commun. 344:99-105. [DOI] [PubMed] [Google Scholar]
- 52.Ramarao, N., and D. Lereclus. 2005. The InhA1 metalloprotease allows spores of the B. cereus group to escape macrophages. Cell. Microbiol. 7:1357-1364. [DOI] [PubMed] [Google Scholar]
- 53.Ravel, J., et al. 2009. The complete genome sequence of Bacillus anthracis Ames “Ancestor”. J. Bacteriol. 191:445-446. [DOI] [PMC free article] [PubMed] [Google Scholar]
- 54.Saile, E., and T. M. Koehler. 2002. Control of anthrax toxin gene expression by the transition state regulator abrB. J. Bacteriol. 184:370-380. [DOI] [PMC free article] [PubMed] [Google Scholar]
- 55.Schuch, R., and V. A. Fischetti. 2009. The secret life of the anthrax agent Bacillus anthracis: bacteriophage-mediated ecological adaptations. PLoS One 4:e6532. [DOI] [PMC free article] [PubMed] [Google Scholar]
- 56.Setlow, P. 2003. Spore germination. Curr. Opin. Microbiol. 6:550-556. [DOI] [PubMed] [Google Scholar]
- 57.Shafikhani, S. H., I. Mandic-Mulec, M. A. Strauch, I. Smith, and T. Leighton. 2002. Postexponential regulation of sin operon expression in Bacillus subtilis. J. Bacteriol. 184:564-571. [DOI] [PMC free article] [PubMed] [Google Scholar]
- 58.Siden, I., G. Dalhammar, B. Telander, H. G. Boman, and H. Somerville. 1979. Virulence factors in Bacillus thuringiensis: purification and properties of a protein inhibitor of immunity in insects. J. Gen. Microbiol. 114:45-52. [DOI] [PubMed] [Google Scholar]
- 59.Smith, I., I. Mandic-Mulec, and N. Gaur. 1991. The role of negative control in sporulation. Res. Microbiol. 142:831-839. [DOI] [PubMed] [Google Scholar]
- 60.Sneath, P. H. A. 1986. Endospore-forming Gram-positive rods and cocci, p. 1104-1139. In J. G. Holt (ed.), Bergey's manual of systematic bacteriology. Williams & Wilkins Co., Baltimore, MD.
- 61.Srivatsan, A., et al. 2008. High-precision, whole-genome sequencing of laboratory strains facilitates genetic studies. PLoS Genet. 4:e1000139. [DOI] [PMC free article] [PubMed] [Google Scholar]
- 62.Stover, A. G., and A. Driks. 1999. Secretion, localization, and antibacterial activity of TasA, a Bacillus subtilis spore-associated protein. J. Bacteriol. 181:1664-1672. [DOI] [PMC free article] [PubMed] [Google Scholar]
- 63.Strauch, M. A., P. Ballar, A. J. Rowshan, and K. L. Zoller. 2005. The DNA-binding specificity of the Bacillus anthracis AbrB protein. Microbiology 151:1751-1759. [DOI] [PubMed] [Google Scholar]
- 64.Turnbull, P. C. 1999. Definitive identification of Bacillus anthracis—a review. J. Appl. Microbiol. 87:237-240. [DOI] [PubMed] [Google Scholar]
- 65.Valbuzzi, A., E. Ferrari, and A. M. Albertini. 1999. A novel member of the subtilisin-like protease family from Bacillus subtilis. Microbiology 145(Pt. 11):3121-3127. [DOI] [PubMed] [Google Scholar]
- 66.Xu, K., and M. A. Strauch. 1996. In vitro selection of optimal AbrB-binding sites: comparison to known in vivo sites indicates flexibility in AbrB binding and recognition of three-dimensional DNA structures. Mol. Microbiol. 19:145-158. [DOI] [PubMed] [Google Scholar]
- 67.Zaman, M. S., et al. 2005. Imaging and analysis of Bacillus anthracis spore germination. Microsc. Res. Tech. 66:307-311. [DOI] [PubMed] [Google Scholar]
Associated Data
This section collects any data citations, data availability statements, or supplementary materials included in this article.