

Abstract
The computational power needed for searching exponentially growing databases, such as GenBank, has increased dramatically. Three different implementations of the most widely used sequence alignment tool, known as BLAST (Basic Local Alignment Search Tool), are studied for their efficiency on nucleotide-nucleotide comparisons. The performance of these implementations are evaluated using target databases and query sequences of varying lengths and number of entries constructed from human genomic and EST sequences. In general, WU BLAST was found to be most efficient when the database and query composition are unknown. NCBI BLAST appears to work best when the database contains a small number of sequences, while mpiBLAST shows the power of database distribution when the number of bases per target database is large. The optimal number of compute nodes in mpiBLAST varies depending upon the database, yet in the cases studied, remains surprisingly low.
1. Introduction
Since the inception of the Human Genome Project in 1990, vast amounts of DNA and protein sequence data have been observed and generated by biologists and researchers in individual labs and large-scale sequencing centers throughout the world. This is due to advances in sequencing technology and the introduction of the first automated sequencing machines in 1986 [1]. A graph of the growth of one repository of sequence data, GenBank [2] shows an exponential growth in sequence data since its origination in 1982. The current release of GenBank (release 144.0) [3] contains 43.2 billion bases of DNA and protein sequence data. From a computer science perspective, scientists and scholars are interested in finding more efficient algorithms to retrieve and manage data in sequence database systems and to mine these databases for interesting properties.
One form of sequence data available is called an expressed sequence tag (EST), which represents a segment of a cDNA clones from a corresponding mRNA. ESTs potentially represent genes actively transcribed within a particular cell at a specific point in time. The average length of an EST is 200 – 600 base pairs [4, 5]. In addition to the human genome, researchers are interested in sequence analysis of comparative genomes, such as mouse [6], rat [7], rice [8, 9], and the mustard plant, Arabidopsis [10]. According to the latest information released by NCBI [11] as of Jan 15, 2005, the total number of human ESTs in the dbEST database [12] is over 6 million and there are a total of over 25 million entries for all organisms combined. By using comparison and alignments between EST and genomic sequences, these partial tags help to re-build the gene structure within each organism. Therefore, clustering large number of sequences becomes important to help identify any organism’s transcriptome, or transcribed portion of the genome.
A number of DNA and protein sequence alignment tools have been established, including FASTA [13, 14], BLAST [15, 16, 17, 18, 19], BLAT [20] and MUMmer [21]. Determining which alignment method performs the best in terms of computational efficiency and desired sensitivity under different conditions is not a straightforward task. One of the most (if not the most) widely used Bioinformatics tools used to study sequence similarity is BLAST. As a point of fact, about 140,000 daily visitors in early 2004 used NCBI’s version via the available web page [22]. Hence, the efficiency of three versions of BLAST, including NCBI BLAST (ncbiBLAST) [15, 16, 18], WU-BLAST (wuBLAST) [19] and mpiBLAST [23] are compared using various length query sequences and target databases.
1.1. BLAST
In 1990, researchers at the National Center for Biotechnology Information (NCBI) released a new software package for rapid DNA and protein sequence comparison [15]. This tool, known as Basic Local Alignment Search Tool (or more commonly by its acronym BLAST) can be used to detect high scoring local similarity segments between a sequence and a database of one or more sequences. BLAST directly computes the approximate alignments by improving upon the ideas of dynamic programming algorithm [24, 25], through assigning and recording scores in terms of insertions, deletions, and substitutions.
Only relatively conserved subsequences are considered in calculating the local similarity between two sequences. The initial filter of the BLAST algorithm searches for seed sequences of a particular length (11 bases for NCBI nucleotide-nucleotide BLAST) with a 100% conservation between the target and query sequences. Initial hits of seed sequences are then extend to check for larger regions of similarity. Though these searches, BLAST makes it possible to look for sequence homology within sequences by performing database searches, motif searches, and gene identification for both DNA and protein sequences. The original implementations of BLAST focus on an ungapped algorithm, where two sequences could only have matches and mismatches scattered throughout.
In 1995, one of the original authors of BLAST began development of the algorithm at Washington University (WU), independent of the NCBI effort. In the same year, the first release of wuBLAST (version 1.4) was made public. The performance of that original effort was very similar to ncbiBLAST [19]. However, independent development over the last ten years has led to the possibility of differences in efficiency. Those possible differences are explored.
In the nearly 15 years since the original development, a number of changes have been incorporated [17]. By 1997, both flavors of BLAST had incorporated the concept of alignments containing gaps [16]. Both NCBI and WU versions of BLAST have a number of programs in the suite. Among these are programs for nucleotide-nucleotide comparison (blastn); protein-protein comparison (blastp); nucleotide-protein comparison (tblastn); and translated nucleotide-nucleotide comparison (tblastx). In addition, the NCBI suite offers programs for looking at patterns gathered from multiple alignments of sequence conservation as seeds into sequence alignment. These two programs including position specific iterated blast (PSI-BLAST) [16] and pattern hit initiated blast (PHI-BLAST) [26].
While there are a number of different programs in the suite that could be studied, large-scale genomic level sequence comparisons are going to be vitally important as more and more genomes become available. Therefore, the nucleotide-nucleotide program, blastn, will be compared for both of these versions of BLAST.
1.2. mpiBLAST
One of the problems in searching large quantities of DNA and protein sequences, even with heuristic algorithms such as BLAST, is speed. However, BLAST is computationally intensive and has qualities that lend it to being parallelizable. An open source parallelization of BLAST was initiated in 2003 [27]. It implements the technique of message passing interface (MPI) to send out sequence database fragments to different nodes to perform the computation. This tool, mpiBLAST, attempts to reduce disk I/O in a single machine and parallelize BLAST on PC clusters.
mpiBLAST parallelizes individual queries. Through segmenting, the target database is divided into nearly identical length fragments, which are stored on a shared device. The size of each fragment is ideally designed to be small enough to fit into main memory. Once the mpiBLAST request is sent, the query is broadcasted into requested nodes. After receiving the responses from the slave or worker nodes, the master node assigns individual segments by copying them into local storage on one of the idle workers. Each node then performs ncbiBLAST of the query sequence individually on the assigned fragment of the original database. The slave or worker node will not return the result to the master node until it completes its computation. The master node will keep monitoring and assigning the database fragments to idle nodes until all fragments have been assigned. When all the requested nodes finish their sub-tasks, the master node will combine the results and send it back to the job sender.
Since each slave node works individually, those worker processes do not need to communicate to each other. Data decomposition is done by command --removedb before terminating execution.
1.3. Parallelization
ncbiBLAST, wuBLAST, and mpiBLAST all have a level of parallelization built in. The default setting of ncbiBLAST is to run on a one processor using multithreads. wuBLAST runs two threads at the same time in one processor machine. mpiBLAST requires at least two nodes and can run on an unlimited amount depending on the number processors available. Theoretically, searching for sequence similarities in a parallel fashion should be faster than using a single processor on the same data set. With this pre-assumption, mpiBLAST should be the fastest of the three BLAST programs. In addition, the more nodes that are used, the faster the job can be completed. Taking the parallelization mechanisms into account, the efficiency of ncbiBLAST, wuBLAST, and mpiBLAST on the three types of problems described in the methods section are compared.
Command line parameters available in wuBLAST allow a smooth transition into distributed database search. The command line options, dbrecmax and dbrecmin, allow user to block a range of database records to search by specifying the first and last database records to search, respectively [17]. A query sequence can then be searched against different portions of the database spread throughout a number of different nodes on a multiprocessor system. The results can then be combined into a single file, yielding results similar to a serial BLAST search. There are not any tools built into wuBLAST to handle the communication between sequence searches handled in this fashion.
2. Methods
2.1. Types of sequence searches
DNA sequence similarity searches can be performed at a number of levels. For instance, it is possible to search a single, relatively short sequence (such as a single EST) against a larger database and retrieve results from BLAST in a manner of seconds. However, interesting similarity questions also can occur by searching a large database of smaller sequences (in terms of sequence length) to find similarities within the sequences (for example, clustering of ESTs). A large database of smaller sequences can be searched against a database of larger sequences as well to find interesting similarities (such as localizing ESTs within a genome). In addition, it is important to find similarities between databases of longer sequences as well (for instance, in finding conservation in the genomic sequences of two comparative organisms). The efficiency of these three types of searches is studied using ncbiBLAST, wuBLAST, and mpiBLAST.
2.2. System and software
The three classes of comparisons made were based on the current version of the appropriate BLAST software available at the time of analysis. ncbiBLAST 2.2.9 (release date 5/12/2004) was downloaded from [18]. For wuBLAST, an academically licensed version 2.0MP WashU [22-Aug-2004] was downloaded from [19]. mpiBLAST 1.2.1 (2/6/2004) was downloaded from [24].
In order to test the parallel versions, a 16-node (32 cpu) Microway Athlon MP GigaCluster™ with an additional master node was used. Each node on the cluster has a dual AMD Athlon™ MP 2400+ 384K cache, 512MB DDR, 266 MHz ECC/REG low profile, plus a 40GB hard drive. Red Hat Linux version 7.3 with MPICH, Portable Batch System (PBS), and Microway Cluster Management Software was installed. The performance of wuBLAST, ncbiBLAST, and mpiBLAST were compared using three different systems. Each job was sent and managed by PBS.
wuBLAST and ncbiBLAST were also compared using two identical PCs. These PCs were equipped with a dual AMD Athlon™ MP processor 2800+ 512KB cache. These machines also have a 640K system RAM, a 2048 Extended RAM and a 120G mass drive as a storage system. The operating system is Suse Linux version 9.1, 2.6.4-52-smp i686 machine, and i386 hardware platform.
2.3. Data
Comparisons were made by focusing on human EST and genomic data. EST sequence data was downloaded using the GenBank Flat File Release 141.0. The resulting 305 dbEST files were parsed to select only those with Homo sapiens as the organism. After the human ESTs were filtered, they were masked for repetitive elements using RepeatMasker [28].
The repeat masked human goldenpath genomic assembly hg16-Jul2003 was downloaded for use from http://hgdownload.cse.ucsc.edu/goldenPath/hg16/chromosomes/. Each of the individual human contigs for a particular chromosome was placed into a file based on their cytogenetic position as an individual sequence entry. Blastable databases for each chromosome were created using the appropriate tool (xdformat for wuBLAST; formatdb for ncbiBLAST; and mpiformatdb for mpiBLAST).
After reviewing all of the filtered data, thirteen representative human EST sequence files and five representative chromosomal sequence files were chosen (Table 1). Each sequence file contains data for multiple sequences. Each of these files was chosen based on the total number of sequences in the file; the total number of bases in the file; and the average sequence length to be representative snapshots of the entire human EST and genomic data sets.
Table 1.
Data used for BLAST comparisons
| Sequence Name | File Size | # of sequences | # of bases |
|---|---|---|---|
| chr14 | 88,935,052 | 1 | 87,191,216 |
| chr22 | 35,039,241 | 11 | 34,352,072 |
| chr17 | 80,964,851 | 30 | 79,376,966 |
| chr9 | 120,146,880 | 60 | 117,790,386 |
| chr1 | 231,366,553 | 91 | 226,828,929 |
|
| |||
| est283 | 3,350 | 7 | 2,593 |
| est277 | 7,259 | 15 | 5,781 |
| est136 | 300,995 | 521 | 210,054 |
| est147 | 724,214 | 1,085 | 563,737 |
| est149 | 1,603,440 | 2,433 | 1,244,897 |
| est126 | 2,466,032 | 3,031 | 2,053,889 |
| est241 | 3,312,648 | 4,991 | 2,502,256 |
| est176 | 7,002,704 | 10,149 | 5,274,323 |
| est113 | 19,434,153 | 20,347 | 16,714,000 |
| est270 | 16,447,012 | 24,764 | 12,934,924 |
| est1 | 19,969,430 | 36,800 | 14,021,420 |
| est91 | 33,883,614 | 50,522 | 27,683,871 |
| est166 | 33,064,286 | 71,748 | 25,130,960 |
2.4. Comparisons made
In order to determine the efficiency of the various implementations of BLAST, the representative EST and genomic data are used in four separate comparisons with different query sequences (Q) and target databases (T): EST (Q) vs. EST (T); EST (Q) vs. chromosome (T); chromosome (Q) vs. EST (T); and chromosome (Q) vs. chromosome (T).
EST vs. EST compares when sequences in both the database and query are short. Chromosome vs. chromosome tests when both query sequences and target databases are large sequences. Compared to an EST sequence, the number of nucleotide bases in a finished chromosome contig is much larger. But the number of sequences in each chromosome file is smaller, ranging from one sequence (chr14) to 91 sequences (chr1) for the representative sequences. Therefore, in EST vs. chromosome, the longer (in base length) sequences were used as a database and the smaller sequences were used as the query. In order to determine if the order in which these comparisons are made makes a difference, we reversed the database and query sequences as chromosome vs. EST is performed.
In mpiBLAST, using the command mpiformatdb, the database will be segmented into fragments. The database created may not contain the same number of sequences, but should be nearly equal size overall, if possible. In order to determine the number of fragments to use in mpiBLAST, three different sequences, chr22, chr1, and est166 were used. The number of fragments, or nodes used, is broken down according to the resulting fragment size. The results are shown in Table 2.
Table 2.
Fragment information in mpiBLAST
| sequence | # of fragment | size per fragment |
|---|---|---|
| chr22 | 9 | ~1MB |
| 8 | ~2MB | |
| 5 | ~4MB | |
| 3 | ~9MB | |
| 1 | ~35MB | |
|
| ||
| chr1 | 44 | ~2MB |
| 30 | ~5MB | |
| 25 | ~8MB | |
| 20 | ~11MB | |
| 15 | ~19MB | |
| 10 | ~29MB | |
| 1 | ~227MB | |
|
| ||
| est166 | 26 | ~1MB |
| 13 | ~2MB | |
| 7 | ~4MB | |
| 1 | ~26MB | |
3. Results
3.1. EST vs. EST
The first series of comparisons made dealt with short length sequence databases versus short length sequence queries. All thirteen representative EST sequence files (Table 1) were put into an individually blastable database. Each database was then searched for comparisons to the thirteen representative EST sequence files one at a time.
What is interesting to note is that when the number of sequences in the database is small, ncbiBLAST seems to perform marginally better than wuBLAST (Figure 1a). On the system tested, the results indicate a delay of up to ~690 sec (~11.5 min) can be observed on the data used.
Figure 1.

a. ncbiBLAST performs best when the number of sequences in the database is small
b. wuBLAST performs best when the number of sequences in the database is greater
(w: result run by wuBLAST, n: result run by ncbiBLAST, 283: est283, 241: est241, and so on)
However, as the number of sequences in the database increases, the time spent in wuBLAST for sequences comparison tends to be smaller in comparison to ncbiBLAST (Figure 1b). This is especially evident in the four comparisons of the last two sequences, est91 vs. est91, est91 vs. est166, est166 vs. est91, and est166 vs. est166, where it took wuBLAST 3,669 ~ 7,702 sec (61.2 ~ 128.4 min) to complete the work. It took ncbiBLAST 8,557 ~ 14,312 sec (142.6 ~ 238.5 min), or approximately twice as long, to do the same job.
The sequence file est270, which contains 24,764 sequences, needs more time to complete each task (Results not shown). When est270 served as a query, it even needs more time to finish compared to the other three longer sequences, est1, est91, and est166. When est270 is compared against itself, it needs 12,822 sec (213.7 min) to complete. This makes the cumulative time to complete the whole series higher than any series in Figure 2.
Figure 2.
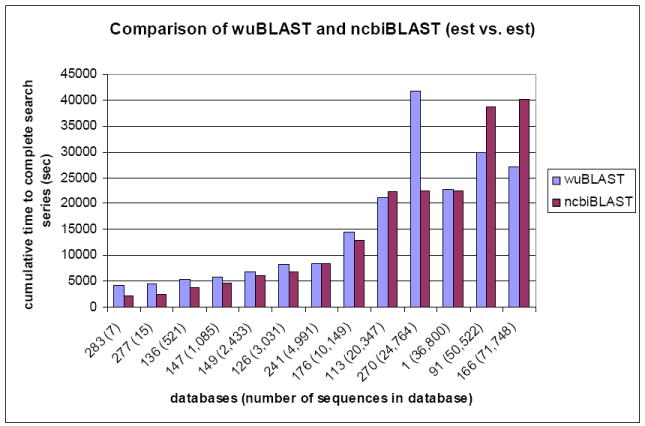
Cumulative results of wuBLAST and ncbiBLAST in the EST vs. EST comparison.
(283: est283, 277: est277 and so on)
Suppose the time needed to complete a database search is based on the number of sequences. est166 contains the most number of sequences. If est166 is served as a query to search database, almost every job needs the longest time to complete. However, est270 does not contain the largest number of sequences in these thirteen files but took the longest time to complete its task against itself. Or suppose the larger number of bases per sequence would take more time to complete a database search. If the number of nucleotide bases is divided by the number of sequences in each EST data in Table 1, the average number of bases per sequence in the EST dataset ranges from ~350 (est166) to ~821 (est113). est113 should take the longest time to complete because it contains the largest average number of bases per sequence. But it did not.
There are 13 EST sequences with different lengths and number of nucleotide bases. The cumulative time taken to complete all 13 comparisons for each query is shown (Figure 2). wuBLAST could take ~750 sec (~12.5 min) to ~2111 sec (~35.2 min) longer than ncbiBLAST in the first six databases, est283, est277, est136, est147, est149, and est126 (Figure 2).
The results for mpiBLAST using an EST vs. EST comparison are shown using est166 as the database, and four of the representative EST sequences files as the query (est136, est147, est241, and est176). Besides a master node, all mpiBLAST searches were tested using the number of nodes from 1 to 15, due to the upper limitation of 16-nodes on the system. The results indicate that as the number of nodes used to complete the search increases, the total search time decreases (Figure 3). However, as a very interesting side note, mpiBLAST does not appear to be more efficient at searching for sequence similarities.
Figure 3.

a. est166 target database vs. est136 and est147 query sequences.
b. est166 target database vs. est241 and est176 query sequences.
3.2. EST vs. chromosome
This series of comparisons was created to test short length sequence databases versus long length sequence queries. As in EST vs. EST, all thirteen representative EST sequence files were put into an individually blastable database. Each database was searched for comparisons to the five representative chromosome sequence files one at a time.
Each database search is accomplished as a series after being searched by 5 queries. Figure 4 shows the comparison between wuBLAST and ncbiBLAST as the cumulative time to finish the whole series of searches. Generally speaking, wuBLAST works better than ncbiBLAST in this comparison. On average, ncbiBLAST takes 1.6 ~ 4.5 times longer to accomplish the whole series of comparisons than wuBLAST.
Figure 4.
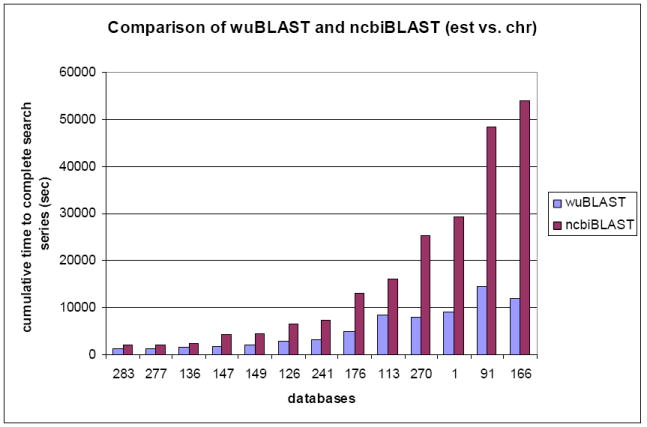
Cumulative results of wuBLAST and ncbiBLAST for EST vs. chromosome.
(283: est283, 277: est277, …)
The results of wuBLAST (Figure 5) appear to be ordered in increasing time. However, the results of ncbiBLAST drop in the middle of the graph for chr14. The number of nucleotide bases in chr14 is 87,191,216. However, there is only one sequence in chr14. It is possible this sequence may cause memory problems due to its length, or that disk I/O transfer contributes to a bottleneck.
Figure 5.
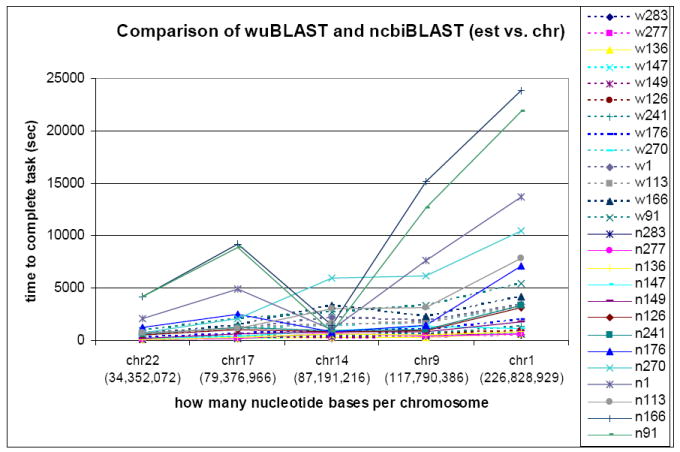
Results of wuBLAST and ncbiBLAST for EST vs. chromosome. (w: result run by wuBLAST, n: result run by ncbiBLAST, 283: est283, 241: est241, …)
3.3. chromosome vs. EST
The gain in efficiency of running mpiBLAST instead of ncbiBLAST can be seen after using chromosome sequences as the database. The results for mpiBLAST using chromosome vs. EST comparison are shown using chr22 and chr1 as databases, and two representative EST sequences, est136 and est147, as the queries. The results of the comparison among wuBLAST, ncbiBLAST, and mpiBLAST are shown in Figure 6a and Figure 6b, with mpiBLAST run using a variable number of nodes (as listed in the figure legend). As Table 3 illustrates, the optimal number of nodes used varies depending upon the query sequence and the size of the database fragments.
Figure 6.

a. chr22 target database vs. est136 and est147 query sequences.
b. chr1 target database vs. est136 and est147 query sequences.
Table 3.
Optimal number of nodes used with mpiBLAST on a varying number of database fragments.
| chr22 | est136 | est147 | chr1 | est136 | est147 |
|---|---|---|---|---|---|
| mpiBLAST-1 | 2 | 3 | mpiBLAST-1 | 2 | 1 |
| mpiBLAST-3 | 4 | 3 | mpiBLAST-10 | 6 | 7 |
| mpiBLAST-5 | 6 | 3 | mpiBLAST-15 | 7 | 7 |
| mpiBLAST-8 | 6 | 5 | mpiBLAST-20 | 6 | 9 |
| mpiBLAST-9 | 4 | 5 | mpiBLAST-25 | 8 | 7 |
| mpiBLAST-30 | 5 | 13 | |||
| mpiBLAST-44 | 11 | 15 |
Listed in the first column is the number of database fragments. The second and third columns list the optimal number of nodes used for two separate queries: est136 and est147 with chromosome 22 (chr22) as the target database.
3.4. chromosome vs. chromosome
A small number of bases per sequence (EST) and large number of bases per sequence (chromosome) have been chosen as queries to search the databases, in the EST vs. EST, EST vs. chromosome, and chromosome vs. EST comparisons. If both the query and database contain a large number of bases per sequence, it is possible the performance would vary drastically due to a high memory load and increased disk I/O. In order to test this, all five chromosome contig files were put into an individually blastable database, and each database was searched for comparisons to the five representative chromosome sequence files one at a time.
Twenty-five comparisons were made and four cumulative results are generated in Figure 7. In general, ncbiBLAST could take 1.7 ~ 2.8 times longer to complete the whole series of work than wuBLAST. The cumulative time to complete the whole series of comparisons with chr1 as the database in wuBLAST is 53,301 sec (~14.8 hr) (results not shown). The result to compare chr1 to chr1 in ncbiBLAST took more than 600,000 sec (~166.7 hr or ~ 6.9 days) to complete. The reason for the tremendous slowdown in ncbiBLAST for chr1 is unknown, but could be related to the large number of sequences (91) and bases (226,828,929), which could cause a heavy memory load.
Figure 7.
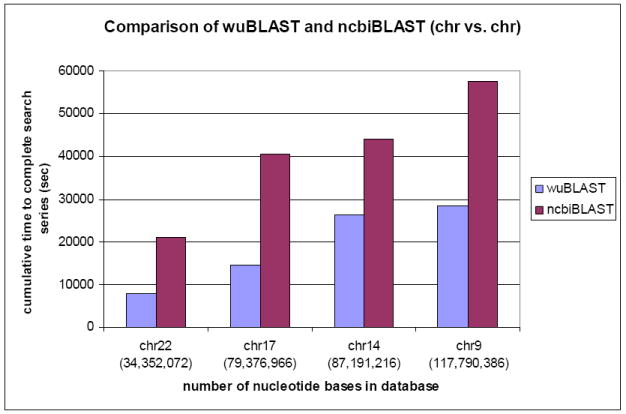
Cumulative results of wuBLAST and ncbiBLAST using chromosome vs. chromosome.
4. Discussion
Figure 8 shows the results obtained by using different numbers of database fragments segmented for mpiBLAST. Ideally, the speed up could be predicted to be linear, as long as the number of fragments does not exceed the number of available processors. Take 13 fragments in Figure 8a for instance. Theoretically, the result running on 2 nodes should be half of the result running on 1 node. The result running on 3 nodes should be one third of the result running on 1 node, and so on. Thus, running on 15 nodes should come out with the best result. However, as Figure 8a illustrates, the results of using multiple database is segmented into 7 fragments, running on 3 ~ 4 nodes will provide the best result. If the database is divided into either 13 or 26 fragments, the best results will be obtained by running on 6 ~ 7 nodes in mpiBLAST. However, when the chromosome is used as the database, the optimal number of nodes changes (Figure 8b).
Figure 8.

a. est166 target database vs. est136 query sequence in mpiBLAST.
b. chr1 target database vs. est136 query sequence in mpiBLAST
The average number of bases per sequence for each chromosome is far larger than the average number of bases per sequence for the ESTs. Hence, if both the size of a chromosome fragment and the size of an EST fragment is ~1MB, the chromosome fragment would contain fewer sequences with a larger average size than the EST fragment.
blastn compares sequences one by one between the database file and the query file. Fewer comparisons in a query will result in a smaller time requirement for the comparison. Therefore, the number of sequences in the chromosome database fragment in the chromosome vs. EST comparison is far less than the number of sequences in the EST database fragment.
The idea behind mpiBLAST is to try to decrease the disk I/O. It performs better than ncbiBLAST running on a single processor because the content of each fragment can be easily fit into cached memory. It avoids the allocation problem of large contents in memory causing more disk I/O. However, spreading into different nodes to complete the whole task required time for communication between the master node and slave/worker nodes. Figures 6 and 8 indicate where potential bottlenecks occur. Another consideration is network flow. A network bottleneck could be a problem if lots of data need to be transported at the same time.
5. Conclusion
Based on the results above, in general, wuBLAST works the best among these three tools using the default settings. But when dealing with a smaller number of sequences in the database, ncbiBLAST can perform well. mpiBLAST can speed up the search when the number of sequences in a fragment is small but the number of nucleotide bases is large. The user can choose a suitable BLAST to work with different size of data and different number of sequences.
To help identify any organism’s transcriptome, or transcribed portion of the genome, clustering large number of sequences is needed and necessary. It requires not only thousands of comparisons to sequences in a database, but rather billions of records are there to be searched. Therefore, finding the best technique to take advantage of computation in parallel becomes paramount.
Acknowledgments
The authors thank members of Bioinformatics Research Group at the University of Louisville for their comments and suggestions. ER also acknowledges support of the National Center for Research Resources grant 2P20RR016481-04 (Nigel Cooper, PI).
Contributor Information
I. Elizabeth Cha, University of Louisville Department of Computer Engineering and Computer Science, Louisville, KY 40292, icha@louisville.edu
Eric C. Rouchka, University of Louisville Department of Computer Engineering and Computer Science, Louisville, KY 40292, eric.rouchka@louisville.edu
References
- 1.Smith LM, et al. Fluorescence detection in automated DNA sequence analysis. Nature. 1986;321(6071):674–679. doi: 10.1038/321674a0. [DOI] [PubMed] [Google Scholar]
- 2.GenBank. http://www.ncbi.nlm.nih.gov/Genbank/genbankstats.html.
- 3.NCBI (National Center of Biotechnology Institution) GenBank Flat File Release 144.0. ftp://ftp.ncbi.nih.gov/genbank/gbrel.txt.
- 4.Adams MD, et al. Complementary DNA Sequencing: Expressed Sequence Tags and Human Genome Project. Science. 1991;252(5013):1651–6. doi: 10.1126/science.2047873. [DOI] [PubMed] [Google Scholar]
- 5.Boguski MS. The turning point in genome research. Trends Biochem Sci. 1995;20(8):295–6. doi: 10.1016/s0968-0004(00)89051-9. [DOI] [PubMed] [Google Scholar]
- 6.NCBI. Mouse Genome Sequencing. http://www.ncbi.nlm.nih.gov/genome/seq/MmHome.html.
- 7.NCBI. Rat Genome Resources. http://www.ncbi.nlm.nih.gov/genome/guide/rat/
- 8.Sasaki T, et al. The genome sequence and structure of rice chromosome 1. Nature. 2002;420(6913):312–316. doi: 10.1038/nature01184. [DOI] [PubMed] [Google Scholar]
- 9.US Rice Genome Sequencing. http://www.usricegenome.org/
- 10.TAIR (The Arabidopsis Information Resource) http://www.arabidopsis.org/
- 11.NCBI. dbEST summary. http://www.ncbi.nlm.nih.gov/dbEST/dbEST_summary.html.
- 12.Boguski MS, et al. dbEST – database for expressed sequences tags. Nature Genetics. 1993;4(4):332–333. doi: 10.1038/ng0893-332. [DOI] [PubMed] [Google Scholar]
- 13.Lipman DJ, Pearson WR. Rapid and sensitive protein similarity searches. Science. 1985;227:1435–1441. doi: 10.1126/science.2983426. [DOI] [PubMed] [Google Scholar]
- 14.Pearson WR, Lipman DJ. Improved Tools for Biological Sequence Comparison. Proc Natl Acad Sci U S A. 1988;85(8):2444–2448. doi: 10.1073/pnas.85.8.2444. [DOI] [PMC free article] [PubMed] [Google Scholar]
- 15.Altschul SF, et al. Basic Local Alignment Search Tool. J Mol Biol. 1990;215:403–410. doi: 10.1016/S0022-2836(05)80360-2. [DOI] [PubMed] [Google Scholar]
- 16.Altschul SF, et al. Gapped BLAST and PSI-BLAST: a new generation of protein database search programs. Nucleic Acids Research. 1997;25:3389–3402. doi: 10.1093/nar/25.17.3389. [DOI] [PMC free article] [PubMed] [Google Scholar]
- 17.Korf I, Yandell M, Bedell J. BLAST – An Essential Guide to the Basic Local Alignment Search Tool. O’Reilly & Assoicates, Inc.; Sebastopol, CA, U.S.A.: Jul, 2003. [Google Scholar]
- 18.NCBI BLAST. http://www.ncbi.nlm.nih.gov/BLAST/
- 19.WU-BLAST. http://blast.wustl.edu/
- 20.Kent WJ. BLAT – the BLAST-like alignment tool. Genome Research. 2002;12(4):656–664. doi: 10.1101/gr.229202. [DOI] [PMC free article] [PubMed] [Google Scholar]
- 21.Delcher AL, et al. Fast algorithms for large-scale genome alignment and comparison. Nucleic Acids Research. 2002;30(11):2478–2483. doi: 10.1093/nar/30.11.2478. [DOI] [PMC free article] [PubMed] [Google Scholar]
- 22.McGinnis S, Madden TL. BLAST: at the core of a powerful and diverse set of sequence analysis tools. Nucleic Acids Research. 2004;32(Web Server issue):W20–W25. doi: 10.1093/nar/gkh435. [DOI] [PMC free article] [PubMed] [Google Scholar]
- 23.mpiBLAST. http://mpiblast.lanl.gov/
- 24.Needleman SB, Wunsch CD. A general method applicable to the search for similarities in the amino acid sequences of two proteins. J Mol Biol. 1970;48:443–453. doi: 10.1016/0022-2836(70)90057-4. [DOI] [PubMed] [Google Scholar]
- 25.Waterman MS. General methods of sequence comparison. Bull Math Biol. 1984;46:473–500. [Google Scholar]
- 26.Zhang Z, et al. Protein sequence similarity searches using patterns as seeds. Nucleic Acids Research. 1998;26(17):3986–3990. doi: 10.1093/nar/26.17.3986. [DOI] [PMC free article] [PubMed] [Google Scholar]
- 27.Darling AE, et al. The Design, Implementation, and Evaluation of mpiBLAST. Cluster World Conference & Expo and the 4th International Conference on Linux Clusters: The HPC Revolution 2003, LA-UR 03-2862; June 2003; San Jose, CA, U.S.A.. [Google Scholar]
- 28.RepeatMasker. http://www.repeatmasker.org.