

Abstract
Background and Purpose
To identify significant morphologic and hemodynamic parameters that discriminate intracranial aneurysm (IA) rupture status using 3D angiography and computational fluid dynamics (CFD).
Methods
119 IAs (38 ruptured, 81 unruptured) were analyzed from 3D angiographic images and CFD. Six morphologic and seven hemodynamic parameters were evaluated for significance with respect to rupture. Receiver-operating characteristic (ROC) analysis identified area under the curve (AUC) and optimal thresholds separating ruptured from unruptured aneurysms for each parameter. Significant parameters were examined by multivariate logistic regression analysis in 3 predictive models—morphology only, hemodynamics only, and combined—to identify independent discriminants, and the AUC-ROC of the predicted probability of rupture status was compared among these models.
Results
Morphologic parameters (Size Ratio [SR], Undulation Index, Ellipticity Index, and Nonsphericity Index) and hemodynamic parameters (Average Wall Shear Stress [WSS], Maximum intra-aneurysmal WSS, Low WSS Area, Average Oscillatory Shear Index [OSI], Number of Vortices, and Relative Resident Time) achieved statistical significance (p<0.01). Multivariate logistic regression analysis demonstrated SR to be the only independently significant factor in the morphology model (AUC=0.83, 95% confidence interval [CI] 0.75–0.91), whereas WSS and OSI were the only independently significant variables in the hemodynamics model (AUC=0.85, 95% CI 0.78–0.93). The combined model retained all three variables, SR, WSS, and OSI (AUC=0.89, 95% CI 0.82–0.96).
Conclusion
All three models—morphological (based on SR), hemodynamic (based on WSS and OSI), and combined—discriminate IA rupture status with high AUC values. Hemodynamics is as important as morphology in discriminating aneurysm rupture status.
Keywords: Hemodynamics, Intracranial aneurysm, Morphology, Rupture
Given the not-insignificant risk of treating unruptured intracranial aneurysms (IAs) as well as the known severe morbidity of aneurysm rupture, deciding on those aneurysms that require prophylactic treatment can be a quandary. Decision-making to treat an unruptured aneurysm is largely based on the Size of the aneurysm; but recent studies have failed to show significant correlation of Size with IA rupture,1 and many ruptured aneurysms are small in Size.2 Consequently, shape-based morphologic metrics have been explored in current investigations, and complex shapes have been correlated with rupture.1, 3 With the advancement of 3D imaging and computational fluid dynamics (CFD) technology, patient-specific hemodynamics analysis has become feasible.4–6 Intra-aneurysmal hemodynamic factors, including wall shear stress (WSS), impingement regions, inflow jet sizes, and oscillatory shear index (OSI), have been proposed as indicators for IA rupture risk.4–7 No study has comprehensively examined both morphology-based and hemodynamics-based parameters from a cohort of IA cases. Our aim was to identify significant morphologic and hemodynamic parameters that correlate with aneurysm rupture status using 3D angiographic image reconstruction and CFD analysis.
Methods
3D angiography images of patients with IAs that were diagnosed or treated during 2006–2009 at Millard Fillmore Gates Hospital (a University at Buffalo affiliate) were reviewed. All collected images were examined for suitability to be included in the study. Only cases in which the 3D images were of sufficient quality for accurate segmentation and reconstruction were included because CFD analysis critically depends on accurate 3D geometry.7, 8 Consequently, 119 aneurysms from 106 patients met these criteria and were used in this study after obtaining Institutional Review Board (University at Buffalo) approval. Seventeen of the 119 cases used for the current study were reported in our previous morphologic study.9 The total dataset in the current study included 38 ruptured and 81 unruptured IAs. Aneurysm locations and types (bifurcation/terminal or sidewall) are shown in Table 1. 3D aneurysm geometries were reconstructed from DSA images, except for anterior communicating artery (ACOM) aneurysms. All 24 ACOM aneurysms were reconstructed from CTA images instead, because 1) capturing the 3D geometry of the ACOM region from DSA would require fusion of images from bilateral ICA injections, and both injections were not always available; 2) there may be differences in the luminograms obtained from each side due to flow variations across the ACOM.
Table 1.
Aneurysm locations and types
| Location | Number of Cases |
Sidewall* | Bifurcation** | ||
|---|---|---|---|---|---|
| Ruptured | Unruptured | Ruptured | Unruptured | ||
| ICA | 48 | 4 | 43 | 0 | 1 |
| MCA | 12 | 1 | 2 | 9 | |
| PCOM | 12 | 5 | 2 | 2 | 3 |
| PCA | 3 | 1 | 2 | ||
| ACOM | 24 | 1 | 20 | 3 | |
| ACA | 8 | 1 | 6 | 1 | |
| BA | 7 | 7 | |||
| PICA | 4 | 2 | 1 | 1 | |
| VA | 1 | 1 | |||
| Total | 119 | 14 | 56 | 24 | 25 |
| 70 | 49 | ||||
Abbreviations: ACA=anterior cerebral artery, ACOM=anterior communicating artery, BA=basilar artery, ICA=internal carotid artery, MCA=middle cerebral artery, PCA=posterior cerebral artery, PCOM=posterior communicating artery, PICA=posterior inferior cerebellar artery, VA=vertebral artery.
We define sidewall aneurysms as those saccular aneurysms originating from only one parent vessel or from the origin of a small branch whose caliber is less than 1/5 of the parent vessel. The efferent and afferent parent vessels have similar calibers. ICA-ophthalmic artery aneurysms are classified as sidewall aneurysms.
We define bifurcation aneurysms as those saccular aneurysms located at major bifurcations in the cerebral vessel.
Morphologic Parameters Calculation
Previously studied morphology-based metrics9—Aneurysm Size, Aspect Ratio [AR], Size Ratio [SR], Undulation Index [UI], Nonsphericity Index [NSI], and Ellipticity Index [EI]—were calculated from 3D-angiography images that were acquired and reconstructed as described previously.9
Computational Fluid Dynamics Modeling
Each IA model was meshed using ANSYS ICEM CFD software (ANSYS Inc., Canonsburg, PA) to create 300,000–1 million finite volume tetrahedral elements and wall prism elements (for accurate boundary layer resolution). The incompressible Navier-Stokes equations were solved numerically under pulsatile flow conditions using Star-CD (CD Adapco, Melville, NY). Published mean flow rates were used as inlet boundary conditions for given vessel locations.10 The pulsatile velocity waveform was obtained from transcranial Doppler ultrasound measurement on a normal subject with its magnitude scaled to the desired mean flow rate. Traction-free boundary conditions were implemented at the outlet. The mass flow rate through each outlet artery was proportional to the cube of its diameter based on the principle of optimal work.11 As the non-Newtonian effect is generally negligible in medium and large arteries (those harboring aneurysms),12 blood was modeled as a Newtonian fluid with a density of 1056 kg/m3 and a viscosity of 0.0035 N·s/m2. Because the wall distensibility contributes minimally to the aneurysmal flow pattern and requires prohibitively expensive fluid-structure interaction modeling, a rigid-wall no-slip boundary condition was implemented at the vessel walls.8
Three pulsatile cycles were simulated to ensure that numerical stability had been reached, and the last cycle was taken as output. All data presented are time-averages over the third pulsatile cycle of flow simulation.
Hemodynamic Parameters Calculation
From the simulated flow fields, we calculated the following hemodynamic parameters: WSS, Maximum Intra-aneurysmal WSS (MWWS), Low WSS Area, WSS Gradient [WSSG], Oscillatory Shear Index [OSI], Number of Vortices [NV], and Relative Residence Time [RRT].
Wall Shear Stress (WSS)-Related Parameters
The concept of WSS refers to the tangential, frictional stress caused by the action of blood flow on the vessel wall. For pulsatile flow, the time-averaged WSS was calculated by integrating the WSS magnitude at each node over the cardiac cycle:
| (Eq.1) |
where wssi is the instantaneous shear stress vector and T is the duration of the cycle. In this study, WSS distributions were normalized by the average parent vessel WSS in the same patient to allow comparison among different patients.13 We evaluated the following WSS-based parameters:
WSS–Defined as WSS (already time-averaged, as in Eq.1), further averaged over dome area (the entire luminal surface of the aneurysm sac).
MWSS–Defined as maximum intra-aneurysmal WSS magnitude normalized by the parent vessel WSS.
Low WSS Area (LSA)–Defined as the areas of the aneurysm wall exposed to a WSS below 10% of the mean parent arterial WSS and then normalized by the dome area.13
WSSG–The WSSG measures the change of WSS magnitude in the flow direction and is calculated by taking the spatial derivative of WSS with respect to the streamwise distance.14 The time-averaged WSSG was further averaged over the dome area.
Oscillatory Shear Index (OSI)
OSI, a non-dimensional parameter, measures the directional change of WSS during the cardiac cycle:15
| (Eq.2) |
where wssi is the instantaneous WSS vector and T is the duration of the cycle. OSI is often used to describe the disturbance of a flow field.
OSI–Defined as OSI averaged over the dome area.
Number of Vortices (NV)
The number of vortices was counted based on the velocity field of the representative cross-sectional plane for each aneurysm.
Relative Residence Time (RRT)
Himburg et al.16 reasoned that a combination of WSS and OSI reflects the residence time of blood near the wall. Thus, a new metric termed RRT was defined to quantify the state of disturbed flow.17 By incorporating Eq.1 and Eq.2 into the definition, RRT is inversely proportional to the magnitude of the time-averaged WSS vector:
| (Eq.3) |
Statistical Analysis
Univariate analysis of differences between ruptured and unruptured groups
The means and standard deviations of all morphological and hemodynamic parameters were calculated for the ruptured and unruptured groups. A Jarque-Bera test for departure from a normal distribution was performed to determine if a parameter was normally distributed. A two-tailed independent Student’s t-test (for normally distributed data) or Wilcoxon rank-sum test (for abnormally distributed data) was performed for each parameter to assess the statistical significance of the observed difference between the mean values of ruptured and unruptured groups. P-values from the two tests were calculated and statistical significance was assumed for p<0.01. Receiver-operating characteristics (ROC) analysis was performed on all parameters to determine the optimal thresholds separating ruptured and unruptured groups by calculating the area under the ROC curve (AUC).
Multivariate logistic regression on the significant variables
The parameters found to be significant (p<0.01) were further analyzed using multivariate logistic regression (backward elimination) to identify those that retained significance when accounting for all relevant variables. Before performing the regression, each variable was scaled to span a range from 0–10, thereby easing odds ratio comparison by ensuring that a unit increase in the parameter corresponded to 10% of its observed range.
Logistic regression was then performed on the significant variables (in the morphologic category alone, hemodynamic category alone, and combined categories) to find final parsimonious models that allowed calculation of the quantitative risk of aneurysm rupture. These three models would predict the probability of an aneurysm being ruptured on the basis of morphology, hemodynamics, or both. To compare the ability of the individual regression models to discriminate rupture status, we calculated the AUC-ROC on the predicted probability of rupture status from these regression models. Results were analyzed for statistically significant differences in the AUC-ROC values of the three models.
Statistical analyses were performed using Microsoft Excel, MATLAB (The MathWorks Inc., Natick, MA) and SPSS (SPSS Inc., Chicago, IL).
Results
Descriptive flow characterization
Hemodynamic simulation showed that most ruptured aneurysms (61%) had complex flow patterns with multiple vortices. In contrast, most unruptured aneurysms (75%) had simple flow patterns with a single vortex. Figure 1 shows examples of time-averaged velocity fields in the representative cross-sectional planes in ruptured and unruptured groups. Distributions of WSS for ruptured and unruptured aneurysms are exemplified in Figure 2. In ruptured IAs, WSS values were lower within the aneurysm than in the parent vessels, whereas in unruptured IAs, they were comparable. Ruptured aneurysms had lower WSS magnitudes and larger areas of low WSS than unruptured aneurysms. The distributions of OSI for ruptured and unruptured aneurysms in Figure 3 show that ruptured IAs had a higher OSI than unruptured IAs.
Figure 1.

Flow patterns for 8 representative ruptured (top) and 10 unruptured (bottom) intracranial aneurysms (IAs). On each of the middle cross-sectional plane flow pattern visualizations, the cross-sectional velocity vector plane has been overlapped on top of the corresponding aneurysm geometry to clearly show the cutting plane. ACA=anterior cerebral artery, ACOM=anterior communicating artery, BA=basilar artery, ICA=internal carotid artery, MCA=middle cerebral artery, PCA=posterior cerebral artery, PCOM=posterior communicating artery.
Figure 2.

Wall shear stress (WSS) distributions for 8 representative ruptured (top) and 10 unruptured (bottom) IAs.
Figure 3.

Oscillatory shear index (OSI) distribution for 8 representative ruptured (top) and 10 unruptured (bottom) IAs.
Differences between ruptured and unruptured groups from univariate analyses
Values for means and standard deviations for each variable are given in Table 2. From the Jarque-Bera test, we found that WSS, MWSS, LSA, OSI, NV, and RRT were not normally distributed, whereas the rest of the parameters were normally distributed. From the t-test and rank-sum test, significant differences were found between the means for ruptured and unruptured IAs for the four morphological parameters SR (p<0.0001), UI (p=0.0001), EI (p=0.0003), and NSI (p<0.0001) and the six hemodynamic parameters WSS (p<0.0001), MWSS (p=0.0002), LSA (p<0.0001), OSI (p<0.0001), NV (p=0.0002), and RRT (p<0.0001) (Table 2). Parameters that were not significantly different between the two groups were Aneurysm Size, AR, and WSSG.
Table 2.
Results from univariate statistical analysis for all parameters examined in ruptured and unruptured aneurysm cases
| Parameter | Data Range |
Ruptured Mean |
Unruptured Mean |
P value | AUC | Threshold |
|---|---|---|---|---|---|---|
| Size (mm) | 1.1–13.2 | 5.15±2.72 | 4.01±2.00 | 0.027 | 0.62 | 2.98 |
| AR | 0.3–3.0 | 1.36±0.66 | 1.07±0.45 | 0.027 | 0.63 | 1.27 |
| UI | 0.01–0.63 | 0.10±0.064 | 0.058±0.077 | 0.0001 | 0.72 | 0.090 |
| EI | 0.02–0.27 | 0.16±0.062 | 0.12±0.057 | 0.0003 | 0.71 | 0.13 |
| NSI | 0.02–0.32 | 0.19±0.074 | 0.14±0.063 | <0.0001 | 0.73 | 0.16 |
| SR | 0.4–9.2 | 3.14±1.64 | 1.58±0.86 | <0.0001 | 0.83 | 1.75 |
| WSS | 0.02–2.1 | 0.33±0.28 | 0.68± 0.40 | <0.0001 | 0.78 | 0.39 |
| MWSS | 0.32–13.35 | 2.71±2.20 | 3.87±1.91 | 0.0002 | 0.72 | 2.40 |
| LSA | 0–0.96 | 0.38±0.31 | 0.10±0.21 | <0.0001 | 0.81 | 0.21 |
| OSI | 0–0.16 | 0.016± 0.031 | 0.0035±0.0044 | <0.0001 | 0.81 | 0.0036 |
| WSSG | −285–557 | −30.97±61.56 | −38.62±137.93 | 0.37 | 0.55 | −29.70 |
| NV | 0–4 | 1.77±0.75 | 1.27±0.67 | 0.0002 | 0.69 | 1.00 |
| RRT | 0.48–48 | 7.52±8.94 | 2.70±4.32 | <0.0001 | 0.79 | 2.70 |
Abbreviations: AR=aspect ratio, AUC=area under the curve, EI=ellipticity index, LSA=low wall shear stress area, MWSS=maximum intra-aneurysmal wall shear stress, NSI=nonsphericity index, NV=number of vortices, OSI=oscillatory shear index, RRT=relative residence time, SR=size ratio, UI=undulation index, WSS=wall shear stress, WSSG=wall shear stress gradient
To identify optimal thresholds for IA rupture, ROC analysis was performed for each parameter; AUC values are given in Table 2. SR, LSA, OSI, RRT, and WSS and had the highest AUC values (0.83, 0.81, 0.79, 0.79, and 0.78, respectively). Scatter plots and ROC curve for key parameters are showed in Figure 4.
Figure 4.
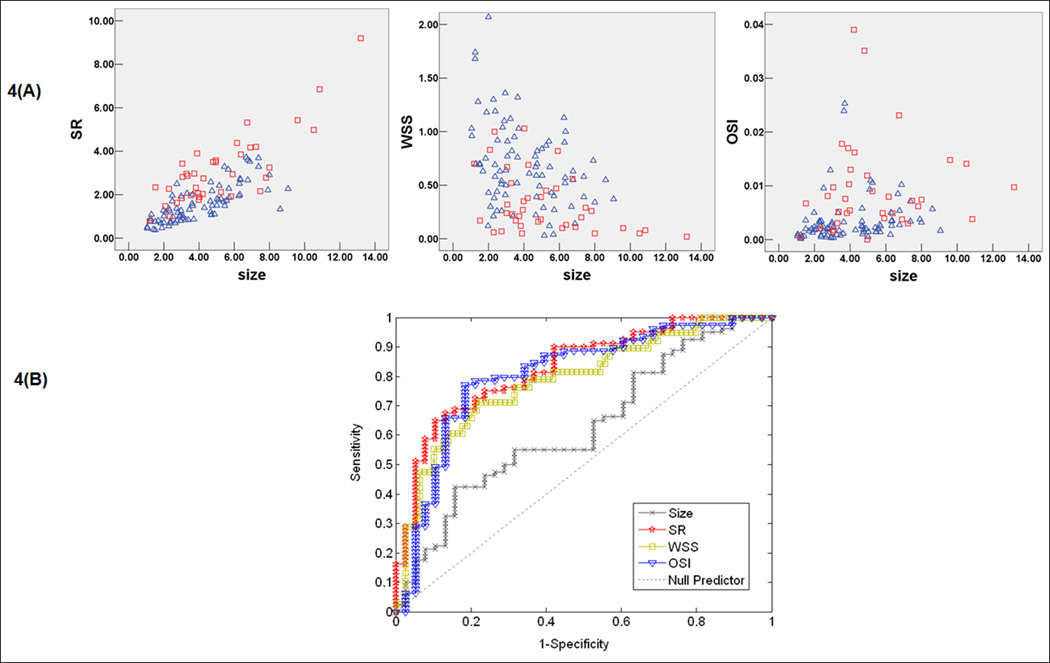
Scatter plots (A) showing the distribution of key parameters in unruptured and ruptured cases. Red square represents ruptured aneurysm data and blue triangle represents unruptured aneurysm data and receiver-operating characteristic (ROC) curve (B) for key parameters size ratio (SR), WSS, and OSI.
Multivariate logistic regression on the significant variables
To identify independent parameters having significant correlation with ruptured IA, multivariate logistic regression analysis was performed separately on significant morphological parameters–SR, UI, EI, and NSI–and significant hemodynamic parameters–WSS, MWSS, LSA, OSI, NV, and RRT and combined significant morphologic and hemodynamic parameters. Having regressed for the variables using a backward elimination process, we obtained the final parsimonious models for discriminating rupture status from the morphology-based model (OddM) and the hemodynamics-based model (OddH) as well as the combined model (OddCombined):
| (Eq.4) |
| (Eq.5) |
| (Eq.6) |
In the morphology-based model (Eq.4), only SR was retained as an independently significant parameter (AUC=0.83, 95% CI 0.75–0.91). For a unit increase in the SR of an IA, the odds of IA rupture increased by 2.96 times. In the hemodynamics-based model (Eq.5), both WSS and OSI were retained as independently significant parameters (AUC=0.85, 95% CI 0.78–0.93). For a unit increase in IA WSS, the rupture odds decreased by 2.08 times; for a unit increase in OSI, the rupture odds increased by 17.4 times. When the regression was performed on significant morphologic and hemodynamic parameters combined, using the same backward elimination process, the composite model, Eq.6, consisted of SR, WSS and OSI (AUC=0.89, 95% CI 0.82–0.96). The rupture odds increased by 2.08 and 8.90 times for a unit increases in SR and OSI, respectively, and decreased by 1.56 times for a unit increase in WSS. SR was inversely correlated with low WSS (with Pearson correlation coefficient of 0.001, R2 = −0.53).
When using a cutoff value of 0.5 for the predicted probability of rupture status, the morphological model had a sensitivity of 71.4% and a specificity of 80.2%; the hemodynamic model had 75.8% and 84.8%, respectively; and the combined model had 75.0% and 84.0%, respectively. There were no statistically significant differences among the AUC-ROC values of the predicted probability of rupture status by these logistic regression models (p=0.26 between morphological and combined models, p=0.63 between morphological and hemodynamic models, and p=0.53 between hemodynamic and combined models). In other words, all three models had very similar predictive capability for IA rupture status.
Discussion
Morphological Measures
Of all the morphological parameters examined in this study, Aneurysm Size and AR had the lowest AUC values (0.62 and 0.63, respectively) and were not significantly different between the ruptured and unruptured groups (both had p=0.027). SR had the largest AUC value (0.83) and the smallest p-value (p<0.0001), and therefore best separated the ruptured and unruptured groups among the morphologic parameters. NSI, UI, and EI were also significant morphologic parameters to separate the two groups by univariate analysis, with AUC values of 0.73, 0.72, and 0.71, respectively, corresponding with p<0.0001, p=0.0001, and p=0.0003, respectively. However, these parameters are cumbersome to calculate, as they all involve volume calculation.
In the multivariate analysis of morphological parameters, only SR significantly separated the two groups; all other morphological parameters lost their significance possibly due to inherent correlations with the SR. SR is a relatively simple measure that considers aneurysm maximum height in relation to the parent artery. Thus, SR captures the maximum shape deformation to the parent vessel caused by the outpouching of an aneurysm and intuitively reflects the degree of aneurysmal degradation to the vessel. IA location is a strong factor in clinical decision-making (e.g., IAs on the ACOM – a smaller artery – rupture far more frequently than IAs arising from the ICA).1, 2, 9, 18 Incorporating the parent vessel caliber in morphology parameters can, at least to some extent, capture the influence of IA location as well.
Hemodynamic Measures
Past studies to associate hemodynamics with aneurysm rupture status have focused on qualitative descriptions, wherein complex flow patterns and multiple vortices have been associated with ruptured aneurysms.3, 5 Complex flow patterns have been thought to increase inflammatory cell infiltration in the aneurysmal wall, thereby increasing rupture risk.3 In our study, most ruptured aneurysms (61%) had complex flow patterns with multiple vortices, whereas most unruptured aneurysms (75%) had simple flow patterns with a single vortex.
Our hemodynamic analysis, however, has focused on quantitative hemodynamic metrics that could be used to assess IA rupture risk in clinical settings. All of the analyzed parameters are based on well-characterized definitions and are straightforward to measure from CFD-generated flow fields. Furthermore, these parameters have underlying physical and biological implications. For example, NV (the number of vortices) was used to measure the complexity of the flow pattern. WSS, MWSS, WSSG, and OSI are well-known and well-defined hemodynamic factors related to endothelial sensing mediated vascular remodeling and pathology.3, 4, 14 LSA13 and RRT17 are recently emerged, additional hemodynamic factors to describe the slow flow motion near the aneurysm wall.
We found that the examined hemodynamic variables, except for WSSG, can significantly separate ruptured from unruptured aneurysms, with p<0.0001 and an AUC value approximating 0.8 for LSA, OSI, RRT, and WSS; and p=0.0002 and AUC value approximating 0.7 for MWSS and NV. Rupture status correlated with low WSS and MWSS values and high OSI, LSA, RRT, and NV numbers. In multivariate analysis of the significant hemodynamic parameters, only WSS and OSI remained as significant metrics correlating with ruptured aneurysms, whereas MWSS, LSA, NV, and RRT lost significance, likely due to inherent correlation of these parameters with WSS or OSI.
We can speculate how these parameters might be inherently correlated with WSS or OSI. Under conditions of complex aneurysmal flow with multiple vortices (a large NV value), the flow near the wall tends to be recirculating, slow, and oscillatory; thus, the average WSS and MWSS tend to be low and the oscillatory component (OSI) tends to be large. Likewise, the area exposed to low shear stress (LSA) is likely to be large, and fluid particles tend to spend a longer time (RRT) near the wall.
Wall shear stress, the frictional force of viscous blood, plays a role in aneurysm initiation, growth, and rupture.3, 4, 6, 13, 14 The WSS converts the biological signals through mechanoreceptor on endothelial cells and modulates gene expressions and the cellular functions of vessel walls.4 In vitro studies have found that when endothelial cells are exposed to low and oscillatory fluid shear stress, the atherogenic and pro-inflammatory signal pathways are activated.19, 20 In the current study, we have found that low WSS and high OSI correlate with aneurysm rupture, consistent with findings from Jou et al.,13 Shojima et al.,4 and Boussel et al.6 Low WSS and high OSI are known to upregulate endothelial surface adhesion molecules, cause dysfunction of flow-induced nitrous oxide, increase endothelial permeability, and thus, promote atherogenesis and inflammatory cell infiltration.21 This atherosclerotic and inflammatory pathway triggered by these hemodynamic conditions may cause degradation of the aneurysm wall that could ultimately lead to rupture.3, 4, 21
Our dataset in this study includes 49 terminal aneurysms, and in some of these cases, we have observed impingement of a flow-jet from the neck into the aneurysm during flow visualization. We did not perform statistics on flow patterns and size of impingement5 because in such highly complex 3D flows flow fields, we found it difficult to decide on the impingement path, location, and size, both objectively and reproducibly. We did, however, analyze MWSS.22 We found that the ruptured group had lower MWSS than the unruptured group, and the difference was significant (p <0.0001) with a clinically useful AUC value (0.72); however, in multivariate analysis, MWSS dropped out.
Our findings are different from those from a previous study of 42 terminal IAs in which the average peak WSS in the ruptured group (188 dyn/cm2) was higher than the value in unruptured group (118 dyn/cm2).22 To examine whether terminal (bifurcation) aneurysms could have skewed the results, we ran the statistical analysis on only the 49 terminal aneurysms (24 ruptured and 25 unruptured) from our cohort. Our results showed that ruptured aneurysms still have lower MWSS (2.15±2.18) than unruptured aneurysms (3.36±1.56), and the difference is significant (p=0.001) with a high AUC value of 0.77. These findings need to be tested in much larger cohorts in the future. We believe that high WSS/MWSS with flow impingement could evoke a different pathway to wall degradation than low-WSS-mediated inflammation and atherosclerotic pathways and thus should be explored for its association with rupture.
Relationship between Morphological and Hemodynamic Parameters
Even though they are analyzed by different modalities (3D angiography and CFD, respectively), aneurysm morphology and flow dynamics are intricately related to each other. Low WSS and high OSI—the flow characteristics significantly associated with rupture status in this study—are common in aneurysms of complex or elongated shapes described by large SR, AR, EI, and UI values, These morphological features have been shown in association with growth6 and rupture.9 Using a virtual computational experiment, Tremmel et al.23 have demonstrated that, with increasing SR, aneurysmal flow pattern becomes more complex and the area of low WSS increases. Furthermore, as the SR value exceeds 2, the single aneurysmal vortex splits into multiple vortices and LSA increases drastically in both sidewall and terminal aneurysm models. This trend is consistent with our current data, where SR was inversely correlated with WSS (Pearson correlation coefficient of 0.001), albeit the correlation was weak (R2 =−0.53).
On the basis of the demonstrated conceptual correlation between high SR and low WSS, we had conjectured that multivariate logistic regression of SR, WSS and OSI together might eliminate either SR or one of the hemodynamic factors. However, ultimately, all remained in the combined model. All three models had high AUC value of 0.83–0.89 in discriminating rupture status (AUC >0.7 is considered clinically significant). There was considerable overlap between the 95% CIs of the three models, and differences among the predicted probability from these models were not statistically significant.
The similarity of the three models suggests that the relationship between morphology and hemodynamics may be complex, interwoven, and dynamic. From an aneurysm evolution point-of-view, we can at least appreciate the mutually contributive roles of “unfavorable” aneurysm morphology and “unfavorable” aneurysm hemodynamics. Hemodynamics of low WSS–high OSI is conducive for atherosclerotic change and inflammatory responses, which could drive heterogeneous remodeling of the aneurysm wall and aneurysm growth. Such growth could lead to an increasing SR and a more complex shape. Complex geometry and high SR values, in turn, would lead to more complex flow patterns with low and oscillatory WSS.9, 23
Given that many factors may be playing a role in aneurysm growth, remodeling, degradation, and rupture, it is remarkable that one (SR) or two (WSS and OSI) simple markers based on geometry or hemodynamics could be such significant discriminants (with sensitivity of 71.4% and specificity of 80.2% for the morphologic model, 75.8% and 84.8% for hemodynamic model when using 0.5 cutoff for the predicted probability). In future studies, it is important to include both morphology and hemodynamics parameters and test them in larger cohorts. There is also a need for studies that identify the interrelationships between morphology and hemodynamic parameters and the mechanistic pathways by which these surrogates contribute to aneurysm rupture.
Limitations of This Study
First, all the IA cases came from a single center and the number of cases is small (although it is currently the largest for a CFD study). Further three-dimensional studies with larger IA populations from multiple centers will be required to verify the findings. Second, as with all retrospective studies, the images of the ruptured IAs may have been affected by the event of the rupture itself. Although there is no study that examines whether the shape of an aneurysm changes after rupture, there is a theoretical possibility that this could bias our results. Third, the morphologic parameters could be affected by the imaging methods. Fourth, all morphologic parameters were calculated from 3D angiograms that give essentially a luminogram and do not account for thrombus. Correlation with high-resolution CTA or magnetic resonance angiography could have eliminated this deficit, but we did not routinely perform CTA or magnetic resonance angiograms on our aneurysm patients. Fifth, more than 50% (21/38) of the ruptured IAs in the current cohort were ACOM aneurysms and more than 50% (43/81) of the unruptured IAs were found in ICA aneurysms. Although this represents the typical distribution of ruptured and unruptured aneurysms treated at a hospital, it could have caused a bias in the results. Our numbers were not large enough to conduct an analysis by location, and such an analysis may require pooling of data from multiple centers.
There are several limitations related to CFD. Patient-specific flow-velocity measurements were not available. Instead, velocity values for specific vessels that were available in the literature were chosen for flow-rate calculations, and a representative inlet velocity waveform from a normal subject was used as boundary condition for CFD simulations. Traction-free boundary conditions were implemented at the outlet in the current study, and the flow-rate splits proportional to the cube of the diameter were specified at each outlet.11 As assumptions for outlet boundary conditions vary among different investigators performing CFD,13, 22, 24 outlet boundary condition assumptions need to be further studied and standardized in the future to make the results of these studies comparable. Another limitation is that the choice of 10% of parent artery WSS as a threshold for low WSS was arbitrary, although supported in the literature4, 13, 21. If a different value (e.g., 20%) had been chosen, LSA would have different values, but the qualitative trend would be the same. Another current limitation of CFD is the substantial time and personnel required to perform a CFD analysis, which makes it an impractical option for decision-making in the clinical setting.
Although CFD has these multiple limitations at present and has not been shown to significantly outperform morphology in rupture status discrimination, we should understand that CFD technology is in its infancy for prediction of aneurysm rupture risk and is poised to advance continuously. Multiple research groups in the academic environment and in the industry are trying to automate and accelerate the process of CFD analysis to determine aneurysm rupture risk. These efforts may standardize CFD for prediction of rupture risk and may make it a practical option for decision-making in the clinical setting. Moreover, detailed flow dynamics from CFD is helpful to understanding the rupture mechanisms and thus can help clinicians to choose optimal treatments for patients.
Conclusion
All three models—morphological (based on SR), hemodynamic (based on WSS and OSI), and combined (based on all three parameters)—are clinically useful discriminants of IA rupture status with high AUC values (between 0.83 and 0.89), and there is no significant distinction among the predictive capacities of these models. This shows that hemodynamics is as important as morphology in association with IA rupture. The relative contributions of morphology and hemodynamics, their possible correlation, and the ability of these markers to predict rupture risk need to be assessed in large prospective studies that include follow up of patients with unruptured aneurysms.
Acknowledgments
We thank Paul H. Dressel BFA for preparation of the illustrations and Debra J. Zimmer, AAS CMA-A, for editorial assistance. We also gratefully acknowledge Dongliang Wang MS for his helpful discussions on statistical analysis and John Kolega PhD for his discussion on the manuscript.
Funding
NIH Grant-R01NS064592 (Meng, Siddiqui).
Abbreviations used
- 3D
three-dimensional
- ACA
anterior cerebral artery
- ACOM
anterior communicating artery
- AR
aspect ratio
- AUC-ROC
area under the receiver-operating-characteristic curve
- BA
basilar artery
- CFD
computational fluid dynamics
- CI
confidence interval
- CTA
computed tomography angiography
- DSA
digital subtraction angiography
- EI
ellipticity index
- IA
intracranial aneurysm
- ICA
internal carotid artery
- LSA
low wall shear stress area
- MCA
middle cerebral artery
- MWSS
maximum intra-aneurysmal wall shear stress
- NSI
nonsphericity index
- NV
number of vortices
- OSI
oscillatory shear index
- PCA
posterior cerebral artery
- PCOM
posterior communicating artery
- PICA
posterior inferior cerebellar artery
- ROC
receiver-operating characteristic
- RRT
relative residence time
- SR
size ratio
- UI
undulation index
- VA
vertebral artery
- WSS
wall shear stress
- WSSG
wall shear stress gradient
Potential Conflicts of Interest/Disclosure of Financial Relationships
Hopkins: research study grants from Abbott (ACT 1 Choice), Boston Scientific (CABANA), Cordis (SAPPHIRE WW), and ev3/Covidien Vascular Therapies (CREATE); research grant from Toshiba (for the Toshiba Stroke Research Center); ownership/financial interest in AccessClosure, Boston Scientific, Cordis, Micrus, and Valor Medical; Abbott Vascular speakers’ bureau; honoraria from Bard, Boston Scientific, Cordis, and from the following for speaking at conferences – Complete Conference Management, Cleveland Clinic, and SCAI; receives royalties from Cordis (for the AngioGuard device), consultant to or on the advisory board for Abbott, AccessClosure, Bard, Boston Scientific, Cordis, Gore, Lumen Biomedical, Micrus, and Toshiba; and conference director for Nurcon Conferences/Strategic Medical Seminars LLC.
Levy: research grant support (principal investigator: Stent-Assisted Recanalization in acute Ischemic Stroke, SARIS), other research support (devices), and honoraria from Boston Scientific and research support from Micrus Endovascular and ev3/Covidien Vascular Therapies; ownership interests in Intratech Medical Ltd. and Mynx/Access Closure; consultant on the board of Scientific Advisors to Codman & Shurtleff, Inc.; consultant per project and/or per hour for Micrus Endovascular, ev3/Covidien Vascular Therapies, and TheraSyn Sensors, Inc.; and receives fees for carotid stent training from Abbott Vascular and ev3/Covidien Vascular Therapies. (No consulting salary arrangements. All consulting is per project and/or per hour.)
Meng: principal investigator of the aforementioned NIH grant; also, grant support from the UB Interdisciplinary Research Development Fund.
Mocco: consultant to Actelion, Nfocus, and Lazarus Effect. The University of Florida- Gainesville (his employer) receives research funding from AccessClosure and Codman & Shurtleff, Inc.
Natarajan: recipient of the 2010–2011 Cushing Award of the Congress of Neurological Surgeons.
Siddiqui: research grants from the University at Buffalo and from the National Institutes of Health (co-principal investigator: NINDS 1R01NS064592-01A1, Hemodynamic induction of pathologic remodeling leading to intracranial aneurysms); consultant to Codman & Shurtleff, Inc., Concentric Medical, ev3/Covidien Vascular Therapies, and Micrus Endovascular; speakers’ bureaus for Codman & Shurtleff, Inc. and Genentech; and received honoraria from Genentech, Neocure Group LLC, American Association of Neurological Surgeons’ courses, an Emergency Medicine Conference, Abbott Vascular for training other neurointerventionists, and from Codman & Shurtleff, Inc. for training other neurointerventionists. (No consulting salary arrangements. All consulting is per project and/or per hour.)
Ma, Tremmel, Xiang: no potential conflict of interest/financial relationships to disclose.
Footnotes
Publisher's Disclaimer: This is a PDF file of an unedited manuscript that has been accepted for publication. As a service to our customers we are providing this early version of the manuscript. The manuscript will undergo copyediting, typesetting, and review of the resulting proof before it is published in its final citable form. Please note that during the production process errors may be discovered which could affect the content, and all legal disclaimers that apply to the journal pertain.
Author Contributions
Conceived and designed the research: Levy, Meng, Mocco, Tremmel, Xiang
Clinical correlation: Hopkins, Levy, Siddiqui
Acquired the data: Mocco, Natarajan, Tremmel, Xiang
Analyzed and interpreted the data: Meng, Mocco, Natarajan, Tremmel, Xiang
Performed statistical analysis: Natarajan, Xiang
Handled funding and supervision: Meng
Drafted the manuscript: Meng, Mocco, Natarajan, Tremmel, Xiang
Made critical revision of the manuscript for important intellectual content: All authors
References
- 1.Raghavan ML, Ma B, Harbaugh RE. Quantified aneurysm shape and rupture risk. J Neurosurg. 2005;102:355–362. doi: 10.3171/jns.2005.102.2.0355. [DOI] [PubMed] [Google Scholar]
- 2.Forget TR, Jr, Benitez R, Veznedaroglu E, Sharan A, Mitchell W, Silva M, Rosenwasser RH. A review of size and location of ruptured intracranial aneurysms. Neurosurgery. 2001;49:1322–1326. doi: 10.1097/00006123-200112000-00006. [DOI] [PubMed] [Google Scholar]
- 3.Ujiie H, Tamano Y, Sasaki K, Hori T. Is the aspect ratio a reliable index for predicting the rupture of a saccular aneurysm? Neurosurgery. 2001;48:495–503. doi: 10.1097/00006123-200103000-00007. [DOI] [PubMed] [Google Scholar]
- 4.Shojima M, Oshima M, Takagi K, Torii R, Hayakawa M, Katada K, Morita A, Kirino T. Magnitude and role of wall shear stress on cerebral aneurysm: computational fluid dynamic study of 20 middle cerebral artery aneurysms. Stroke. 2004;35:2500–2505. doi: 10.1161/01.STR.0000144648.89172.0f. [DOI] [PubMed] [Google Scholar]
- 5.Cebral JR, Castro MA, Burgess JE, Pergolizzi RS, Sheridan MJ, Putman CM. Characterization of cerebral aneurysms for assessing risk of rupture by using patient-specific computational hemodynamics models. AJNR Am J Neuroradiol. 2005;26:2550–2559. [PMC free article] [PubMed] [Google Scholar]
- 6.Boussel L, Rayz V, McCulloch C, Martin A, Acevedo-Bolton G, Lawton M, Higashida R, Smith WS, Young WL, Saloner D. Aneurysm growth occurs at region of low wall shear stress: patient-specific correlation of hemodynamics and growth in a longitudinal study. Stroke. 2008;39:2997–3002. doi: 10.1161/STROKEAHA.108.521617. [DOI] [PMC free article] [PubMed] [Google Scholar]
- 7.Hoi Y, Meng H, Woodward SH, Bendok BR, Hanel RA, Guterman LR, Hopkins LN. Effects of arterial geometry on aneurysm growth: three-dimensional computational fluid dynamics study. J Neurosurg. 2004;101:676–681. doi: 10.3171/jns.2004.101.4.0676. [DOI] [PubMed] [Google Scholar]
- 8.Steinman DA. Image-based computational fluid dynamics modeling in realistic arterial geometries. Ann Biomed Eng. 2002;30:483–497. doi: 10.1114/1.1467679. [DOI] [PubMed] [Google Scholar]
- 9.Dhar S, Tremmel M, Mocco J, Kim M, Yamamoto J, Siddiqui AH, Hopkins LN, Meng H. Morphology parameters for intracranial aneurysm rupture risk assessment. Neurosurgery. 2008;63:185–197. doi: 10.1227/01.NEU.0000316847.64140.81. [DOI] [PMC free article] [PubMed] [Google Scholar]
- 10.Fahrig R, Nikolov H, Fox AJ, Holdsworth DW. A three-dimensional cerebrovascular flow phantom. Med Phys. 1999;26:1589–1599. doi: 10.1118/1.598672. [DOI] [PubMed] [Google Scholar]
- 11.Oka S, Nakai M. Optimality principle in vascular bifurcation. Biorheology. 1987;24:737–751. doi: 10.3233/bir-1987-24624. [DOI] [PubMed] [Google Scholar]
- 12.Perktold K, Peter R, Resch M. Pulsatile non-Newtonian blood flow simulation through a bifurcation with an aneurysm. Biorheology. 1989;26:1011–1030. doi: 10.3233/bir-1989-26605. [DOI] [PubMed] [Google Scholar]
- 13.Jou LD, Lee DH, Morsi H, Mawad ME. Wall shear stress on ruptured and unruptured intracranial aneurysms at the internal carotid artery. AJNR Am J Neuroradiol. 2008;29:1761–1767. doi: 10.3174/ajnr.A1180. [DOI] [PMC free article] [PubMed] [Google Scholar]
- 14.Meng H, Wang Z, Hoi Y, Gao L, Metaxa E, Swartz DD, Kolega J. Complex hemodynamics at the apex of an arterial bifurcation induces vascular remodeling resembling cerebral aneurysm initiation. Stroke. 2007;38:1924–1931. doi: 10.1161/STROKEAHA.106.481234. [DOI] [PMC free article] [PubMed] [Google Scholar]
- 15.He X, Ku DN. Pulsatile flow in the human left coronary artery bifurcation: average conditions. J Biomech Eng. 1996;118:74–82. doi: 10.1115/1.2795948. [DOI] [PubMed] [Google Scholar]
- 16.Himburg HA, Grzybowski DM, Hazel AL, LaMack JA, Li XM, Friedman MH. Spatial comparison between wall shear stress measures and porcine arterial endothelial permeability. Am J Physiol Heart Circ Physiol. 2004;286:H1916–H1922. doi: 10.1152/ajpheart.00897.2003. [DOI] [PubMed] [Google Scholar]
- 17.Lee SW, Antiga L, Steinman DA. Correlations among indicators of disturbed flow at the normal carotid bifurcation. J Biomech Eng. 2009;131:061013. doi: 10.1115/1.3127252. [DOI] [PubMed] [Google Scholar]
- 18.Rahman M, Smietana J, Hauck E, Hoh B, Hopkins N, Siddiqui A, Levy EI, Meng H, Mocco JD. Size ratio correlates with intracranial aneurysm rupture status. A prospective study. Stroke. 2010;41:916–920. doi: 10.1161/STROKEAHA.109.574244. [DOI] [PubMed] [Google Scholar]
- 19.Chiu JJ, Chen CN, Lee PL, Yang CT, Chuang HS, Chien S, Usami S. Analysis of the effect of disturbed flow on monocytic adhesion to endothelial cells. J Biomech. 2003;36:1883–1895. doi: 10.1016/s0021-9290(03)00210-0. [DOI] [PubMed] [Google Scholar]
- 20.Passerini AG, Polacek DC, Shi C, Francesco NM, Manduchi E, Grant GR, Pritchard WF, Powell S, Chang GY, Stoeckert CJ, Jr, Davies PF. Coexisting proinflammatory and antioxidative endothelial transcription profiles in a disturbed flow region of the adult porcine aorta. Proc Natl Acad Sci U S A. 2004;101:2482–2487. doi: 10.1073/pnas.0305938101. [DOI] [PMC free article] [PubMed] [Google Scholar]
- 21.Malek AM, Alper SL, Izumo S. Hemodynamic shear stress and its role in atherosclerosis. JAMA. 1999;282:2035–2042. doi: 10.1001/jama.282.21.2035. [DOI] [PubMed] [Google Scholar]
- 22.Castro M, Putman C, Radaelli A, Frangi A, Cebral J. Hemodynamics and rupture of terminal cerebral aneurysms. Acad Radiol. 2009;16:1201–1207. doi: 10.1016/j.acra.2009.03.022. [DOI] [PubMed] [Google Scholar]
- 23.Tremmel M, Dhar S, Levy EI, Mocco J, Meng H. Influence of intracranial aneurysm-to-parent vessel size ratio on hemodynamics and implication for rupture: results from a virtual experimental study. Neurosurgery. 2009;64:622–631. doi: 10.1227/01.NEU.0000341529.11231.69. [DOI] [PMC free article] [PubMed] [Google Scholar]
- 24.Castro MA, Putman CM, Sheridan MJ, Cebral JR. Hemodynamic patterns of anterior communicating artery aneurysms: a possible association with rupture. AJNR Am J Neuroradiol. 2009;30:297–302. doi: 10.3174/ajnr.A1323. [DOI] [PMC free article] [PubMed] [Google Scholar]