Abstract
The Asymmetric Vascular Stent (AVS) for intracranial aneurysm (IA) treatment is an experimental device, specially designed for intra-aneurysmal blood flow diversion and thrombosis promotion. The stent has a low-porous patch to cover only the aneurysm neck while the rest of the stent is very porous to avoid blockage of adjacent branches. The latest AVS design is similar to state-of-art, closed-cell, self-expanding, neurovascular stent. The stents were used to treat sixteen rabbit-elastase aneurysm models. The treatment effect was analyzed using normalized-time-density-curves (NTDC) measured by pixel-value integration over a region-of-interest containing the aneurysm. Normalization constant was the total bolus injection determined angiographically. Based on NTDC measurement, five quantities were derived to describe the contrast flow. Two are related to the amount of contrast entering the aneurysm: NTDC peak and NTDC input slope. The other three are related to contrast presence in the aneurysmal dome: time-to-peak (TTP), wash-out-time (WOT) and mean-transit-time (MTT). Flow modification descriptions using the contrast related quantities were expressed as a pre-/post-stented NTDC parameter ratio, while the time related quantities were expressed as a post-/pre-stented ratio, so that ratios smaller than one indicate a desired effect. Thirteen aneurysms were treated successfully and achieved significant aneurysm occlusion. For these cases, the resulting average parameters were: peak-ratio=0.17±0.21; input-slope-ratio=0.19±0.24, TTP-ratio=0.17±0.21, WOT-ratio=0.58±0.73 and MTT-ratio=0.65±0.97). All the quantities revealed decreased aneurysmal flow due to blood flow diversion using the new self-expanding asymmetrical vascular stent (SAVS). Treatment outcome results and angiographic analysis indicate that the new self-deploying stent design has great potential for clinical implementation.
Keywords: Self-expanding asymmetric vascular stents, Digital Subtracted Angiography, Time Density Curves, aneurysms, image analysis of flow
INTRODUCTION
The Asymmetric Vascular Stent (AVS)1–8 is one of the few aneurysm hemodynamics modifying devices, currently being investigated in in-vivo animal trials. The device has a very dense region supported by a very porous, neurovascular stent-like structure. The dense area is intended only for aneurysm orifice coverage. Keeping the rest of the stent porous is meant to maintain a low probability for nearby small branch blockage.
The AVS design underwent several changes to satisfy the multiple constraints imposed by intra-cranial endovascular image guided procedures. The transition was from a rigid balloon deployable stainless-steel AVS to a self-expanding Nitinol stent. As our group has pointed out in previous published work6, balloon-deployable stents are not suitable for placement in remote areas of brain vasculature. The stent-balloon system is too rigid and could cause severe injuries to vessel walls. Also, the balloon folding used during stent crimping can cause stent rotation during deployment.6 The new type of self-expanding stent that our group has developed removes many of the issues associated with balloon deployable stents.
The most used method to assess in-vivo aneurysmal hemodynamics modification following treatment remains digital subtracted angiography (DSA) analysis7,9–11. The flow of iodine contrast, intra-arterially injected, is monitored before and after treatment. Treatment outcome predictions are then made based on the observed differences. Contrast time-density curves (TDC) derived from video-densitometric measurements of the aneurysmal contrast filling are used to assess the flow modifications.
Current work uses a special method6 to derive time density curves normalized to the bolus injection, which is also derived from the DSA runs. The new normalized time density curves (NTDC’s) are later used to derive a set of parameters used to characterize the contrast flow modification in in-vivo aneurysms using the novel SAVS’s.
MATERIALS AND METHODS
Self-expanding closed-cell Asymmetric Vascular Stents
Two asymmetric stent types were used in this study; the first stent, Type A, was made by adding a low porous section across the entire stent circumference, equidistant from the stent ends (Figure 1A). The second type, Type B, had the patch offset and coverage only on one side of the stent (Figure 1B). The first stent requires precision of placement only in the transverse direction with regard to the aneurysm orifice and needs only two markers. The second type requires both transversal and azymuthal placement precision and requires four markers1. We envisage usage of the first kind of stent when no perforators are present in the area opposite to the aneurysm neck, while the second type is to be used when the treatment region has perforators surrounding the aneurysm neck.
Figure 1.

Closed-cell self-deploying Asymmetric Vascular Stent, SAVS. Arrows show the location of markers on the periphery of the patch.
The surgical procedure was performed by accessing the femoral artery using a 5.0 Fr introducer. A 4.0 Fr straight catheter was advanced to the aortic arch and a high speed (15 fps) angiogram was acquired. Using the angiographic run a vasculature map was created and used during fluoroscopic roadmap guidance. A high support 14 mills guide wire was advanced to the subclavian artery, past the aneurysm and deep into the brachial artery; the 4 Fr catheter was removed and a catheter containing the asymmetric stent was advanced to the location of the aneurysm. In the beginning of the study we used 5 Fr catheters. As the design of the stent improved we were able to use smaller 3.5 Fr catheters. At this point of the intervention, we brought a high resolution microangiographic detector13 into the field of view, to increase stent guidance and placement accuracy. A high resolution road map was acquired, and then the stent containing catheter was advanced over the aneurysm neck; using the markers on the patch as references, the catheter position was adjusted until the patch faced the aneurysm neck. Then a pusher was propped against the stent and the outer stent-containing catheter was pulled back, until the stent was completely relieved from the catheter. After deployment an angiogram was acquired in conditions similar to the pre-stented acquisition.
Aneurysm creation
Procedures were approved and conducted according to the Institutional Animal Care and Use Committee of the State University of New York at Buffalo and guidelines established by the animal welfare act. Sixteen New Zealand White rabbits (3.5 ± .75 kg; 3–4 kg; mean ± STD, range) underwent right carotid aneurysm creation. Following three weeks of aneurysm maturation, the subjects underwent angiographic evaluation and treatment.
SAVS prototype description and stent deployment procedure
The new stent is made from superelastic Nickel-Titanium (Nitinol) which enables it to be self-expanding. A computer model similar to current self-deployable neurovascular stents was designed using solid modeling software. The computer model was sent to a laser machine shop (Laserage Technology Corporation, Waukegan, IL) and the model was cut from Nitinol tubing (NI-TI Tubes LLC, Fremont, CA). The stents were cut to a nominal diameter of 2.5 mm. Later they were expanded to 4 mm diameter by placing them on glass rods in an oven set at 525 degrees C, and then dipped in an ice-water bath. Next, the stents were chemically processed and electro-polished using chemical solutions provided by (RD Chemical, Mountain View, CA). Finally, a low porosity PTFE (Millipore, Billerica, MA) material and the platinum markers were attached onto the stent (Figure 1). Platinum markers label the patch allowing accurate placement of the patch over the aneurysm neck. Once crimped, SAVS’s have average diameter of 1.0 mm.
Angiographic Analysis
Calculations and quantities used to derive the NTDC for the aneurysms are indicated in Figure 2. Total amount of contrast material entering the aneurysm ROI can be represented by integrating over the entire ROI as a function of time, t, for each frame,
Figure 2.
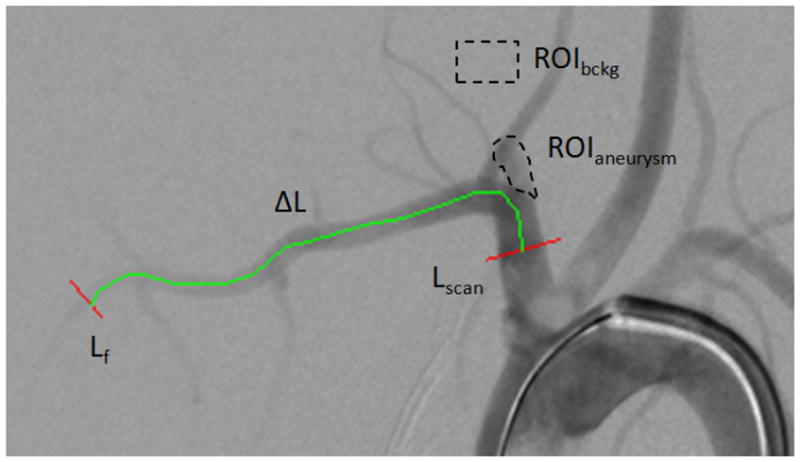
DSA snapshot of an elastase model aneurysm. ROIaneurysm is the area were the contrast integral is calculated ROIbckg where the average background pixel is evaluated, Lscan and Lf represent reference line profiles taken across the main artery, and are used for the bolus velocity derivation, ΔL is the vessel length between the two reference line.
| (1) |
where PIROI represents the individual pixel intensity in the ROIaneurysm, Bckg is the average background value measured in ROIBckg, and the double integral indicates summation of all the pixels contained in the ROI area.
The normalization constant, N, is equal to the total mass of material passing through a vessel cross-section integrated over the entire run, multiplied by the velocity:
| (2) |
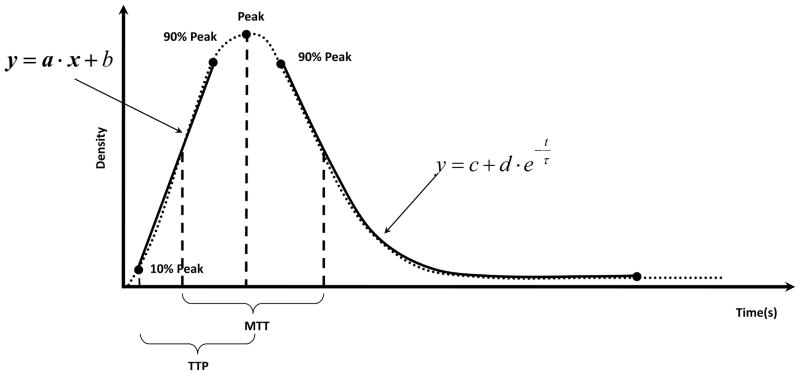
For each frame, we numerically integrate along the line Lscan in Fig. 2, the difference between the background and the individual pixels PILine and over time (entire sequence) to obtain the contrast passing though the vessel. Vbolus is the velocity of the bolus, which is obtained by dividing the vessel path-length, ΔL, between locations Lscan and Lf, by the transit time, Ttransit, of the bolus between the two points indicated in Figure 2 using a bolus-peak tracking method.6 For each line profile (i.e. initial and final), we generated a time density curves similar to the one depicted in Figure 3. The rising part of the curve (leading edge) was fitted with a linear equation. The points taken for the fit were from 90% down to 10% of the peak so as to avoid errors from the background noise and the saturation-like curvature in the vicinity of the peak. The time corresponding to the midpoint of the line fit was taken as the bolus arrival reference time. The transit time was further found as the difference of the two bolus arrival times thus calculated. The transit time thus found was used to calculate a bolus velocity expressed in pixels per second:
| (3) |
Figure 3.
General time density curve based on angiographic run. The parameters measured in this study are indicated on the figure: the peak, input slope, wash-out dump coefficient (WOT) denoted with τ in the above equation, Time-to Peak TTP and Mean transit Time MTT.
The normalized TDC’s were further used to calculate specific parameters: NTDC peak of the contrast density (CD), slope of the input measured in normalized contrast density units per second (CD/s), time to peak TTP10,11(seconds), mean transit time MTT10(seconds) and wash-out time WOT (seconds) denoted as τ in Figure 3. TTP was measured as the time interval between 10% of the peak and the actual peak. MTT was measured as the difference between the times corresponding to the midpoints on the falling and rising regions of the NTDC taken on an interval 0.1 to 0.9 of the peak. WOT was found by fitting the trailing tail of the NTDC with the equation displayed in Figure 3. The results are further presented in terms of pre-stented compared to post-stented quantities.
The input slope is related to the contrast filling rate of the aneurysm dome, the bolus injection velocity and vascular geometry. The peak value is a measure of the amount of contrast entering the aneurysm, and also is correlated to the amount of flow directed at the aneurysm neck. The WOT of the TDC tail is also associated with the flow inside the aneurysm dome. Time to peak is closely interconnected with the NTDC input slope; however, it is independent of the evaluation of the contrast amount entering the aneurysm dome. Finally, the mean time of residence is an indicator of time interval the contrast resides in the aneurysm dome and in a way includes both the information from the wash-out coefficient and the time to peak.
The contrast flow modifications were quantified in terms of pre- and post-stented ratios. The relative quantities directly related to the contrast entering the aneurysm dome such as the ratio of peaks and input slopes expressed as pre-stented/post-stented while the quantities related exclusively to time are expressed as post-stented/pre-stented so that each ratio is expected to be less than 1 (one) if the SAVS treatment is achieving the desired effect. The primary reason for this convention is that, less contrast is expected to enter the aneurysms after treatment, hence the maximum measured contrast in the aneurysm and the entrance rate will be expected to decrease. As far as the time related quantities are concerned, we would expect that once the contrast enters the aneurysm, the inflow, residence and washout time should increase significantly after treatment. In addition, we will try to establish a threshold value such that if the ratios are below such a value, than satisfactory occlusion of the aneurysm should have been observed.
The follow-up angiogram was used to generate an occlusion or “healing” grade, based on a five grade scale. Five was assigned to the aneurysms showing no contrast flow in the aneurysm dome, four for aneurysm that were almost thrombosed but exhibiting some remnant neck, three was given to the aneurysm with more than 75% occlusion when compared to the pre-stented run, two for over 50% occlusion, one for 25% or more, and zero was given if the aneurysm was intact at the follow-up.
RESULTS
Sixteen aneurysms were treated with the new closed cell SAVS and all the aneurysm were followed in a three step evaluation: pre-stented, post stented and follow-up. The first nine aneurysms were treated with SAVS type A and the remaining were treated with type B. Treatment was succesfull in 13 aneurysms. By succesful we mean that at the follow-up there was more than 75% aneurysm occlusion. Case specific results are sumarized in Table 1 for data before treatment and after stent placement, and Table 2 where post- versus pre-stented data is presented.
Table 1.
Pre and Post-Stented Measurements, (*) do not include the totally occlude aneurysms in the calculations.
| Case # | Pre-Stented | Post-Stented | ||||||||
|---|---|---|---|---|---|---|---|---|---|---|
| Slope (CD/s) | WOT (s) | MTT (s) | TTP (s) | Peak (CD%) | Slope (CD/s) | WOT (s) | MTT (s) | TTP (s) | Peak (CD%) | |
| 1 | 2.20 | 1.00 | 1.5 | 0.67 | 2.21 | 1.77 | 0.79 | 2.832 | 0.17 | 0.59 |
| 2 | 10.08 | 1.98 | 1.33 | 0.33 | 4.32 | 0 | N/A | N/A | N/A | 0 |
| 3 | 2.19 | 0.39 | 0.83 | 0.50 | 0.68 | 3.65 | 1.69 | 2.33 | 0.83 | 3.14 |
| 4 | 2.75 | 0.74 | 1.4 | 0.8 | 2.71 | 0 | N/A | N/A | N/A | 0 |
| 5 | 4.53 | 0.62 | 1.5 | 0.40 | 3.42 | 0 | N/A | N/A | N/A | 0 |
| 6 | 0.82 | 0.50 | 1.54 | 0.73 | 0.89 | 0 | N/A | N/A | N/A | 0 |
| 7 | 10.90 | 0.98 | 1.07 | 0.33 | 5.49 | 2.69 | 0.62 | 1.33 | 0.667 | 2.72 |
| 8 | 2.95 | 1.22 | 1.60 | 0.47 | 1.85 | 0.27 | 0.99 | 2.14 | 0.67 | 0.24 |
| 9 | 3.76 | 0.92 | 1.13 | 0.40 | 2.50 | 0 | N/A | N/A | N/A | 0 |
| 10 | 0.28 | 0.78 | 1.67 | 0.33 | 0.24 | 0.09 | 0.34 | 0.47 | 0.2 | 0.02 |
| 11 | 0.94 | 1.03 | 0.73 | 0.4 | 0.40 | 0 | N/A | N/A | N/A | 0 |
| 12 | 7.13 | 0.52 | 0.87 | 0.47 | 3.44 | 0.89 | 0.74 | 0.67 | 0.33 | 0.33 |
| 13 | 3.72 | 0.45 | 0.93 | 0.4 | 1.53 | 2.73 | 1.36 | 1.2 | 0.73 | 2.70 |
| 14 | 10.05 | 0.93 | 1.00 | 0.33 | 5.25 | 3.81 | 1.22 | 1.20 | 0.6 | 2.40 |
| 15 | 8.62 | 0.66 | 0.73 | 0.2 | 1.82 | 1.85 | 1.69 | 1.13 | 0.33 | 0.69 |
| 16 | 3.60 | 0.72 | 1.19 | 0.45 | 1.83 | 0.67 | 1.35 | 1.48 | 0.5 | 0.55 |
| 4.66±3.6 | 0.84±0.38 | 1.19±0.32 | 0.45±0.16 | 2.41±1.62 | 1.15±1.4 | 1.03±0.41* | 1.48±0.74* | 0.5±0.23* | 0.84±1.17 | |
Table 2.
Relative NTDC parameters measurements. The aneurysms in the first group are highlighted in grey, Healing grade: 5 (five) no contrast flow in the aneurysm dome, 4 (four) mostly occluded exhibiting some remnant neck, 3 (three)- more than 75% occlusion, 2 (two) for over 50% occlusion and 1 (one) occluded 25% or more, 0 (zero) intact aneurysm.
| Case # | Post-stented/Pre-stented |
|||||
|---|---|---|---|---|---|---|
| Slope (CD/s) | WOT (s) | MTT (s) | TTP (s) | Peak (CD) | Healing Grade | |
| 1 | 0.81 | 1.27 | 0.53 | 3.99 | 0.27 | 5 |
| 2 | 0 | 0 | 0 | 0 | 0 | 5 |
| 3 | 1.67 | 0.23 | 0.36 | 0.60 | 4.65 | 1 |
| 4 | 0 | 0 | 0 | 0 | 0 | 5 |
| 5 | 0 | 0 | 0 | 0 | 0 | 5 |
| 6 | 0 | 0 | 0 | 0 | 0 | 5 |
| 7 | 0.25 | 1.59 | 0.80 | 0.50 | 0.49 | 2 |
| 8 | 0.09 | 1.24 | 0.75 | 0.70 | 0.13 | 3 |
| 9 | 0 | 0 | 0 | 0 | 0 | 5 |
| 10 | 0.32 | 2.26 | 3.55 | 1.67 | 0.09 | 5 |
| 11 | 0 | 0 | 0 | 0 | 0 | 5 |
| 12 | 0.13 | 0.70 | 1.30 | 1.42 | 0.10 | 4 |
| 13 | 0.73 | 0.33 | 0.78 | 0.55 | 1.76 | 2 |
| 14 | 0.38 | 0.76 | 0.83 | 0.56 | 0.46 | 4 |
| 15 | 0.21 | 0.39 | 0.64 | 0.60 | 0.38 | 4 |
| 16 | 0.19 | 0.53 | 0.80 | 0.90 | 0.30 | 4 |
| Averages | 0.30±0.44 | 0.58±0.68 | 0.65±0.88 | 0.73±1.01 | 0.54±1.18 | |
After treatment six aneurysms showed no contrast flow in the dome and hence the temporal parameters were not measurable. For calculation of the temporal ratios we considered these quantities to be very large when compared with the measurements obtained in the other cases.
The pre-stented calculated parameters range presented as (min - max) were: NTDC (0.24% – 5.49%) of the bolus injection, the input slope (0.28CD/s – 10.9CD/s), MTT (0.73s – 1.67 s), TTP (0.2s – 0.736 s), and WOT (0.39 s– 1.98 s). The post-stented situation requires separation of the data into three groups: the first group, Figure 4, contains 6 cases (Case numbers:2, 4, 5, 6, 9, 11) where the flow was completely eliminated; the second group, Figure 5, contains 7 cases (1, 7, 10, 12, 14, 15, 16) that displayed different degrees of flow reduction after the treatment; and finally the third group of 3 (3, 7,13) encountered various problems during the stent deployment resulting in inappropriate treatment.
Figure 4.
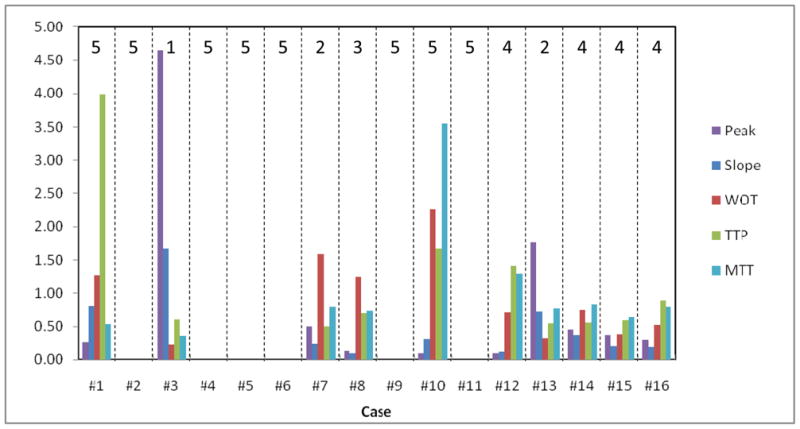
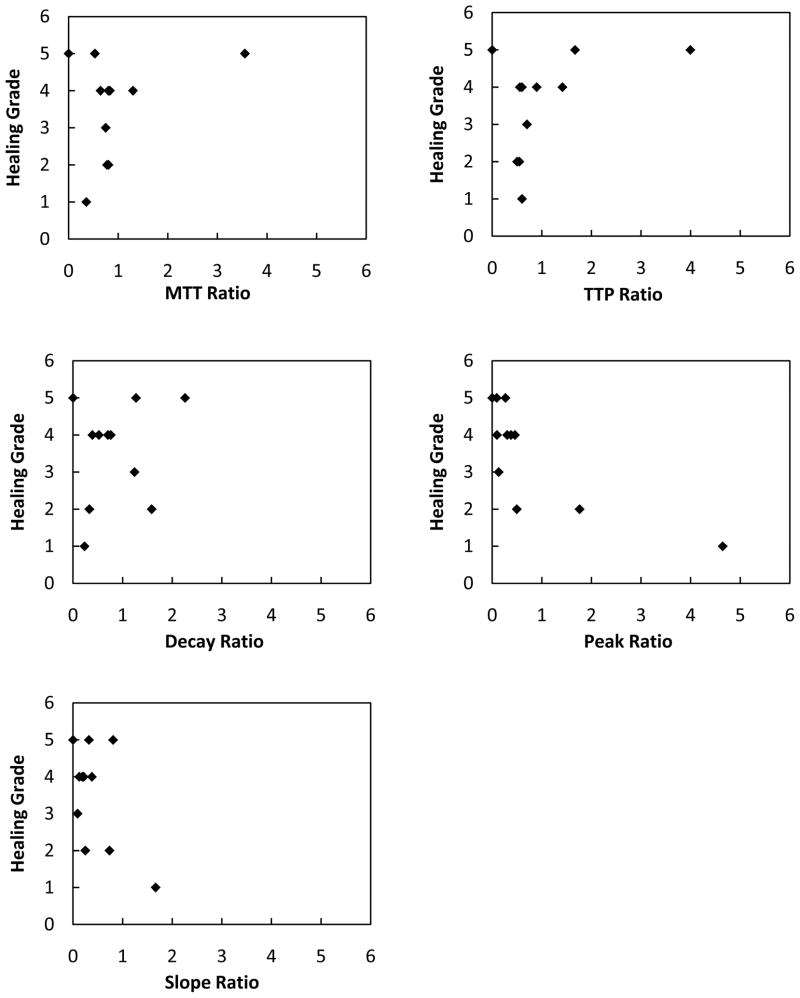
Graphical representation of Table 2
Figure 5.
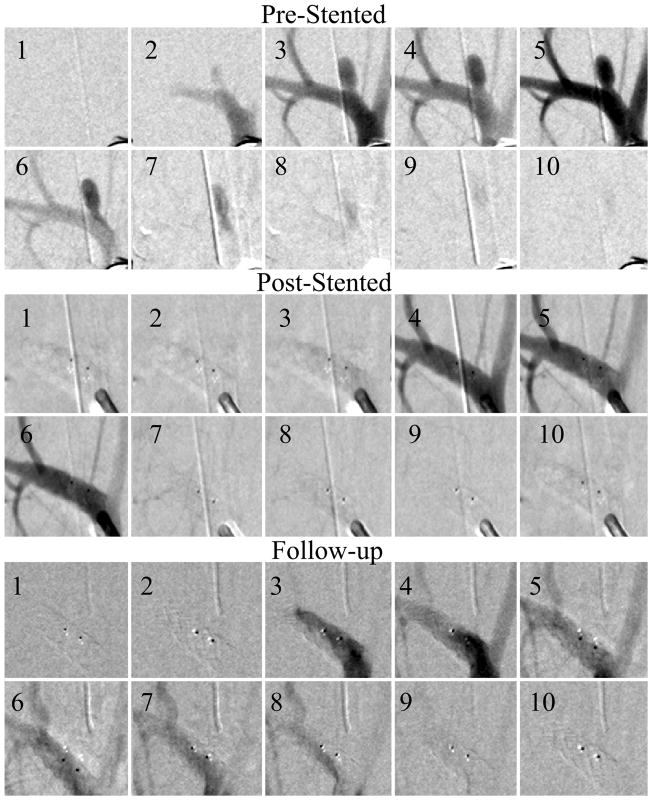
Fully occluded aneurysm (Case #5). The sequences were acquired at 15 frames per second, the three sequences show pre-stented, post-stented and follow up runs. Every fifth picture in the DSA run is displayed in the sequence. After the treatment there was no contrast flow in the aneurysm and the follow-up run reveals no flow in the aneurysm. The two dark dots are the stent platinum markers.
For the first group, the treatment outcome is almost obvious and total occlusion was confirmed at the follow-up. The second group is of particular interest since we need to know, if flow reduction is present, then how much change would be necessary to cause aneurysm thrombosis. Even in this group the results showed drastic reduction of flow in the aneurysm dome: NTDC (0.02% – 2.4%) of the bolus injection, the input slope (0.09CD/s – 3.81 CD/s), MTT (0.47s – 2.83s)s, TTP (0.17s – 0.67s)s, and WOT (0.34s – 1.69s).
For the third group two aneurysms showed significant aneurysm contrast flow and both were due to issues with the mechanical deployment of the stent. In case #3 the stent did not deploy properly, resulting in incomplete contact of the stent with the aneurysm neck and partial blockage of the vessel lumen. Unfortunately the issue was not observed after deployment due to the lack of radio-opacity of the stent; if by means of markers the incomplete deployment would have been identified, then we could have insured the proper expansion using a balloon tipped catheter. Case 13 was part of the second kind of SAVS, Type B. In this case, as the main artery had a very large curvature, the patch did not allow the stent to curve freely resulting in a rotation of 180°, hence a total misalignment of the stent low porosity region with respect to the aneurysm neck.
The relative parameters calculations are shown in Table 2. Perferably all the parameters should have been less than one after stent treatment. We also added a column which shows the final treatment outcome, according to the grading scale established in the materials and methods section. The parameters average values for all the cases displayed at the bottom of the table show that overall, stents have caused a significant change in contrast flow in the aneurysms.
If we exclude the third group from the study then the average parameter ratios are: the input slope=0.16±0.23 (CD/s), WOT=0.55±0.7(s), MTT=0.65±0.98(s), TTP=0.76±1.13(s) and peak=0.13±0.16 (CD). The contrast related quantities show significant changes while the time related ones show almost no change.
To visualize possible correlation between measured parameter ratios and healing grade, we represented each of these parameters in 5 different plots shown in Figure 6. The time related quantities show very little correlation with the healing grade we chose. However, the contrast related quantities show better correlation.
Figure 6.
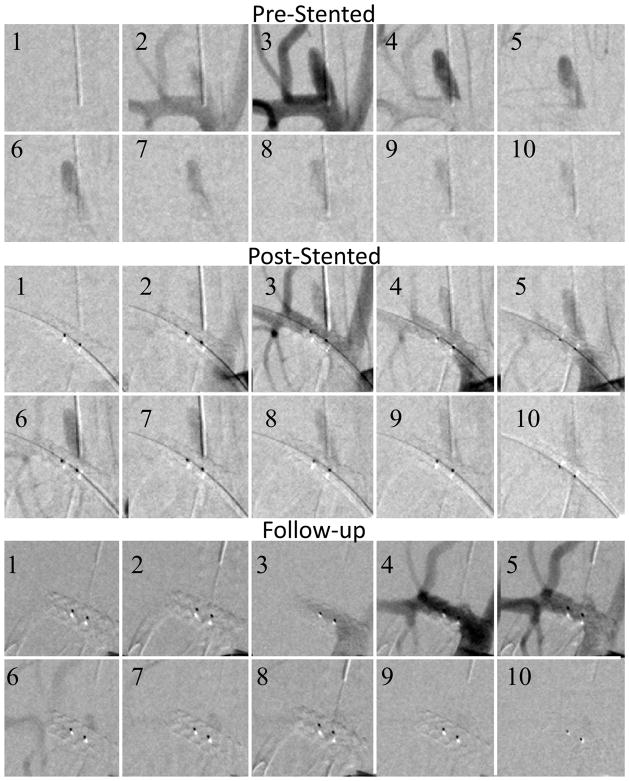
Fully occluded aneurysm (Case #7). The sequences were acquired at 15 frames per second, the three sequences show pre-stented, post-stented and follow up runs. Every fifth picture in the DSA run is displayed in the sequence. After the treatment there was significant contrast flow in the aneurysm. The follow-up run reveals remnant neck, at the proximal side of the asymmetric patch indicated by the right dark dot (platinum marker).
DISCUSSION
In the current experiment we have two purposes, first to assess the aneurysms treated with the SAVS’s and second, to establish one or a few treatment-predictive coefficients derived from the angiographic analysis. While all the quantities measured and reported in the results section have been previously reported, quantities measured using time density curves normalized to the intra-arterial bolus has not been reported. Aneurysmal contrast flow analysis using NTDC’s, offers an insight into the stent treatment effectiveness when the procedure occurred without significant mechanical problems.
With regard to the first goal of the current study, the new SAVS constitute a tremendous advance over the previously reported experiments done with balloon expandable AVS’s. First, we have not observed any vessel injuries or animal losses during the experiment. The mechanical properties of the current SAVS are very similar to the currently used neurovascular stents, and the method of deployment is also identical.
Moreover, we believe that quantities presented solely for untreated or treated cases do not offer a strong insight into predicting the final treatment outcome. Hence, in order to obtain a trustworthy conclusion on the treatment outcome, based on time density curves, a pre- and post- relative quantity must be calculated. Even in this case the conditions on the acquired data must be very strict, and if at all possible, the pre and post injections should be done using the same projection angle, same catheter, same injector, and the same location for the bolus starting point. We have made a few assumptions during the current quantities derivation. First we considered that the bolus travels with almost the same velocity from Li to Lf. Our supposition was based on the proximity to the heart. The actual physical distance was less than 2 cm.
Regarding the ratio calculations in Table 2, the convention we made for the six cases showing no contrast flow post-treatment that the temporal parameters (TTP. MTT, WOT) had very large values, was based on the assumption that the blood exchange between the main artery and the aneurysm is so slow that very little contrast enters the aneurysm neck, followed by a very long time to clear.
For the three aneurysms showing significant flow at the follow-up, stent-deployment problems were caused by mechanical malfunctions. Some of these problems were fixed during the current experimental run and some are to be fixed in the future studies.
The attempt to correlate the measured parameter ratios with the healing grade shown in Figure 7 was not totally successful. So far only the relative parameters related to the contrast bolus injection (NTDC Peak and Input Slope) show a correlation with the healing grade. The time-related quantities (TTP, MTT, WOT) derived according to previous work were not as predictive of the final outcome; this is due to the fact that there is no normalization or deconvolution of the time distribution of the injected bolus. For example, a slower injection could result in a longer TTP, MTT and WOT. In our view, such a method should be applied to eliminate such dependence.
Figure 7.
Plots showing the measured parameters versus healing grade.
Some of our post-stented cases had lower time related parameters which if taken separately would make an observer believe that the treatment increased the flow in the aneurysm dome. However, often it happens that the treatment will result in the exclusion of the aneurysm from the circulation with the exception of a small area located in the neck vicinity. In this area we observed fast contrast entrance followed by immediate clearance. The fact that the contrast did not disperse in the rest of the aneurysm indicates a flow separation and isolation of the dome from the circulation. If in these cases we look at contrast related parameters then we will see a large discrepancy indicating that the flow in the aneurysm had decreased. This example shows that these parameters should be regarded as a whole in order to create the large picture and aim towards a global grade that will include each one of them.
This study has demonstrated usage of the latest asymmetric vascular stent in-vivo. When successful, the stent treatment showed significant flow reduction which resulted in almost entire aneurysm occlusion at the four week follow-up. If kept longer, it would likely result in a better outcome especially in the case of the remnant aneurysm necks. Overall the stent performed much better that the previous balloon-deployable versions and is one step closer toward clinical implementation.
CONCLUSIONS
By comparing the pre-and post-stented NTDC’s, we estimated that a significant flow disruption occurred in the post-treated aneurysms. Also the analysis showed that the new stents are very effective in modifying the hemodynamics of the contrast and blood flow. The observed changes are comparable or better than previous versions of the AVS2–8, however, the treatment results, in terms of successful stent deployment and post operational complications, showed a significant improvement.
Acknowledgments
Support from the Grants R01NS43924 and R01EB002873 and Toshiba Medical Systems Corp. We would like to thank: Liza Pope, Andrey Synelnikov, Hajime Ohta, and Elad Levy for their collaboration.
References
- 1.Ionita CN, Rudin S, Hoffmann KR, Bednarek DR. Microangiographic image-guided localization of a new asymmetric stent for treatment of cerebral aneurysms. Proc of SPIE. 2005;5744:354. doi: 10.1117/12.594789. [DOI] [PMC free article] [PubMed] [Google Scholar]
- 2.Rangwala HS, Ionita CN, Rudin S, Baier RE. Partially polyurethane-covered stent for cerebral aneurysm treatment. J Biomed Mater Res B Appl Biomater. 2009;89:415–429. doi: 10.1002/jbm.b.31229. [DOI] [PMC free article] [PubMed] [Google Scholar]
- 3.Ionita CN, Hoi Y, Meng H, Rudin S. Particle image velocimetry (piv) evaluation of flow modification in aneurysm phantoms using asymmetric stents. Proc of SPIE. 2004;5369:295. doi: 10.1117/12.534274. [DOI] [PMC free article] [PubMed] [Google Scholar]
- 4.Ionita CN, Paciorek AM, Dohatcu A, Hoffmann KR, Bednarek DR, Kolega J, Levy EI, Hopkins LN, Rudin S, Mocco JD. The asymmetric vascular stent: Efficacy in a rabbit aneurysm model. Stroke. 2009;40:959–965. doi: 10.1161/STROKEAHA.108.524124. [DOI] [PMC free article] [PubMed] [Google Scholar]
- 5.Ionita CN, Dohatcu A, Sinelnikov A, Sherman J, Keleshis C, Paciorek AM, Hoffmann KR, Bednarek DR, Rudin S. Angiographic analysis of animal model aneurysms treated with novel polyurethane asymmetric vascular stent (p-avs): Feasibility study. Proc of SPIE. 2009;7262:72621H. doi: 10.1117/12.812628. [DOI] [PMC free article] [PubMed] [Google Scholar]
- 6.Ionita CN, Paciorek AM, Hoffmann KR, Bednarek DR, Yamamoto J, Kolega J, Levy EI, Hopkins LN, Rudin S, Mocco J. Asymmetric vascular stent: Feasibility study of a new low-porosity patch-containing stent. Stroke. 2008;39:2105–2113. doi: 10.1161/STROKEAHA.107.503862. [DOI] [PMC free article] [PubMed] [Google Scholar]
- 7.Dohatcu A, Ionita CN, Paciorek A, Bednarek DR, Hoffmann KR, Rudin S. Endovascular image-guided treatment of in-vivo model aneurysms with asymmetric vascular stents (avs): Evaluation with time-density curve angiographic analysis and histology. Proc of SPIE. 2008;6916:69160P. doi: 10.1117/12.769504. [DOI] [PMC free article] [PubMed] [Google Scholar]
- 8.Kim M, Ionita CN, Tranquebar R, Hoffmann KR, Taulbee DB, Meng H, Rudin S. Evaluation of an asymmetric stent patch design for a patient specific intracranial aneurysm using computational fluid dynamic (cfd) calculations in the computed tomography (ct) derived lumen. Proc of SPIE. 2006;6143:61432G. doi: 10.1117/12.651773. [DOI] [PMC free article] [PubMed] [Google Scholar]
- 9.Sadasivan C, Cesar L, Seong J, Wakhloo AK, Lieber BB. Treatment of rabbit elastase-induced aneurysm models by flow diverters: development of quantifiable indexes of device performance using digital subtraction angiography. IEEE Trans Med Imaging. 2009;28(7):1117–25. doi: 10.1109/TMI.2008.2012162. [DOI] [PMC free article] [PubMed] [Google Scholar]
- 10.Tenjin H, Asakura F, Nakahara Y, Matsumoto K, Matsuo T, Urano F, Ueda S. Evaluation of intraaneurysmal blood velocity by time-density curve analysis and digital subtraction angiography. Am J Neuroradiol. 1998;19(7):1303–7. [PMC free article] [PubMed] [Google Scholar]
- 11.Asakura F, Tenjin H, Sugawa N, Kimura S, Oki F. Evaluation of intra-aneurysmal blood flow by digital subtraction angiography: blood flow change after coil embolization. Surg Neurol. 2003;59(4):310–9. doi: 10.1016/s0090-3019(02)01045-5. [DOI] [PubMed] [Google Scholar]
- 12.Shpilfoygel SD, Close RA, Valentino DJ, Duckwiler GR. X-ray videodensitometric methods for blood flow and velocity measurement: a critical review of literature. Med Phys. 2000;27(9):2008–23. doi: 10.1118/1.1288669. [DOI] [PubMed] [Google Scholar]
- 13.Wang W, Ionita CN, Keleshis, Kuhls-Gilcrist ATC, Jain A, Bednarek DR, Rudin S. Progress in the development of a new angiography suite including the high resolution micro-angiographic fluoroscope (MAF), a control, acquisition, processing, and image display system (CAPIDS), and a new detector changer integrated into a commercial C-arm angiography unit to enable clinical use. Proc of SPIE. 2010 doi: 10.1117/12.844909. [DOI] [PMC free article] [PubMed] [Google Scholar]


