Abstract
Due to the high-resolution needs of angiographic and interventional vascular imaging, a Micro-Angiographic Fluoroscope (MAF) detector with a Control, Acquisition, Processing, and Image Display System (CAPIDS) was installed on a detector changer which was attached to the C-arm of a clinical angiographic unit. The MAF detector provides high-resolution, high-sensitivity, and real-time imaging capabilities and consists of a 300 μm-thick CsI phosphor, a dual stage micro-channel plate light image intensifier (LII) coupled to a fiber optic taper (FOT), and a scientific grade frame-transfer CCD camera, providing an image matrix of 1024×1024 35 μm square pixels with 12 bit depth. The Solid-State X-Ray Image Intensifier (SSXII) is an EMCCD (Electron Multiplying charge-coupled device) based detector which provides an image matrix of 1k×1k 32 μm square pixels with 12 bit depth. The changer allows the MAF or a SSXII region-of-interest (ROI) detector to be inserted in front of the standard flat-panel detector (FPD) when higher resolution is needed during angiographic or interventional vascular imaging procedures. The CAPIDS was developed and implemented using LabVIEW software and provides a user-friendly interface that enables control of several clinical radiographic imaging modes of the MAF or SSXII including: fluoroscopy, roadmapping, radiography, and digital-subtraction-angiography (DSA). The total system has been used for image guidance during endovascular image-guided interventions (EIGI) using prototype self-expanding asymmetric vascular stents (SAVS) in over 10 rabbit aneurysm creation and treatment experiments which have demonstrated the system's potential benefits for future clinical use.
Keywords: SYS, DA, DSA, Fluoroscope, Roadmap, LabVIEW, MAF, SSXII, Detector-Changer, CAPIDS
1. INTRODUCTION
Traditional flat panel detectors (FPD), which typically have pixel sizes of 194 μm and larger, may not meet the needs of angiographic and interventional vascular imaging for neurovascular procedures involving small vessels and devices, such as endovascular image-guided intervention (EIGI) with the new asymmetric vascular stent (AVS) [1], which has a strut size of only 70 μm. We report on progress in the development of a complete EIGI system containing a high-resolution MAF detector (Figure 1) [1] with 35 μm pixels and up to 30 frames per second imaging capabilities. Also the new detector changer allows the MAF to be inserted in front of the FPD for more demanding imaging tasks, such as accurate placement of a self-expanding asymmetric vascular stents (SAVS), and provides a solid support for both single plane angiographic imaging and rotational computed tomography imaging [2]. The Control, Acquisition, Processing, and Image Display System (CAPIDS) [3] enables the MAF detector to perform in several clinical radiographic imaging modes including: fluoroscopy, roadmapping, radiography, and digital-subtraction-angiography (DSA). Over 10 rabbit experiments were performed using the new angiography suite for aneurysm creation and EIGI SAVS deployment.
Figure 1.
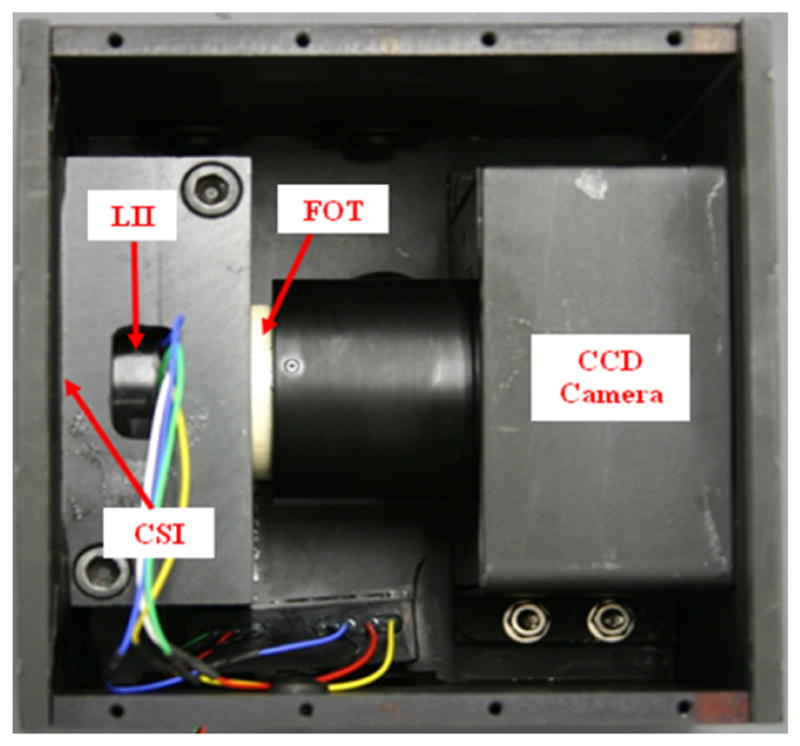
MAF Detector.
2. METHODS AND MATERIALS
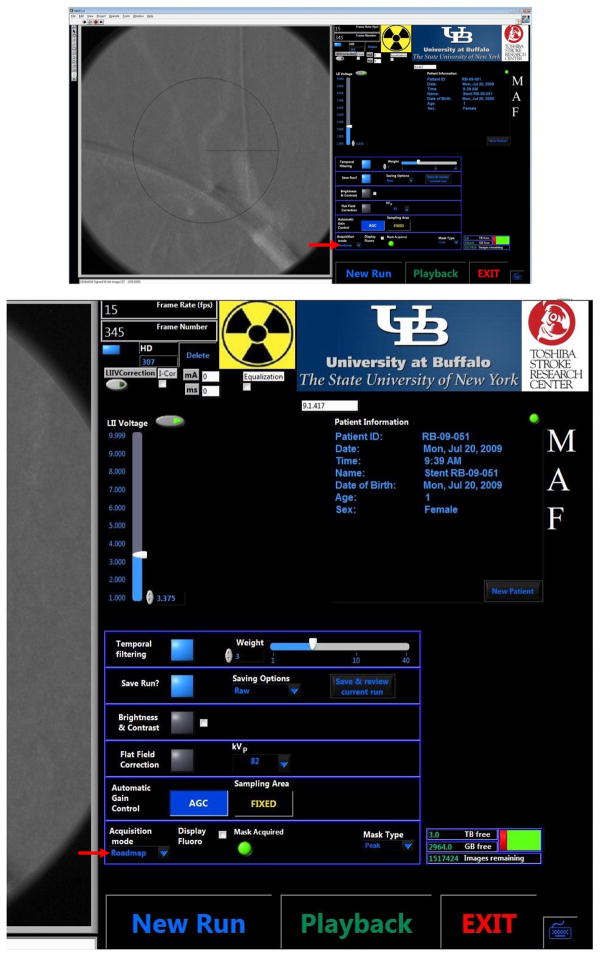
A typical EIGI SAVS deployment in a rabbit aneurysm model goes as follows: First the FPD is operated in both fluoroscopy and angiography modes to bring the stent to the aneurysm location and place it in the center of the field of view and to determine the “optimum” x-ray parameters (as set by the automatic exposure control of the angiographic system). For example, the x-ray tube parameters in fluoroscopy (radiography) mode were 80kV (80kV),13mA (160mA), a pulse time of 2.6ms (9ms), and a pulse rate of 20fps (15fps). The MAF detector is then inserted in front of the FPD detector using the new detector changer shown in Figure 5. The x-ray techniques were manually adjusted to provide exposures that were to 2 to 3 times those of the FPD, e.g. for fluoroscopy: 80kV, 30mA, and 2.6ms, and for angiography: 80kV, 320mA, and 9ms, however, for a much smaller field of view as the x-ray beam was collimated to the field size of the MAF. This was done to increase contrast resolution at the higher spatial frequencies available with the MAF. The imaging mode is set to fluoroscopy using CAPIDS (Figure 3) and the patient table with the rabbit is slightly adjusted to center the aneurysm in the MAF's field of view. The mode is then set to Roadmap using CAPIDS and mask images are acquired while the contrast is injected into the artery near the aneurysm. The SAVS is then deployed under roadmap mode using the MAF (the system is compatible with the new SSXII detector as well [4]).
Figure 5.
Main components of the detector changer.
Figure 3.
CAPIDS Control Panel - Acquisition (upper), zoomed right side of the panel (lower).
2.1 MAF
The MAF detector consists of a 300 μm CsI phosphor, a dual-stage micro-channel plate Light Image Intensifier (LII) coupled to a 2.88:1 fiber-optic taper (FOT) and a fast frame rate, progressive scan, frame-transfer CCD camera. The MAF detector's field of view is nominally 4 cm in diameter and it provides 1024×1024 pixels resolution with 35 microns pixel size and 12 bit depth for each pixel [1, 3, 5]. A photo of the MAF is shown in Figure 1. Figure 2 shows the new angiography suite with in-room displays.
Figure 2.

The new Angiography Suite with the MAF Detector deployed using the new detector changer.
2.2 CAPIDS
CAPIDS was developed and implemented using Laboratory Virtual Instrument Engineering Workbench (LabVIEW) software which is a graphical programming environment designed by national instruments (NI, Austin, TX). CAPIDS has two user interfaces, the control and acquisition interface and the display and processing interface. The CAPIDS control and acquisition graphic interface for the MAF is shown in Figure 3. An acquired image (in this case, the roadmap image) is shown on the left of the panel and the control and status is shown on the right of the panel. The main acquisition mode control (indicated here by the red arrow pointing to roadmap) can be switched between different imaging modes including fluoroscopy, roadmap, angiography, and DSA. Each imaging mode implements appropriate default settings which are located in the table above the acquisition mode control: operator selectable temporal filtering, saving option, brightness & contrast adjustment, flat-field correction, and automatic gain control. During roadmap or DSA, the radiologist has the option of acquiring new masks or selecting masks from previous runs. Patient registry and file-indexed storage are also included in the software [3, 6].
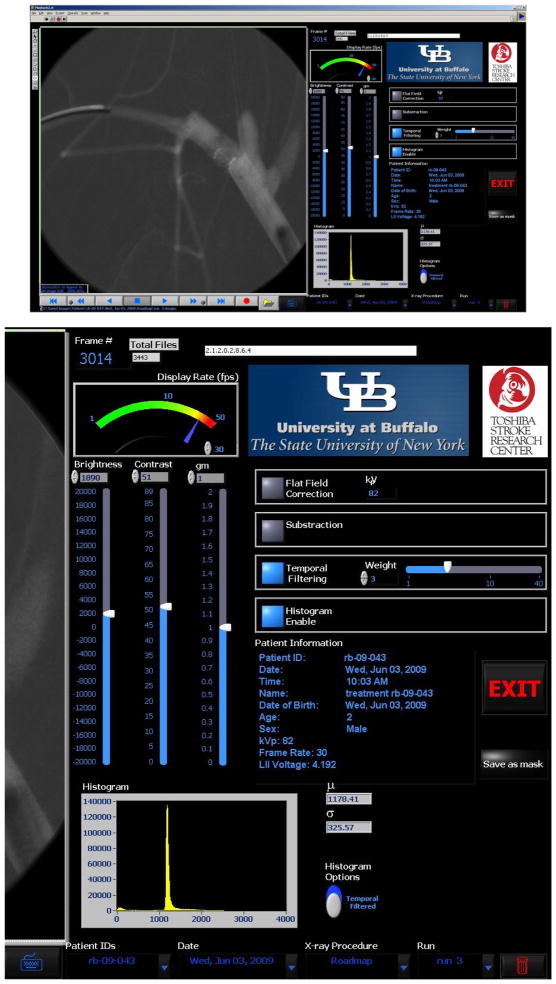
The “playback” button on the CAPIDS control panel will bring out the CAPIDS display and processing user interface as shown in Figure 4 [3, 6]. In this interface, an image is shown on the left (in this case the image was obtained in the roadmap mode during stent deployment for rabbit case #1). Patient information (patient ID, age, sex, etc) as well as the techniques (e.g. x-ray voltage) are shown on the right of the interface. The user can adjust the brightness, contrast, and gamma of the displayed image using vertical slide controls. The user can also apply: flat-field correction, subtraction, and temporal filtering, as well as display the image histogram. The playback speed can be changed and the play options include forwards, backwards, step forwards, step backwards, pause, and record the images to AVI (Audio Video Interleave) movie. Any displayed image can be saved as the mask image for the roadmap mode by pressing the “save as mask” button. This interface also gives the user the control to browse the whole patient directory through the options on the lower right of the panel (Patient IDs, Date, X-ray Procedure, and Run number).
Figure 4.
CAPIDS Control Panel - Playback (upper), zoomed right side of the panel (lower).
2.3 Detector Changer
The detector changer (Figure 5), which is attached to the C-arm of the Toshiba angiographic unit, includes a gas-loaded lift to retract the detector changer when the clamp lever is released. The x-ray collimator automatically adjusts when the changer inserts or retracts the MAF detector so that only the FOV, smaller for the MAF detector or larger for the FPD, is exposed. A touch sensor at the front of the ROI detector holder causes the entire imaging unit (FPD and MAF detector) to retract upon physical contact in order to avoid collision of the MAF detector with a patient or other objects on or near the table.
Figure 6 shows the detector changer position switch when the arm is in the retracted and extended positions. This switch causes the collimation to be automatically adjusted to the FOV of the image receptor selected.
Figure 6.
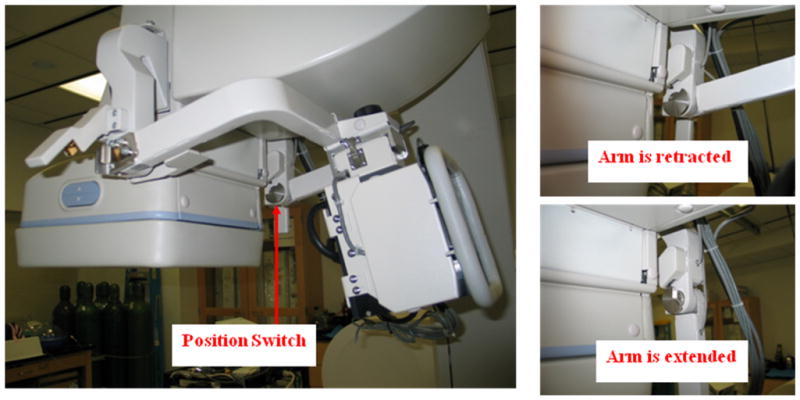
Detector changer position switch.
Figure 7 shows the bolt and latch which are used to secure the camera to the detector changer.
Figure 7.

Detector changer latch and bolt.
Figure 8 shows the MAF in retracted position and inserted position. A trained operator can switch between two positions within 10 seconds.
Figure 8.
MAF in retracted position (left) and inserted position (right).
Figure 9 shows the closed-cell self-deploying asymmetric vascular stent (SAVS). The arrows show the location of radio-opaque markers on the periphery of the patch used to aid positioning. The ring patch is in the middle of the stent.
Figure 9.

EIGI SAVS.
Figure 10 shows the SAVS with an asymmetric patch on the side of the stent. The arrows show the location of radio-opaque markers on the periphery of the patch used to aid positioning.
Figure 10.
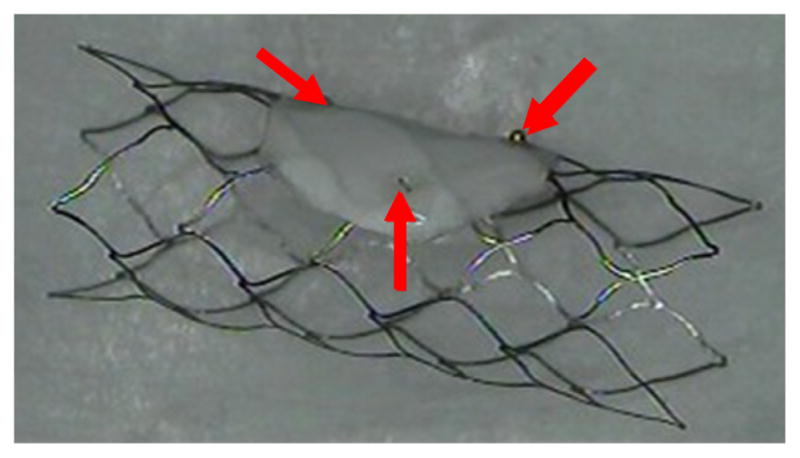
SAVS.
All the rabbit experiments were conducted using the above two kind of stents.
2.5 Rabbit aneurysm
The rabbit aneurysm creation and treatment experiments proceeded as follows. For each rabbit case, the beginning part of the right common carotid artery is tied down and elastase is used to treat the artery. After about 3 weeks when the aneurysm is formed, the rabbit is brought back and the asymmetric vascular stent is deployed using the MAF under roadmap mode. After another 4 weeks, the rabbit is brought back for follow-up check up and sacrifice. The FPD under DSA mode and MAF under DSA mode were used to evaluate the stent performance. After the check up the rabbit is sacrificed and the stent and the vessels were taken out. A phantom is made from the stent and the vessels and a micro-CT scan is performed. Vitrea software (Vital Images, Inc, Minnetonka, MN) was used to check the stent deployment accuracy and the status of the thrombosed aneurysm.
3. RESULTS AND DISCUSSION
3.1 Stent deployment accuracy
Over 10 rabbit experiments were performed using the MAF detector including aneurysm creation and EIGI SAVS deployment.
The stent and aneurysm misalignment refers to the distance between the center of the aneurysm neck and the center of the two markers along the stent. The misalignment shown in Figure 11 is from a MAF roadmap image of rabbit case #2.
Figure 11.
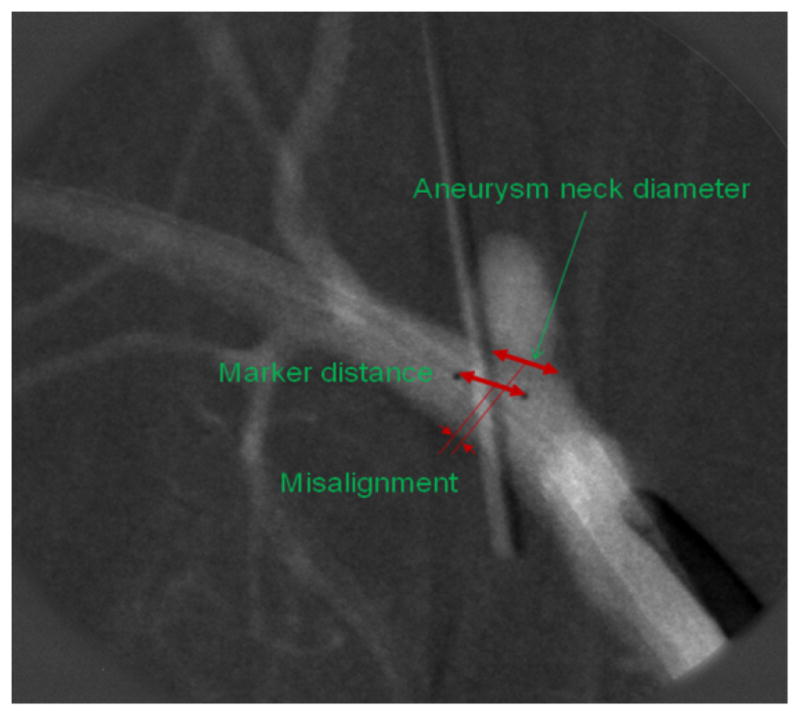
Stent deployment misalignment.
The accurate measurement of the misalignment, aneurysm neck diameter, and the stent marker distance can be measured using Vitrea software. One thrombosed aneurysm case is shown in Figure 11 (rabbit case#3). The stent used in this case is a stent with a ring patch in the middle of the stent (Figure 9). The misalignment shown in Figure 12 refers to the distance between the center of the aneurysm neck and the center of the two markers along the stent. In this case, the misalignment is 1.76 mm.
Figure 12.

Thrombosed aneurysm for rabbit case#2:3D microCT reconstruction (left), and single projection image (right) of resected vessel.
3.2 Higher resolution using MAF detector
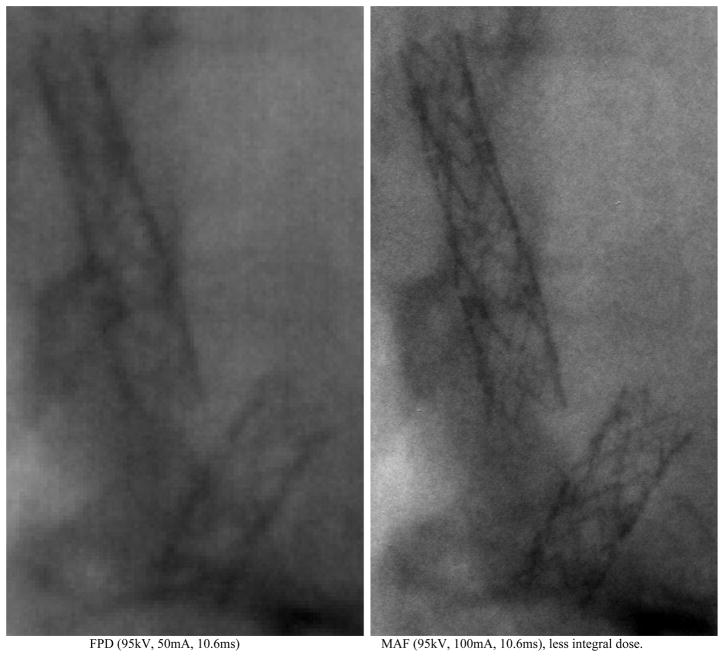
The MAF ROI detector provides a higher resolution (pixel size: 35μm) than the commercial FPD detector (pixel size: 194μm). Figure 13 shows the two stents inside a rabbit (rabbit case#1) imaged using the FPD and the MAF. The two images were selected from the rotational angiography runs for FPD and for MAF. The 70μm diameter stent strut is clearly observed on the MAF image (Figure 13, right), while the stent strut is blurred on the FPD image (Figure 13, left). The area of the FPD is about 30 times larger than the area of the MAF detector, so even with an increase in the exposure by a factor of 2 or 3 when using the MAF, the total integral dose to the patient is still considerably smaller than that when using the FPD.
Figure 13.
Comparison between FPD and MAF.
4. CONCLUSIONS
Progress made on the new angiography suite including the High Resolution Micro-Angiographic Fluoroscope (MAF), a Control, Acquisition, Processing, and Image Display System (CAPIDS), and a New Detector Changer Integrated into a Commercial C-Arm Angiography Unit is presented and over 10 EIGI rabbit experiments have been performed to date using the new angiography suite. The new angiography suite enables the MAF ROI detector which was controlled by the new CAPIDS software to perform in several clinical x-ray imaging modes including: fluoroscopy, roadmapping, radiography, and digital-subtraction-angiography (DSA); the new angiography suite provides increased resolution for angiographic imaging when needed and provides increased accuracy of the stent deployment. The angiography suite is being evaluated for adaptation to a hospital-based clinical system.
Acknowledgments
This work was supported in part by the NIH Grants R01-EB008425, R01-EB002873, and equipment grant from Toshiba Medical Systems Corp.
References
- 1.Ionita CN, et al. Implementation of a high-sensitivity Micro-Angiographic Fluoroscope (HS-MAF) for in-vivo endovascular image guided interventions (EIGI) and region-of-interest computed tomography (ROI-CT) Proc Soc Photo Opt Instrum Eng. 2008;6918:69181I. doi: 10.1117/12.770297. [PMCID:2572822] http://www.ncbi.nlm.nih.gov/entrez/query.fcgi?cmd=Retrieve&db=PubMed&dopt=Citation&list_uids=18958294. [DOI] [PMC free article] [PubMed]
- 2.Patel V, et al. Effect of projection angles used in multi-view reconstruction (MVR) using images from a microangiographic (MA) detector and an image-intensifier (II) system. Medical Physics. 2006;33(6):2229–2229. [Google Scholar]
- 3.Keleshis C. AUTOMATED HIGH RESOLUTION, MICRO-ANGIOGRAPHIC FLUOROSCOPY MEDICAL SYSTEMS. 2009 http://hdl.handle.net/10465/449.
- 4.Kuhls-Gilcrist A, et al. The Solid-State X-Ray Image Intensifier (SSXII): An EMCCD-Based X-Ray Detector. Proc Soc Photo Opt Instrum Eng. 2008;6913:nihpa68284. doi: 10.1117/12.772724. [PMCID:2557100] http://www.ncbi.nlm.nih.gov/entrez/query.fcgi?cmd=Retrieve&db=PubMed&dopt=Citation&list_uids=18836568. [DOI] [PMC free article] [PubMed]
- 5.Yadava GK, et al. Generalized Objective Performance Assessment of a New High-Sensitivity Microangiographic Fluoroscopic (HSMAF) Imaging System. Proc Soc Photo Opt Instrum Eng. 2008;6913:nihpa68288. doi: 10.1117/12.769808. [PMCID:2557068] http://www.ncbi.nlm.nih.gov/entrez/query.fcgi?cmd=Retrieve&db=PubMed&dopt=Citation&list_uids=18836567. [DOI] [PMC free article] [PubMed]
- 6.Keleshis C, et al. LabVIEW Graphical User Interface for a New High Sensitivity, High Resolution Micro-Angio-Fluoroscopic and ROI-CBCT System. Proc Soc Photo Opt Instrum Eng. 2008;6913:69134A. doi: 10.1117/12.769630. [PMCID:2557435] http://www.ncbi.nlm.nih.gov/entrez/query.fcgi?cmd=Retrieve&db=PubMed&dopt=Citation&list_uids=18836570. [DOI] [PMC free article] [PubMed]


