Abstract
The MTF, NNPS, and DQE are standard linear system metrics used to characterize intrinsic detector performance. To evaluate total system performance for actual clinical conditions, generalized linear system metrics (GMTF, GNNPS and GDQE) that include the effect of the focal spot distribution, scattered radiation, and geometric unsharpness are more meaningful and appropriate. In this study, a two-dimensional (2D) generalized linear system analysis was carried out for a standard flat panel detector (FPD) (194-micron pixel pitch and 600-micron thick CsI) and a newly-developed, high-resolution, micro-angiographic fluoroscope (MAF) (35-micron pixel pitch and 300-micron thick CsI). Realistic clinical parameters and x-ray spectra were used. The 2D detector MTFs were calculated using the new Noise Response method and slanted edge method and 2D focal spot distribution measurements were done using a pin-hole assembly. The scatter fraction, generated for a uniform head equivalent phantom, was measured and the scatter MTF was simulated with a theoretical model. Different magnifications and scatter fractions were used to estimate the 2D GMTF, GNNPS and GDQE for both detectors. Results show spatial non-isotropy for the 2D generalized metrics which provide a quantitative description of the performance of the complete imaging system for both detectors. This generalized analysis demonstrated that the MAF and FPD have similar capabilities at lower spatial frequencies, but that the MAF has superior performance over the FPD at higher frequencies even when considering focal spot blurring and scatter. This 2D generalized performance analysis is a valuable tool to evaluate total system capabilities and to enable optimized design for specific imaging tasks.
Keywords: MTF, DQE, GMTF, GDQE, MAF, FPD
INTRODUCTION
Linear system analysis metrics such as modulation transfer function (MTF), normalized noise power spectrum (NNPS), and detective quantum efficiency (DQE) are the most commonly used objective parameters for detector performance evaluation. While they are very useful for evaluating the intrinsic detector performance they are incomplete in describing the total system because they do not account for the effect of scatter, focal spot distribution and geometric unsharpness. The effects of focal spot unsharpness, magnification and scatter have been studied by many authors.1,2,3,4 Kyprianou et. al.5,6 developed a formulation for the generalized performance evaluation. To evaluate the whole system performance in 2D, we used a generalized approach which takes all factors into account and evaluates the two-dimensional system performance for realistic clinical conditions. These generalized linear system analysis metrics designated generalized modulation transfer function (GMTF), generalized normalized noise power spectrum (GNNPS), and generalized detective quantum efficiency (GDQE) include the effect of scatter from the object, geometric magnification, and the 2D focal spot distribution. Others have designated the term 'effective DQE' for somewhat similar concepts.7
In the present study we used 2D generalized linear system metrics to evaluate two radiographic detectors: a standard flat panel detector with 194 micron pixel size and 600 micron thick CsI(Tl) phosphor, and the other a newly-developed, high-sensitivity, high-resolution micro-angiographic fluoroscope (MAF) with 35 micron pixel size and 300 micron thick CsI(Tl) phosphor. The motivation for this evaluation is to demonstrate the capabilities of these detectors realized in actual clinical x-ray systems. In previous work, our group reported on the use of one-dimensional GMTF, GNNPS, and GDQE to give a realistic estimate of total system performance with a micro angiographic detector.8 Here we extend these generalized concepts to a two-dimensional analysis and make a comparative evaluation for both the MAF and a standard flat panel detector (FPD).
METHOD AND MATERIALS
X-ray imaging detectors used and experimental set-up
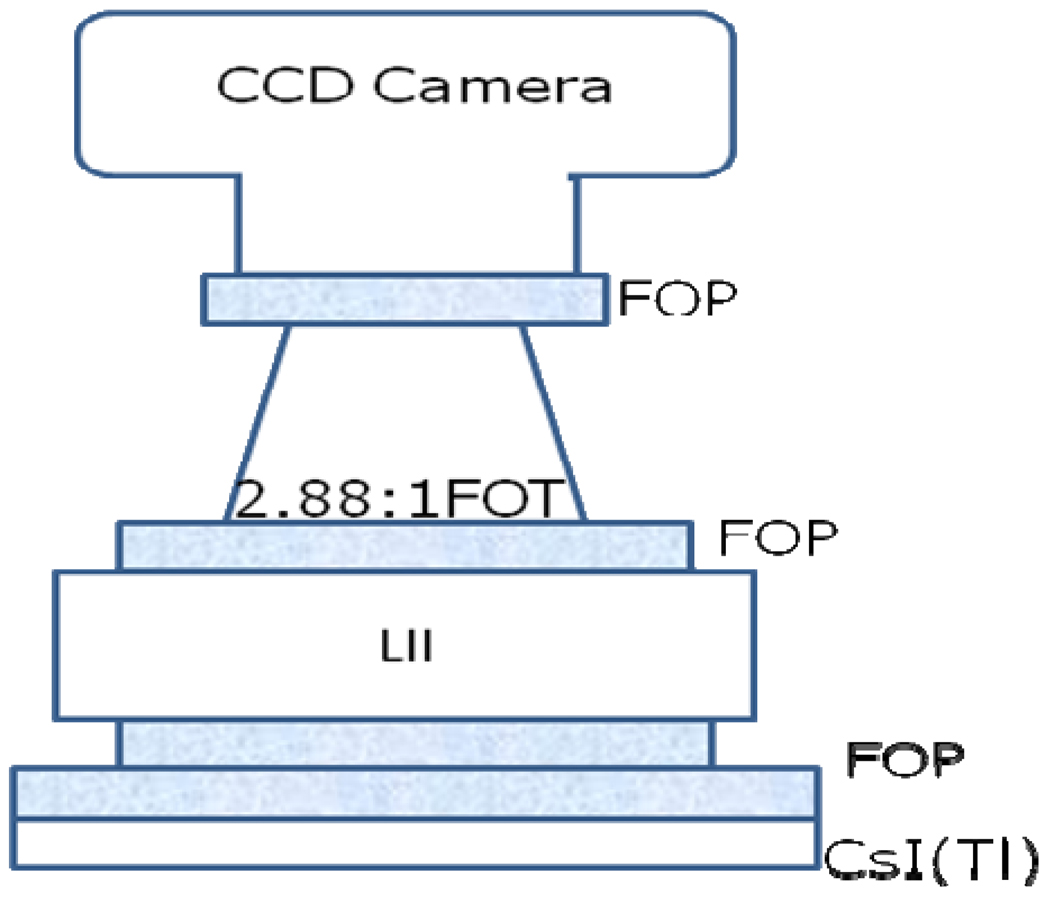
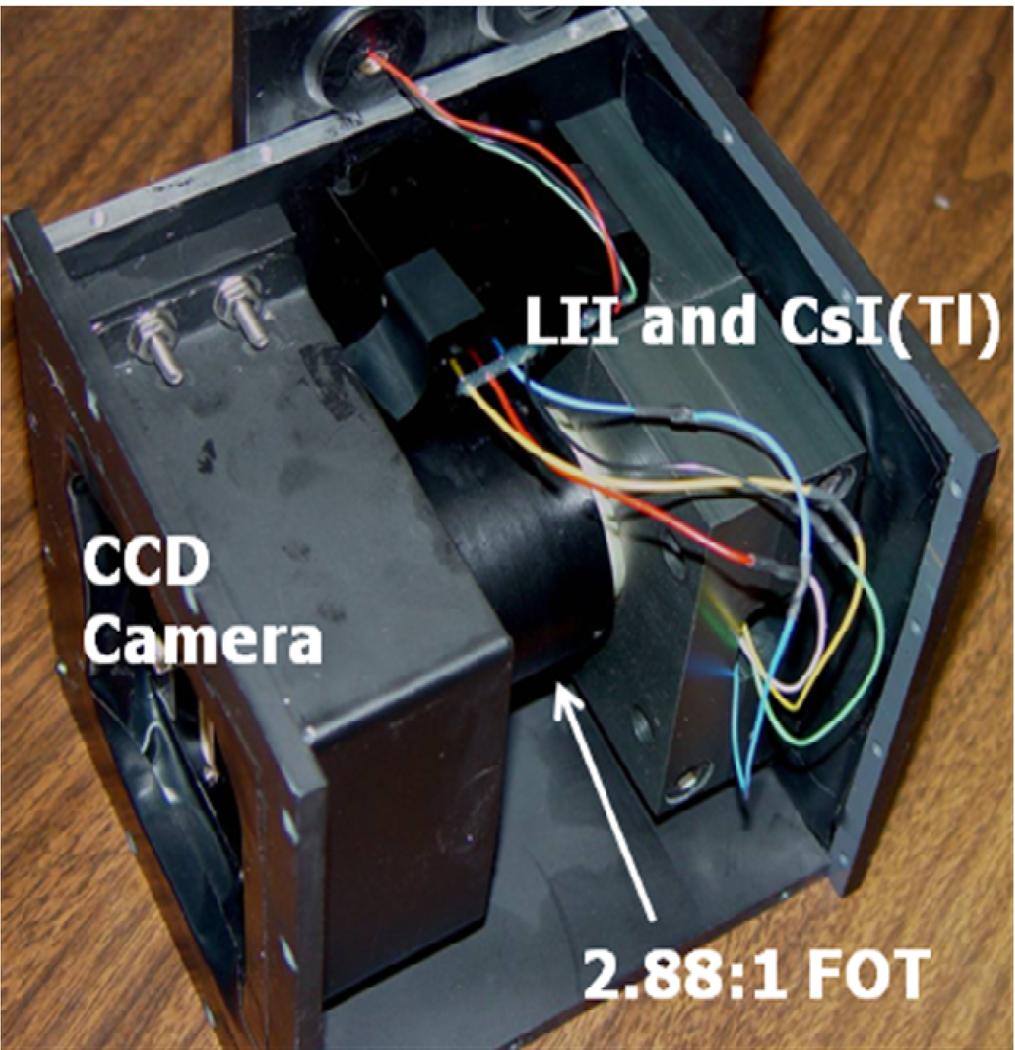
We used a standard flat panel detector (Varian PaxScan 2020 FPD Palo Alto, CA, USA) mounted on a C-arm gantry (Infinix, Toshiba Medical Systems Corporation) and the newly developed Microangiographic Fluoroscope (MAF) for this study. The FPD consists of a 600 micron thick CsI and an array of 1024 by 1024 pixels with 194 micron pixel width. The Micro-Angiographic Fluoroscopic (MAF) detector was used for this study. The MAF is a region of interest x-ray imaging detector with large variable gain and low instrumentation noise9. It is capable of real-time imaging (30 fps) for both fluoroscopic and angiographic applications10. The effective pixel size of 35 microns enables very high spatial resolution. Fig. 1 shows a schematic of the MAF. As shown in Fig. 1, there is a CCD camera (Model Pantera TF-1M30, Dalsa Corp., Waterloo, ON, Canada) coupled to a generation 2 light image intensifier (LIT) (Model PP0410K, DEP Inc., Dwazziewegen 2, NL-9300 AB Roden, The Netherlands) through a 2.88:1 ratio fiber optic taper (FOT). The LII is coupled to a 300 micron thick CsI(Tl) phosphor (Hamamatsu Corp., Bridgewater, NJ) through a fiber optic plate (FOP). A picture of the MAF is shown in fig. 2.
Fig. 1.
MAF Schematic
Fig. 2.
MAF
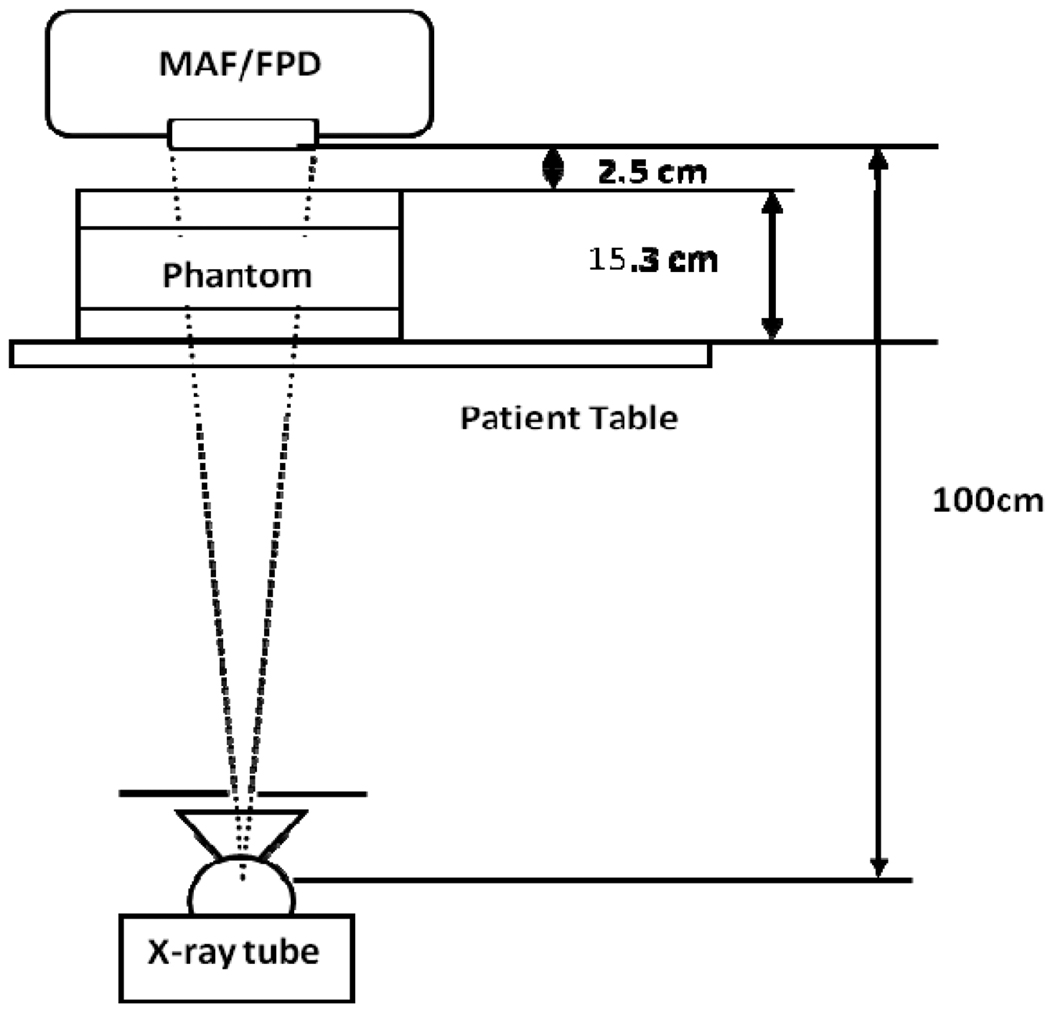
The experimental set up is shown in figure 3. Both detectors were kept at a distance of 100 cm from the x-ray tube. A uniform head equivalent phantom constructed as per AAPM guidelines 11 (simulated with 150 mm thick PMMA and 3 mm Al) was placed on the patient table. In the present study, the FPD was used with a grid (Grid ratio 13:1) while for the MAF; no grid was implemented. The x-ray beam was collimated to fill the full field of view of the detector selected. The measurements for scatter fraction and detector exposure were done using the same setup. The x-ray tube had three choices for the focal spot selection; small (0.3 mm), medium (0.5 mm) and large (0.8 mm).
Fig. 3.
Experimental Set-up
Detector NPS and MTF, focal spot MTF, Scatter MTF and Scatter fraction
The detector noise power spectrum NPS was measured using standard Fourier transform methods12. Sixty (60) flat field images, acquired at 80 kVp for 4 different exposures, were used. The normalized noise power spectrum of the detector calculated from the offset and flat field corrected images can be expressed as5,6,8,13,14
| (1) |
Where a(u,v) and b(u,v) are frequency-dependent constants that can be obtained by fitting the NNPS data taken for different values of exposure (X).
For this study, we used the Noise Response method15 to obtain a 2D detector MTF for the FPD. For the Noise Response method, we measure the 2D NPS of a detector and from the quantum noise component of the NPS we obtain the presampled 2D detector MTF. The slanted edge method16 was used to measure the MAF’s MTF. The 2D MTF was generated by rotating the ID MTF.
For the focal-spot MTF, the standard pin-hole method was used. We measured the focal spot MTFs for all three sizes of focal spots available with our x-ray tube. We measured focal spot for pin-hole magnification value 3.12. The measured focal spot MTF was rescaled for unit focal spot magnification and used for the calculations of the GMTF.
For the measurement of the scatter fraction for both detectors, the standard lead beam stop technique17 was used. Scatter fraction was measured for two different air gaps (2.5 cm and 5 cm).
The scatter MTF was simulated using methods described by Boone et al.18 As suggested by Boone, the scatter PSF was assumed to be Gaussian with a radial expansion term 1/r. The scatter PSF was simulated for a 15 cm Lucite head-equivalent phantom and the Henkel transform of the scatter PSF was used to provide the scatter MTF.
Generalized linear system parameters formalism
The Generalized MTF is given by combining the MTFs for detector (MTFD), focal spot (MTFF), and scatter (MTFS) using the following equation (shown in one-dimension for simplicity)5,6:
| (2) |
where u and v are spatial frequency in the object plane, m is the magnification of features in the object plane onto the detector plane, and the scatter fraction ρ is defined as,
| (3) |
where S and P are scatter and primary components, respectively. A scaling factor, based on the magnification, is used to transfer the spatial frequency of the detector plane into the object plane. This GMTF gives the system resolution relative to the object plane while the simple detector MTF gives the intrinsic detector resolution at the detector plane. The factor (1-ρ) shows that only the primary component contributes to focal spot blurring. The rescaling factor in the focal spot term redefines spatial frequencies into the object plane. The second term has only the scatter contribution and spatial frequencies are rescaled into the object plane using a factor 1/m.4
Similarly, the generalized normalized noise power spectrum is
| (4) |
Where NNPSD (f, X) is the normalized noise power spectrum of the detector at the detector plane and X is the exposure. Using the linearity of the detector, we can fit the NNPS data to equation (1) and can calculate the NNPS for any exposure. When we are calculating NNPS for the images that have scatter, there is no distinction between primary and scattered photon in terms of noise contribution.
Using the GMTF and GNNPS, we can define GNEQ and GDQE as follows;
| (5) |
And,
| (6) |
Where φin(X,m) is the number of quanta per unit area at the detector entrance.
RESULTS
For the comparison and calculations of the GMTF and GDQE, we took two magnifications 1.05 and 1.15. For each magnification, two different air gaps were used. We have three choices for the focal spot with our x-ray tube and we use each focal spot with the combination of magnification and air gaps.
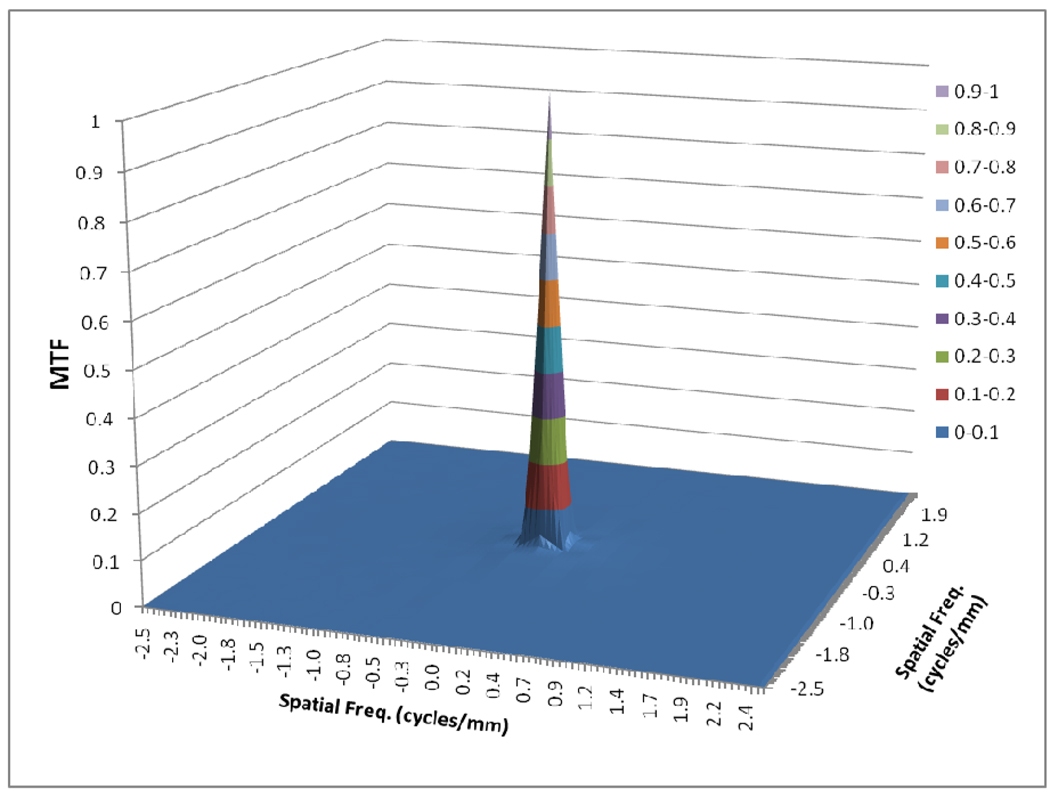
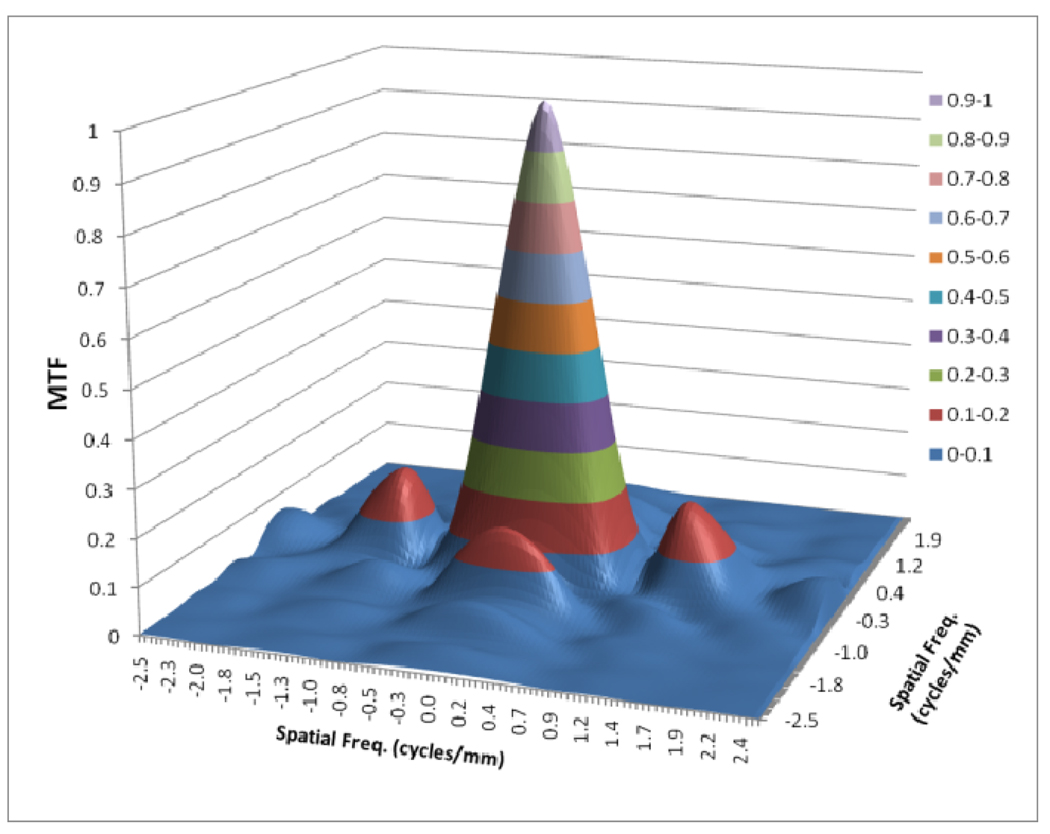
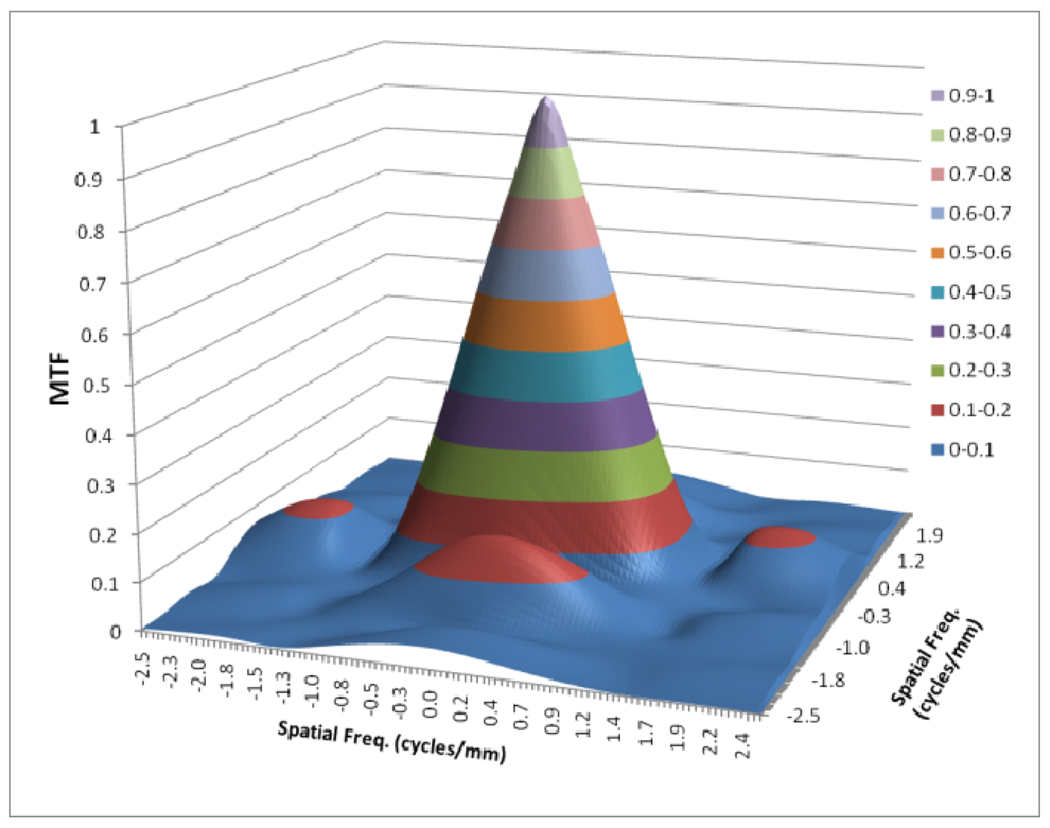
Figure 4 shows the scatter MTF calculated with Boone’s method and figs. 5–7 shows the focal spot MTF for three different focal spots measured.
Fig. 4.
Scatter MTF for 15 cm Lucite
Fig. 5.
Focal spot MTF for small focal spot
Fig. 7.
Focal spot MTF for large focal spot
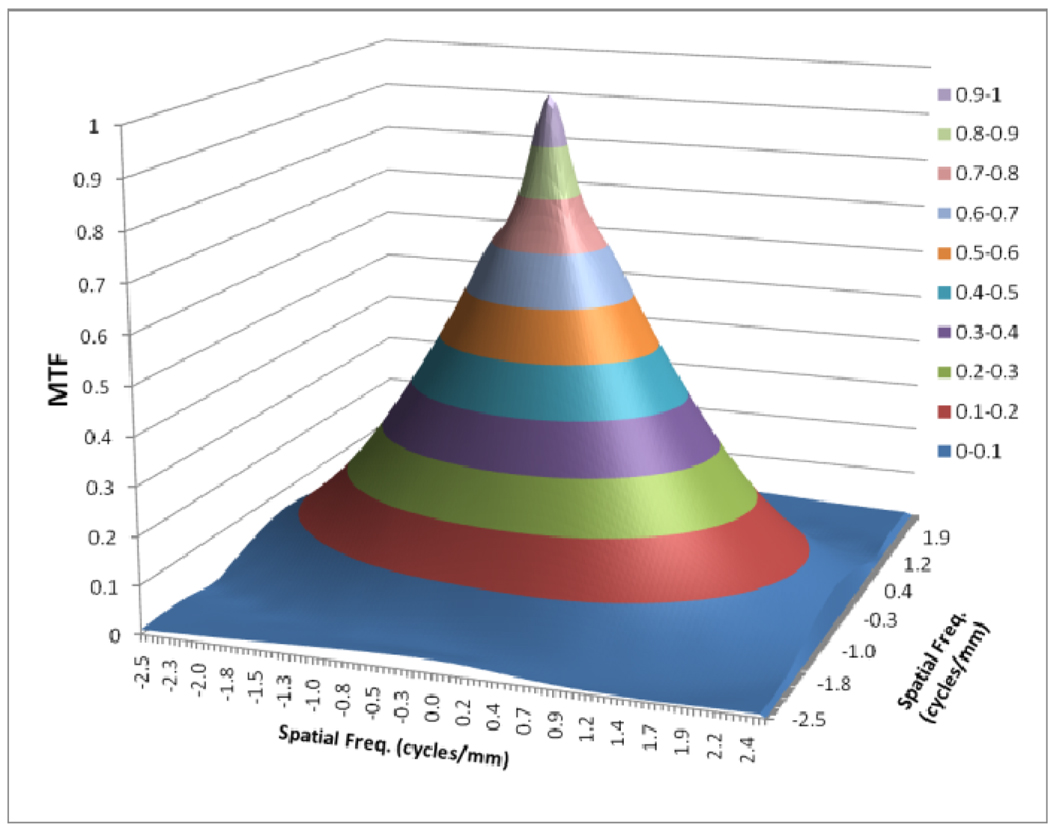
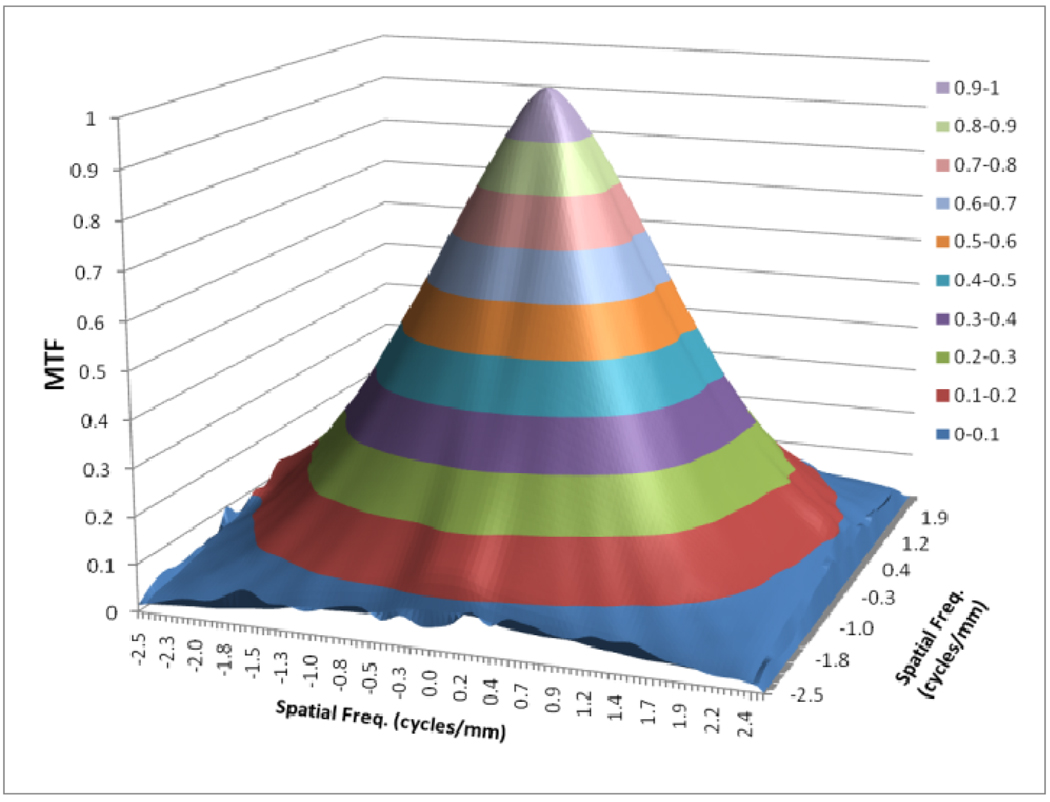
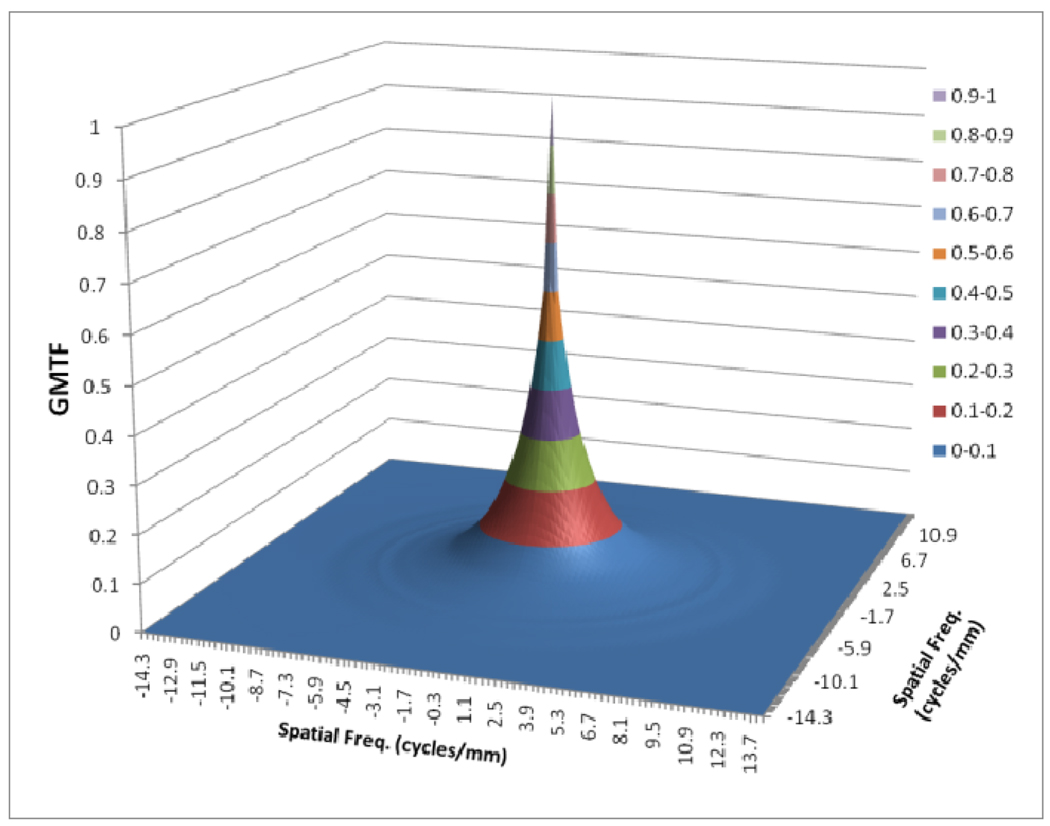
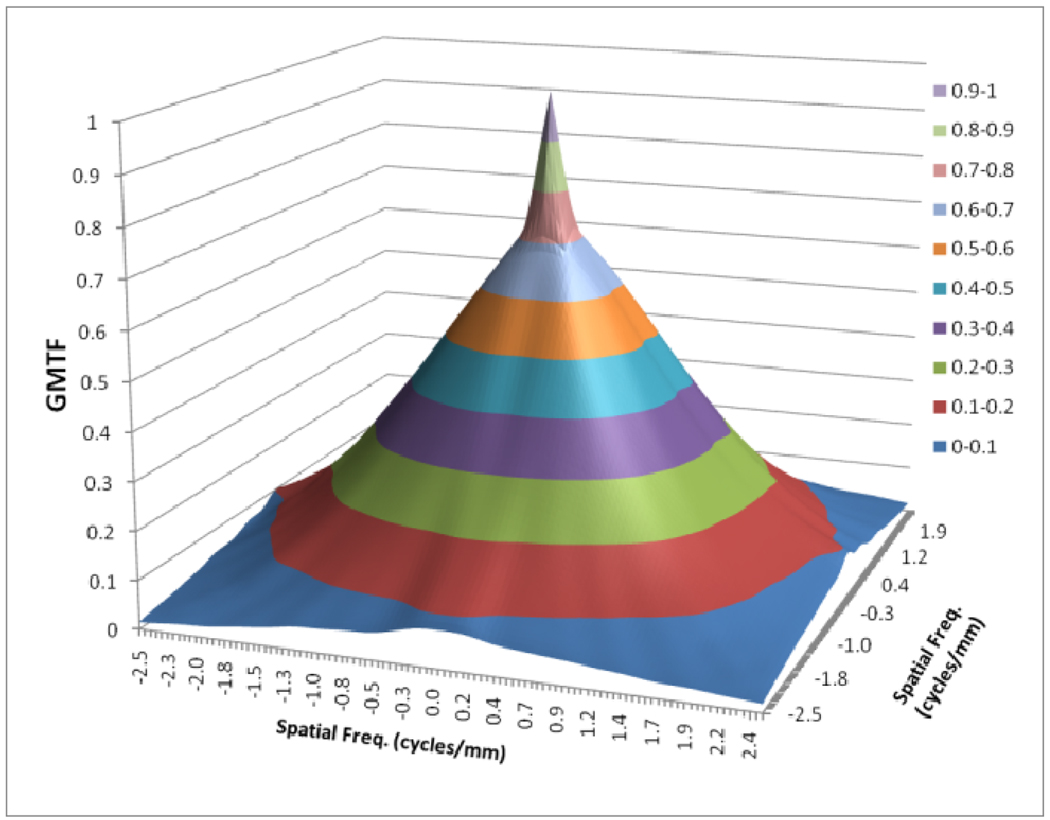
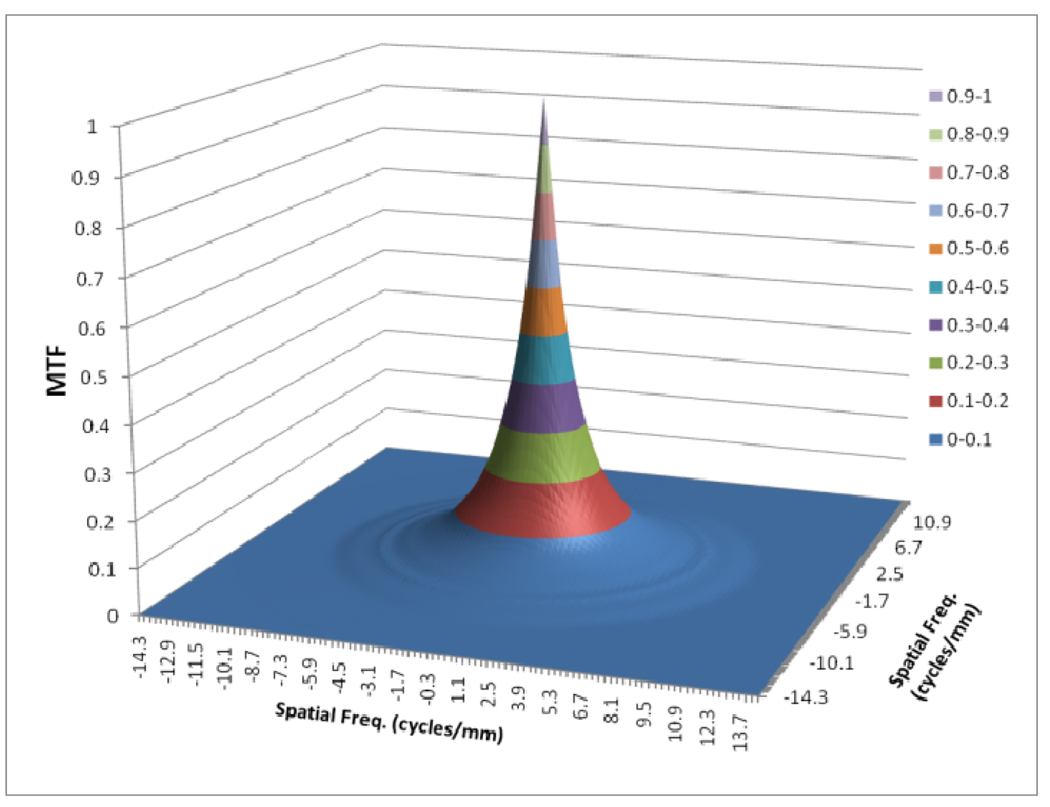
Figures 8 to 11 show the 2D detector MTF for the FPD (fig. 8), 2D GMTF for FPD with magnification 1.05 and air gap 5 cm (fig. 9), 2D detector MTF for the MAF (fig. 10), 2D GMTF for MAF with magnification 1.05 and air gap 5 cm (fig. 11). Units for spatial frequency axes are given in cycles/mm. Notice scale change between FPD (figs. 8, 9) and MAF (figs. 10,11).
Fig. 8.
MTF for FPD
Fig. 11.
GMTF for MAF with m=1.05, air gap=5cm and small focal spot
Fig. 9.
GMTF for FPD with m=1.05, air gap=5cm and small focal spot
Fig. 10.
MTF for MAF
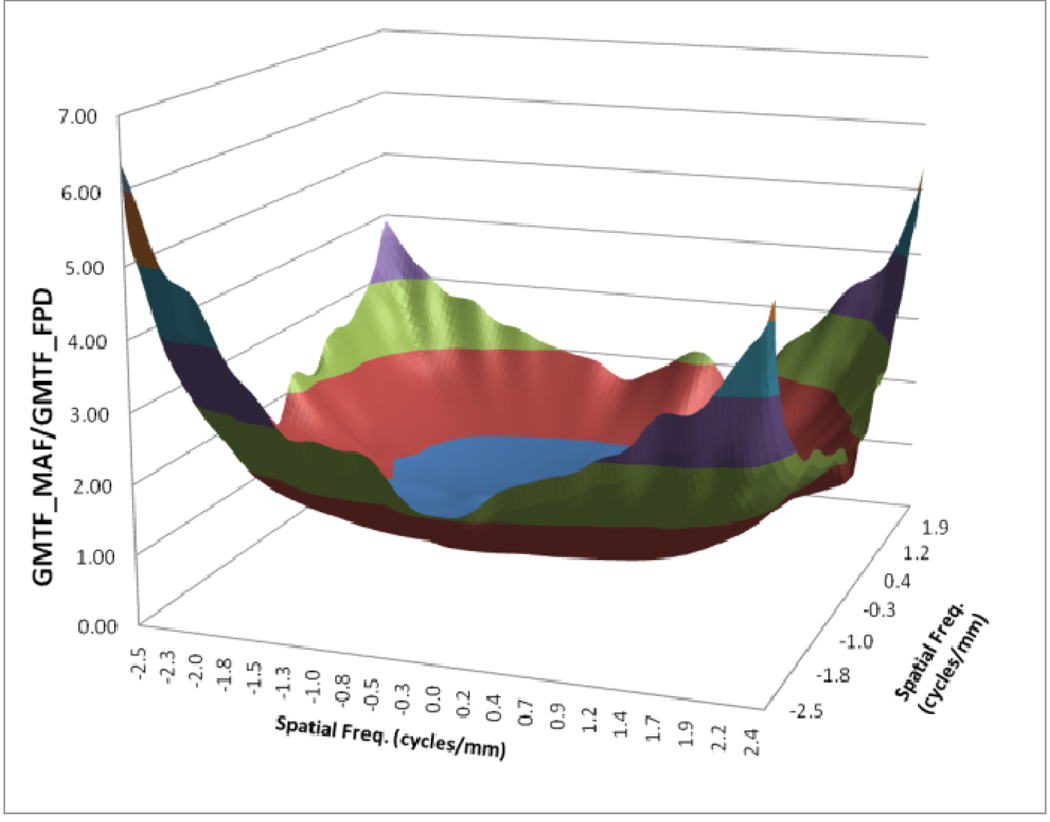
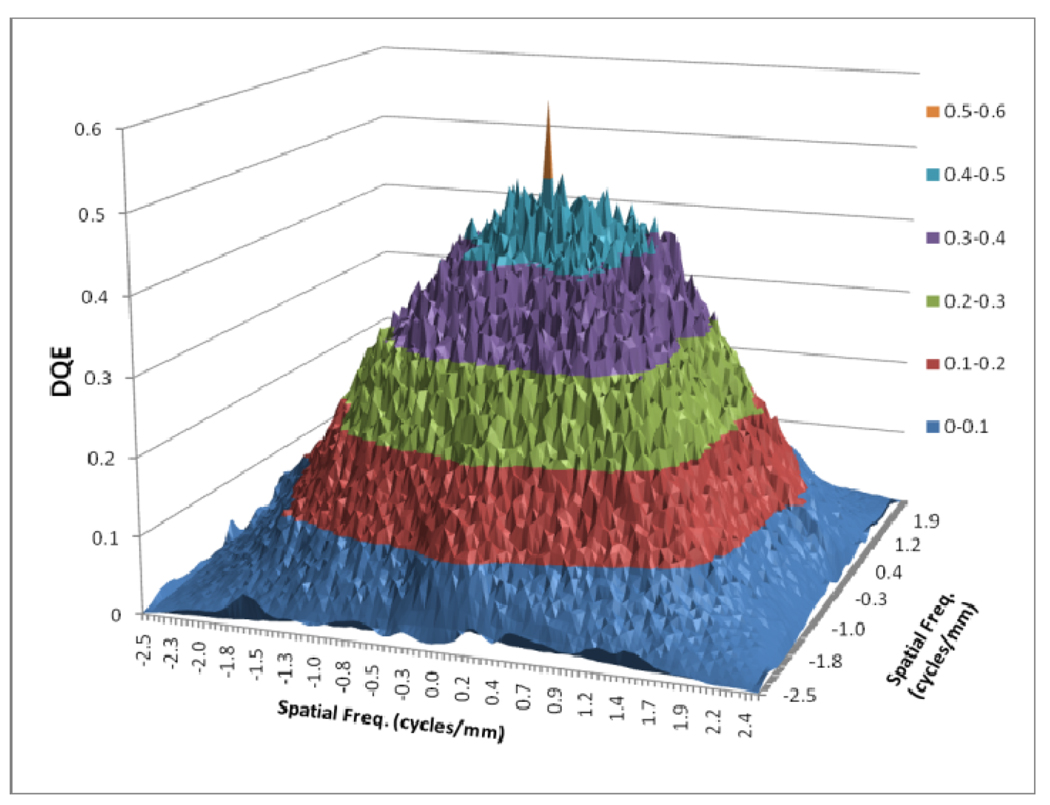
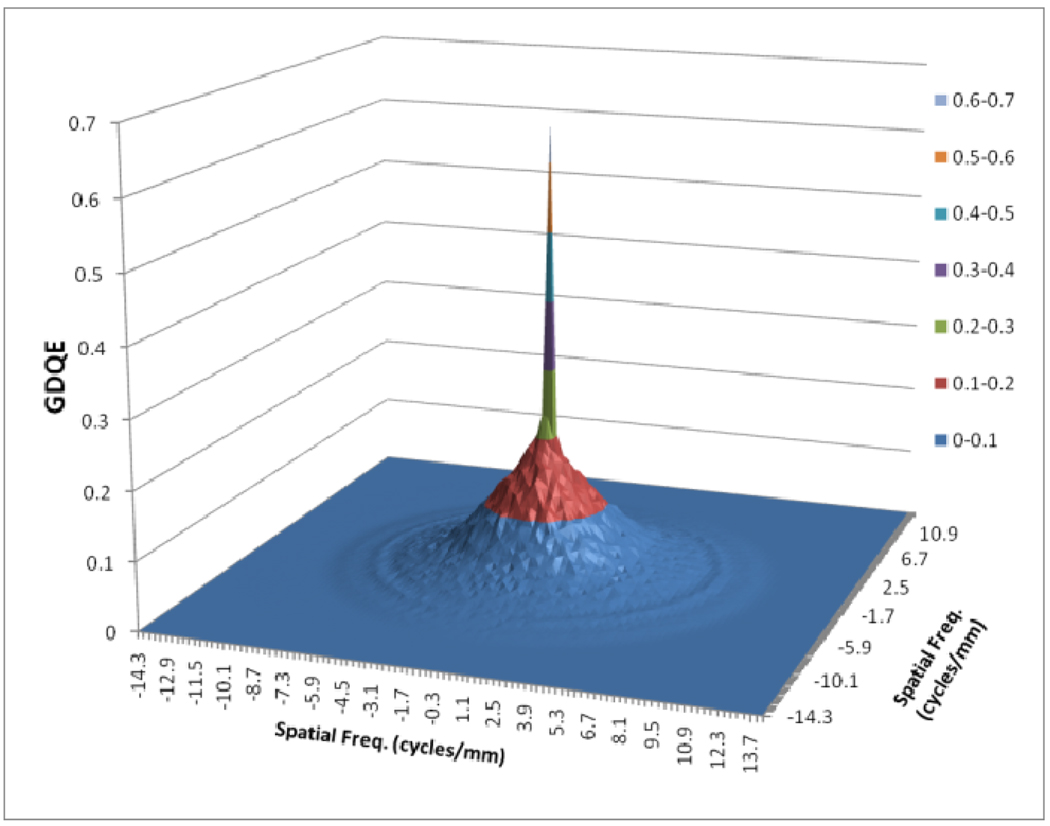
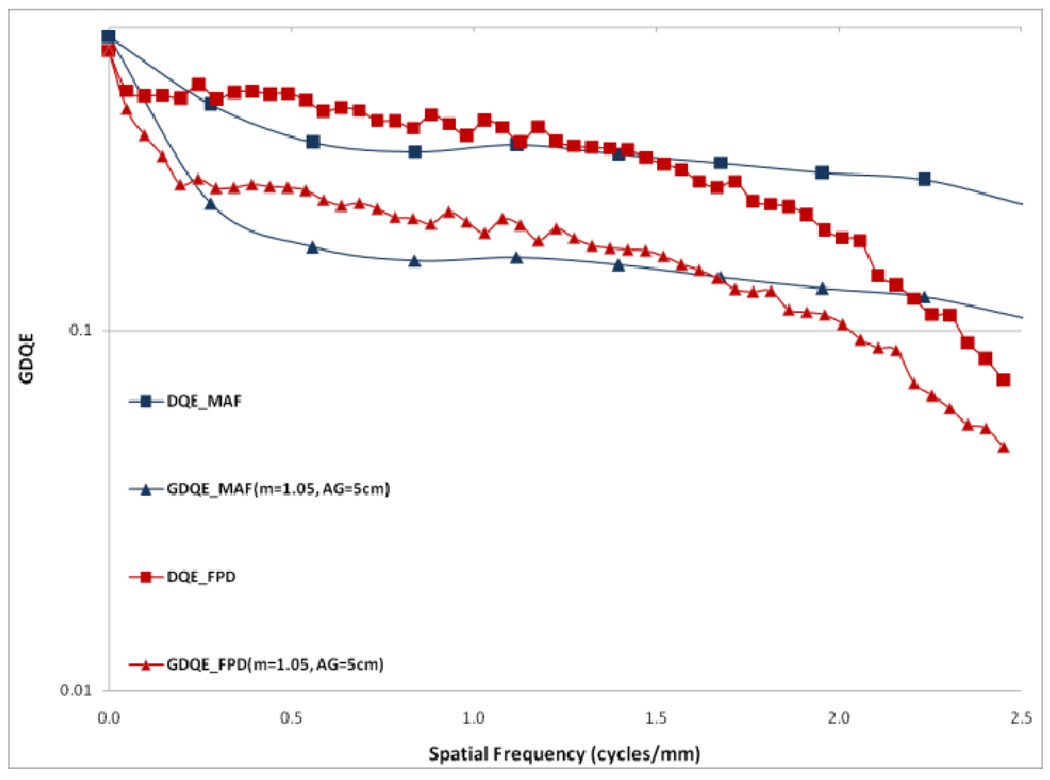
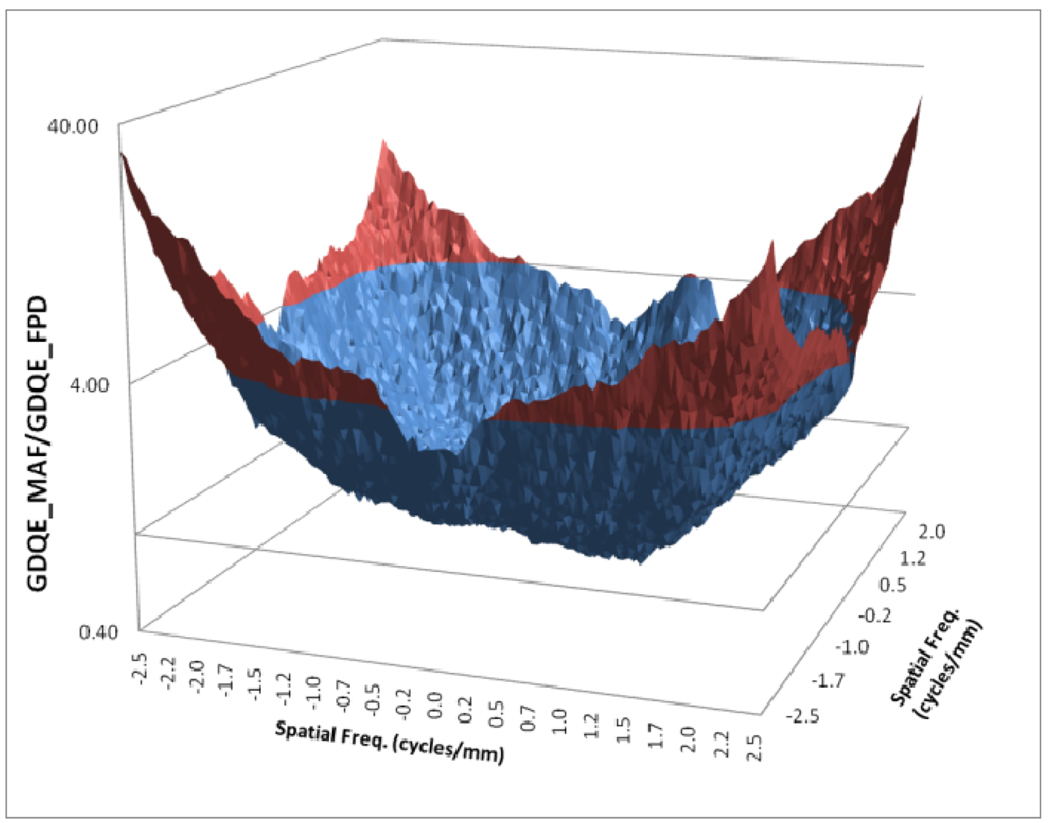
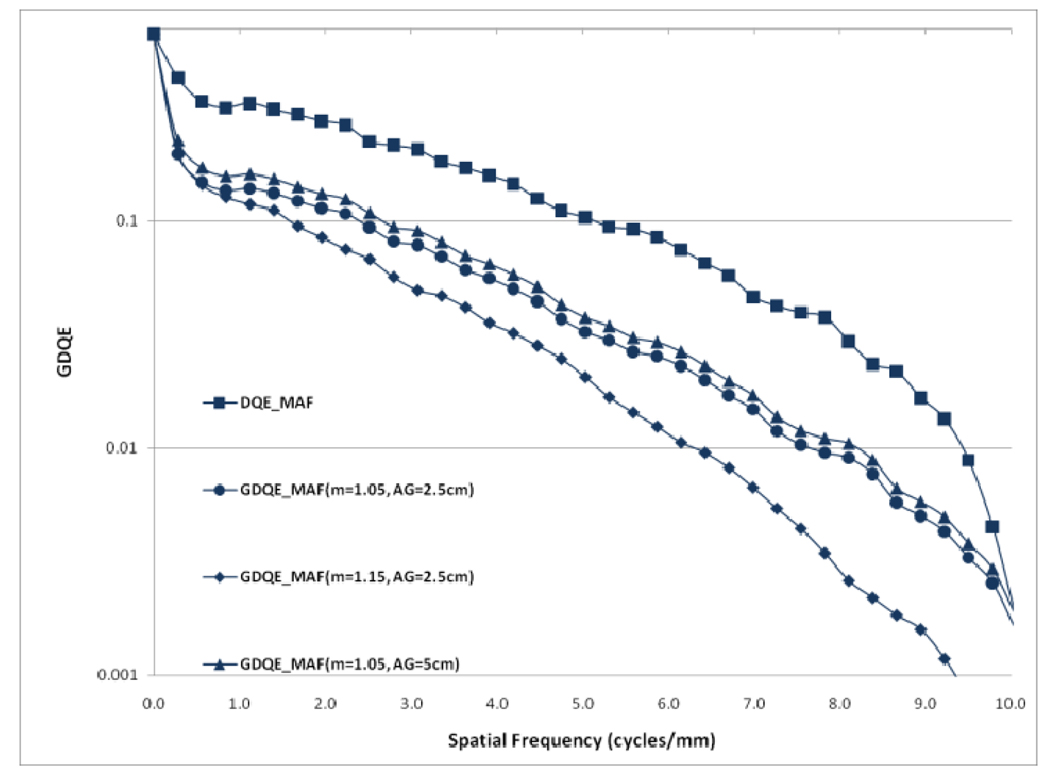
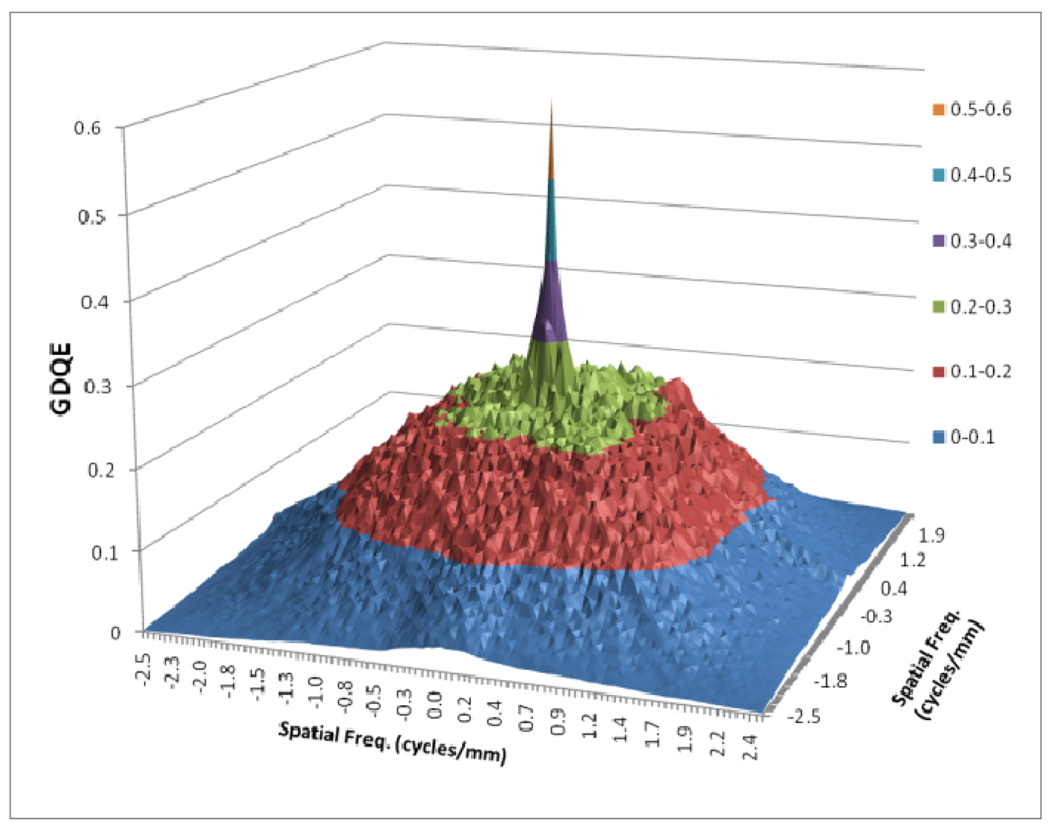
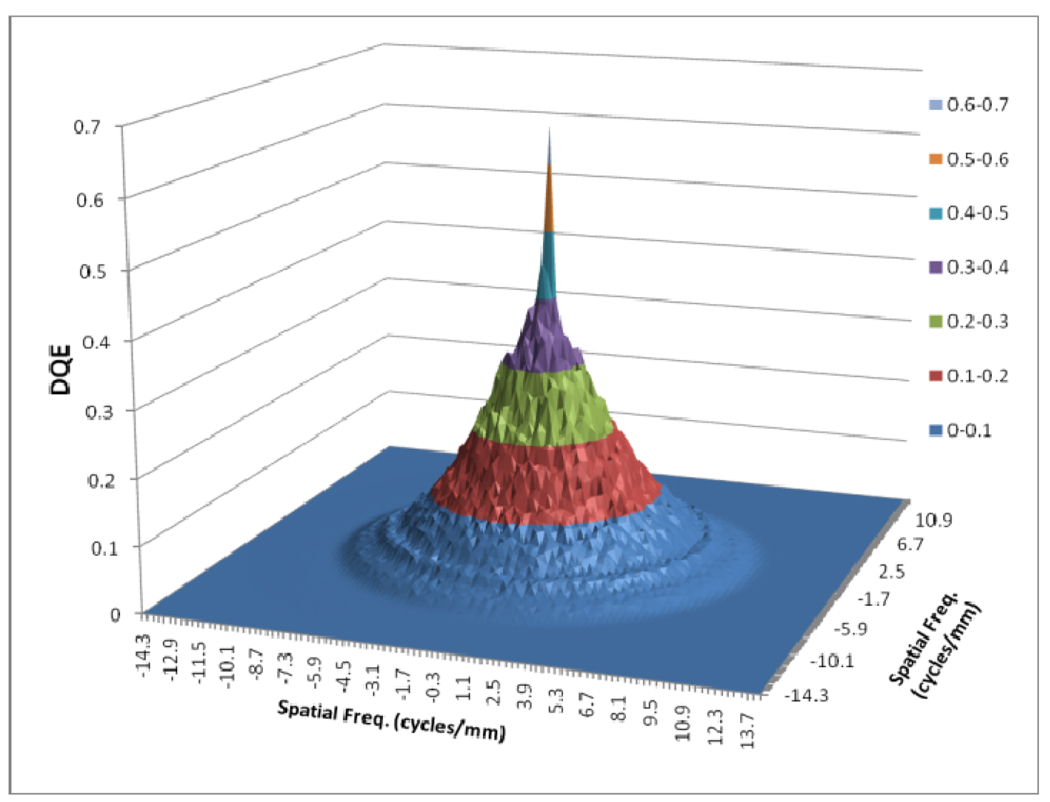
In figure 12, a comparison between the horizontal profile of MTFs for MAF and FPD is shown. The comparison is only shown up to the Nyquist frequency of the FPD. In figure 13 we plot the ratio of the GMTF for the MAF and FPD. Figs. 14–17 demonstrate the 2D DQE and GDQE (for m = 1.05 and air gap = 5 cm) for the FPD and the MAF. A comparison of their DQE and GDQE is shown in figure 18 and the ratio of their GDQEs calculated for the same magnification and air gap is shown in figure 19.
Fig. 12.
Comparison between MAF and FPD (GMTFs with small focal spot)
Fig. 13.
GMTF ratio for MAF and FPD (m=1.05, air-gap=5cm and small focal spot)
Fig. 14.
DQE for FPD
Fig. 17.
GDQE for MAF for m=1.05 and air gap=5 cm and small focal spot
Fig. 18.
DQE and GDQE for MAF and FPD (GDQEs with small focal spot)
Fig. 19.
Ratio of GDQEs for MAF and FPD for m=1.05, air gap=5 cm and small focal spot
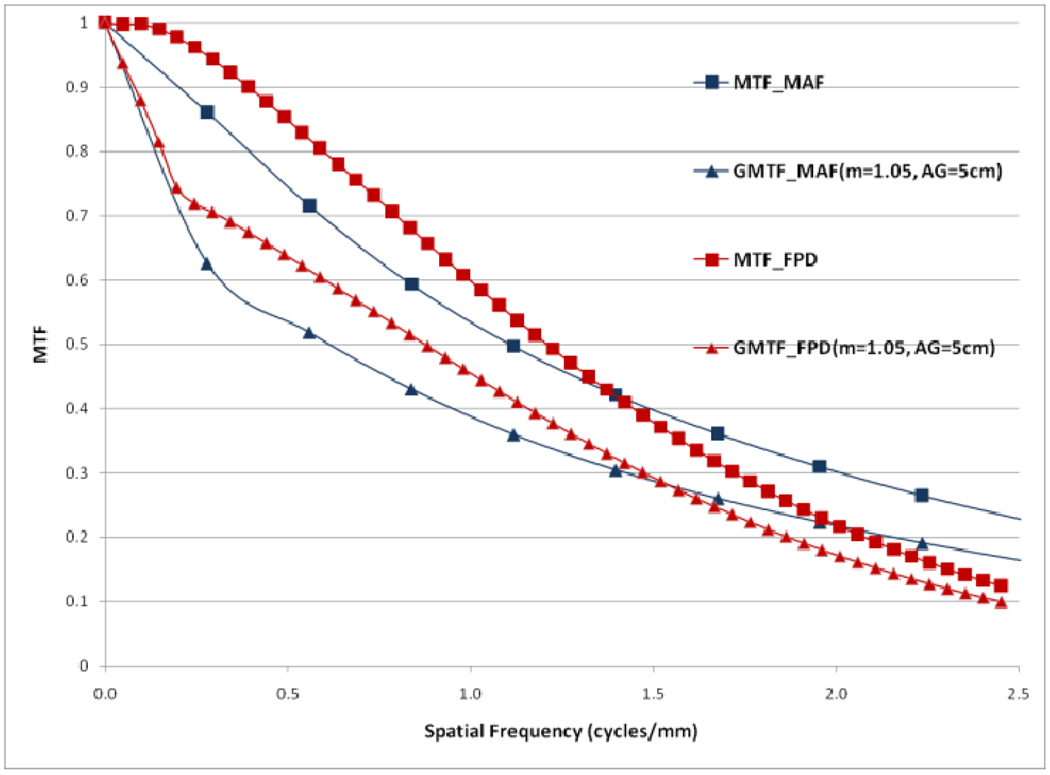
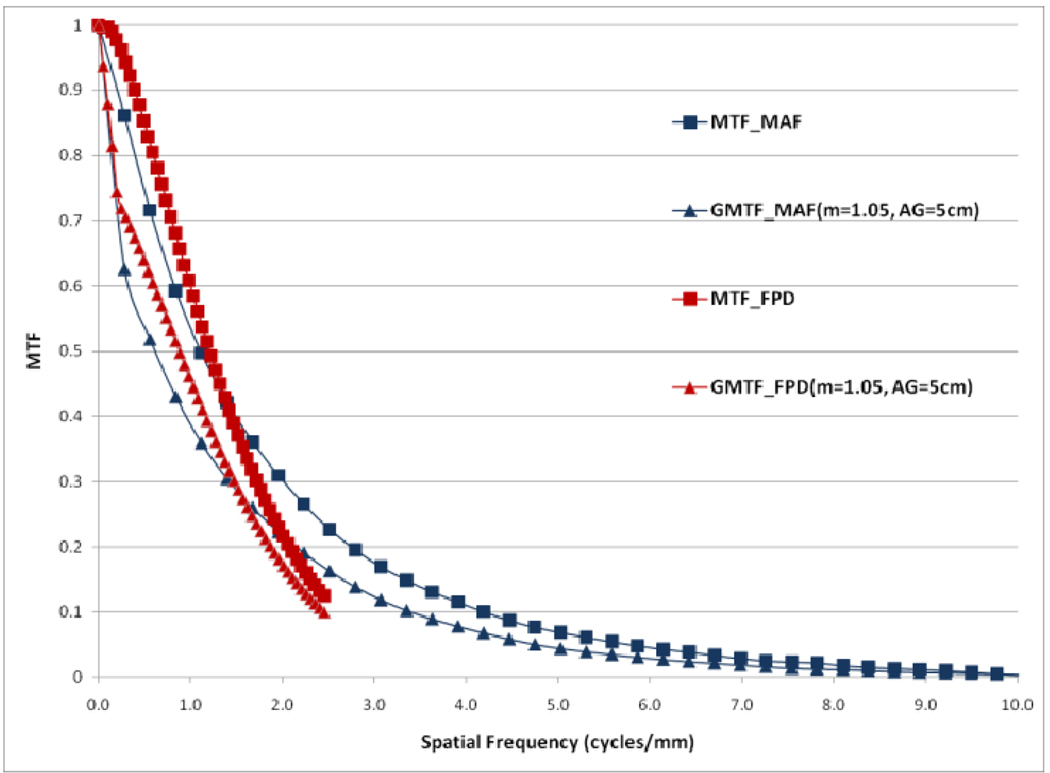
Fig. 20 shows the ID GMTF for MAF with magnification 1.15 and no scatter along with the detector MTF of MAF. An interesting comparison is shown in Fig 21 between the GMTF and MTF for the FPD and the MAF. It is clear in Fig. 21 that both MAF and FPD suffer low frequency drop because of scatter but for higher frequencies, the FPD is limited because of its lower Nyquist frequency. At the same time, the GMTF for the MAF shows that the MAF will exhibit improved resolution under the same clinical conditions.
Fig. 20.
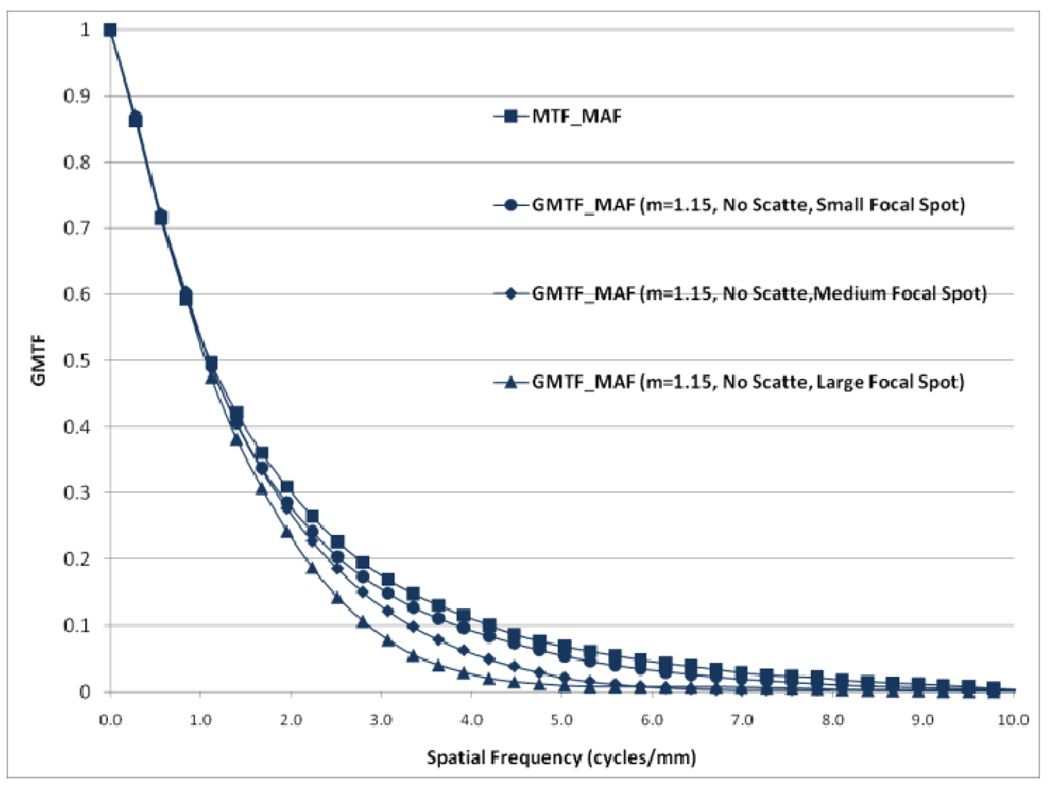
Effect of focal spot size on GMTF for MAF
Fig. 21.
Comparison of MTFs and GMTFs for MAF and FPD (GMTFs with small focal spot)
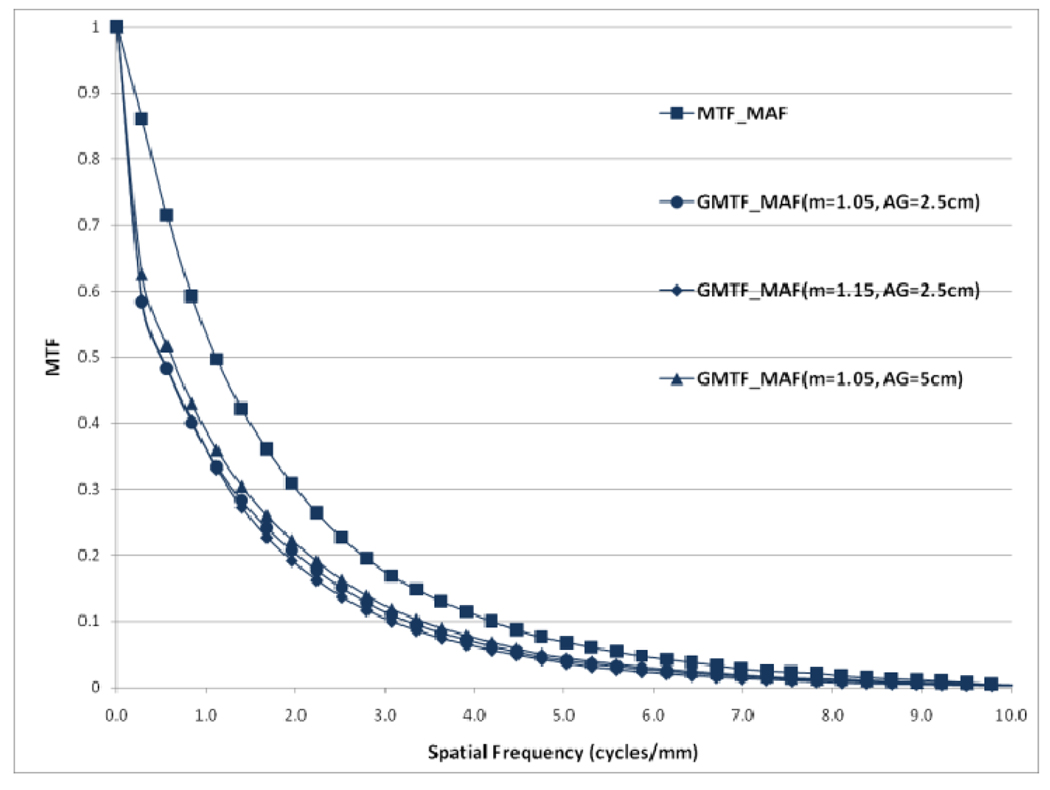
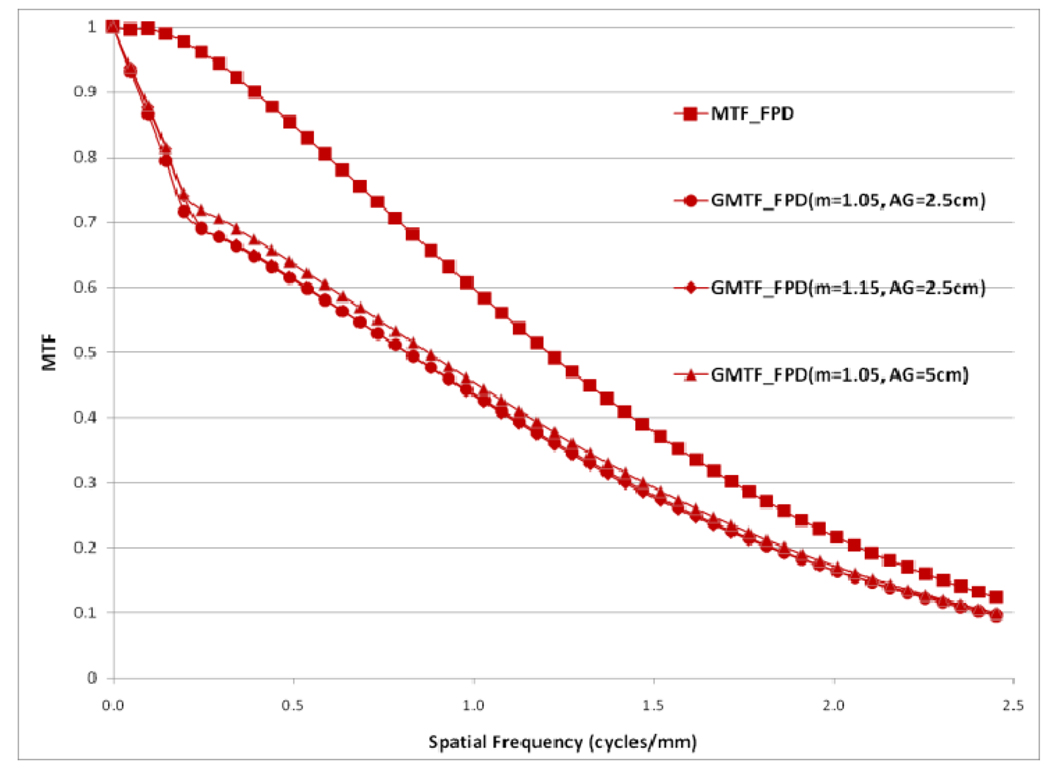
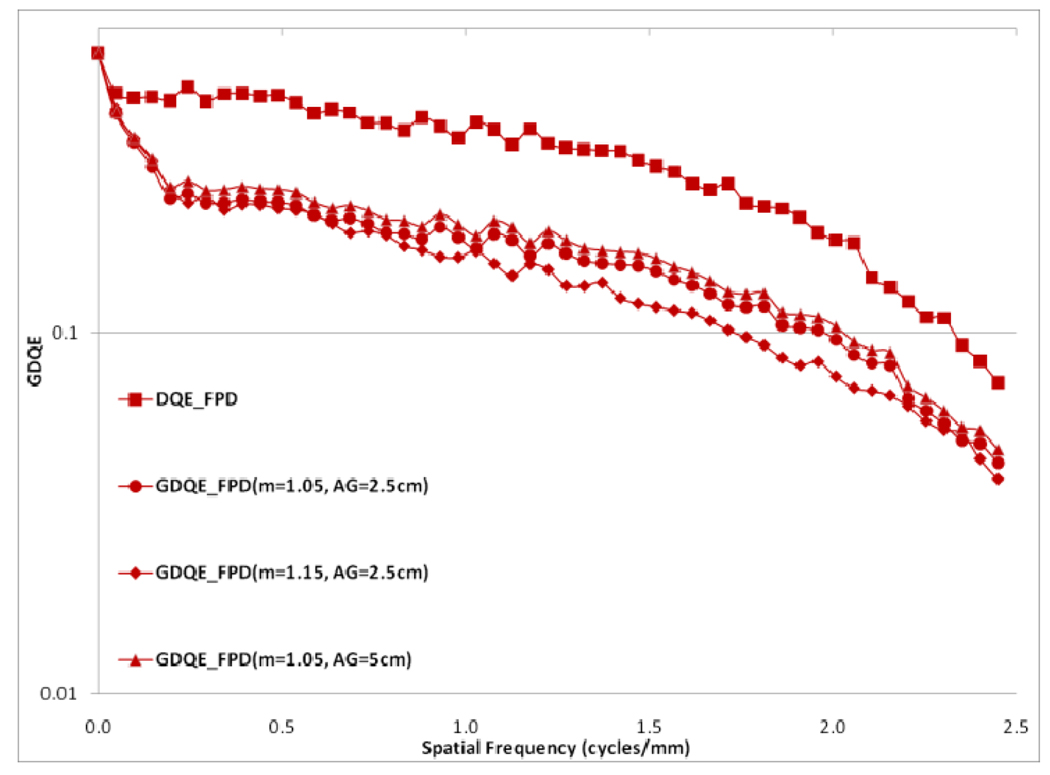
Choice of the air gap between the object and the detector effects the amount of scatter reaching the detector; the larger the air gap, the smaller the scatter fraction. The measured scatter fraction was 0.29 for the 2.5 cm air gap and 0.26 for the 5 cm air gap for the FPD. The scatter fraction measured for the MAF was 0.33 for the 2.5 cm air gap and 0.28 for the 5 cm air gap. Figures 22 and 23 show a comparison of different GMTFs calculated for various conditions to demonstrate the effect of air gap and magnification for the MAF and FPD, respectively. Figure 24 shows different GDQEs for the MAF calculated for various magnifications and air gaps. For the FPD, different GDQEs calculated for different combinations for magnification and air gap are shown in figure 25.
Fig. 22.
Comparison of GMTFs for MAF (small focal spot)
Fig. 23.
Comparison of GMTFs for FPD (small focal spot)
Fig. 24.
Comparison of GDQEs for MAF (small focal spot)
Fig. 25.
Comparison of GDQEs for FPD (small focal spot)
DISCUSSION
As shown in figure 4, the scatter MTF has only a low frequency component and it is clearly demonstrated that the presence of scatter produces a low spatial frequency drop in both the MTF and DQE. The focal spot unsharpness affects the MTF and DQE at higher spatial frequencies and the effect of focal spot blurring increases with magnification. Another important factor often overlooked in 1-D analysis is the non-isotropy introduced by the focal spot MTFs. Figures 5–7 show 2-D MTFs for three different sizes of focal spot. The small focal spot shows a somewhat isotropic 2-D MTF, while the medium and large focal spots have non-isotropic MTFs that give rise to non-isotropic GMTFs. Potential non-isotropy also may occur in the detector MTF, as illustrated for the FPD in Fig. 8.
The GMTF provides a metric for the resolution properties of the entire imaging system, including the effect of the patient (magnification and scatter) and x-ray tube (focal spot distribution). Figures 8–11 show the effect of focal spot blurring (for magnification 1.05) and scatter (air gap 5 cm) for both MAF and FPD. Figure 12 demonstrates the comparison of horizontal profile while figure 13 shows the ratio of GMTFs as a function of object spatial frequency. Both MAF and FPD show an initial drop for the GMTF because of the scatter term. For the same air gap the MAF shows slightly greater drop for lower spatial frequencies, due to the slightly large scatter fraction for the MAF in comparison to the FPD. The FPD has a lower scatter fraction with larger field of view because it has a grid which reduces the scatter fraction substantially. The GMTF for the FPD at lower spatial frequencies appears better than the MAF but the MAF shows substantially better performance at higher spatial frequencies because of higher detector MTF beyond the Nyquist of the FPD (2.5 cycles/mm). As shown in figure 12, where the MAF’s GMTF is shown only up to the 2.5 cycles/mm, the MAF starts performing better after around 1.5 cycles/mm. Figure 21 shows the comparison of GMTFs up to 10 cycles/mm. Here it is quite clear that the FPD is limited up to 2.5 cycles/mm because of its larger pixel size, while the MAF promises to work better even at higher spatial frequencies. Figure 13 shows the improvement in the GMTF for the MAF over the FPD as a function of spatial frequency. It indicates that the MAF has about 6 times better GMTF in comparison to the FPD at 2.5 cycles/mm.
Figures 22 and 23 present various GMTF curves calculated for different combinations of magnification and air gap for the MAF and the FPD separately. They clearly show the effect of magnification and scatter fraction on system MTF. The larger air gap reduces the scatter and hence the low frequency drop is less for the larger air gap. The effect of the focal spot size increases with increasing magnification. Figure 22 and 23 clearly illustrate that increasing magnification adversely affects the system resolution at higher spatial frequencies.
The effect of focal spot size is presented in figure 20. The GMTF for the MAF is calculated for three different focal spot sizes with the same magnification and no scatter. It shows that the choice of focal spot size is an important factor that greatly influences the system performance. The detector MTF and magnification is the same in all three cases but the choice of focal spot size plays a crucial role in determining the system performance especially at high spatial frequencies. We also observed some non-isotropy while studying 2-D system performance metrics. The 2-D MTF for the FPD was not completely symmetric and further non-isotropy was introduced by the focal spot MTF.
The DQE gives an absolute measure of the detector efficiency in detecting primary photons while the GDQE incorporates the effect of other system parameters and gauges the system performance with different clinical conditions. Figures 14–19 give a comparison of the GDQE of both detectors‥ The MAF shows a better performance compared to that of the FPD with a grid. The effect of focal spot and scatter on the GDQE was qualitatively similar to that on the GMTF and is shown in figures 24 and 25 for both detectors separately. Figure 18 shows a comparison of horizontal profiles of DQE and GDQE for the MAF and the FPD. It shows similar behavior as discussed for the GMTFs in figure 12. Figure 19 shows the ratio of GDQEs for the two detectors and demonstrates that the MAF does a substantially better job at higher spatial frequencies (up to 7 cycles/mm).
Results for the 2-D generalized system metrics gives an idea of the realistic performance of a detector in simulated clinical situation in which the detector’s performance is greatly modulated by the choice of the focal spot, magnification and air gap. This 2-D analysis also points out the inherent non-isotropy in detector and system performances metrics.
CONCLUSION
In the present study we evaluate the total system performance for a realistic situation where scatter, geometric un-sharpness and finite focal spot size have effects on the overall image quality. We observed that with the generalized approach, total system performance is shown to be substantially degraded in comparison to the intrinsic detector performance. Our results showed that the GDQE and GMTF both suffer a significant loss because of the finite size focal spot and scatter. With this 2D analysis we were able to investigate the underlying non-isotropy in different performance metrics which is overlooked when only one dimensional analysis is performed. Comparisons between GMTFs and GDQEs of the FPD and the MAF show that both detectors have similar performance up to the Nyquist frequency of the FPD; at higher frequencies the MAF maintains its superior imaging performance capabilities even with focal spot unsharpness and scatter.
Fig. 6.
Focal spot MTF for medium focal spot
Fig. 15.
GDQE for FPD for m=1.05 and air gap=5 cm and small focal spot
Fig. 16.
DQE for MAF
REFERENCES
- 1.Muntz EP. Analysis of the significance of scattered radiation in reduced dose mammography, including magnification effects, scatter suppression, and focal spot and detector blurring. Med. Phys. 1979;6(2):110–117. doi: 10.1118/1.594540. [DOI] [PubMed] [Google Scholar]
- 2.Krol JA, Bassano DA, Chamberlain CC, Prasad SC. Scatter reduction in mammography with airgap. Med. Phys. 1996;23(7):1263–1270. doi: 10.1118/1.597869. [DOI] [PubMed] [Google Scholar]
- 3.Doi K, Rossman K. The effect of radiographic magnification on blood vessel imaging with various screenfilm systems. Med. Phys. 1974;1(5):257–261. doi: 10.1118/1.1637304. [DOI] [PubMed] [Google Scholar]
- 4.Shaw CC, Liu X, Lemacks M, Rong JX, Whitman GJ. Optimization of MTF and DQE in magnification radiography - a theoretical analysis. In: Dobbins J, Boone J, editors. Physics of Medical Imaging; Proc. SPIE 3977.2000. pp. 466–475. [Google Scholar]
- 5.Kyprianou IS, Rudin S, Bednarek DR, Hoffmann KR. Study of Generalized MTF and DQE for a new Microangiographic System. In: Yaffe MJ, Flynn MJ, editors. Physics of Medical Imaging; Proc. SPIE 5368; 2004. pp. 349–360. [DOI] [PMC free article] [PubMed] [Google Scholar]
- 6.Kyprianou I, Rudin S, Bednarek DR, Hoffmann KR. Generalizing the MTF and DQE to include x-ray scatter and focal spot unsharpness: Application to a new micro-angiographic system for clinical use. Med. Phys. 2005 Feb;32(2) doi: 10.1118/1.1844151. [DOI] [PubMed] [Google Scholar]
- 7.Samei E, Ranger NT, Mackenzie A, Honey ID, Dobbins JT, III, Ravin CE. Effective DQE (eDQE) and speed of a radiographic systems: An experimental methodology. Med. Phys. 2009 Aug;36(8) doi: 10.1118/1.3171690. [DOI] [PMC free article] [PubMed] [Google Scholar]
- 8.Yadava GK, Kyprianou IS, Rudin S, Bednarek DR, Hoffmann KR. Generalized performance evaluation of X-ray image intensifier compared with a microangiographic system. In: Flynn MJ, editor. Physics of Medical Imaging; Proc. SPIE 5745; 2005. pp. 419–429. [DOI] [PMC free article] [PubMed] [Google Scholar]
- 9.Yadava GK, Kuhls-Gilcrist AT, Rudin S, Patel VK, Hoffmann KR, Bednarek DR. A practical exposure-equivalent metric for instrumentation noise in x-ray imaging systems. Phys. Med. Biol. 2008;53:5107–5121. doi: 10.1088/0031-9155/53/18/017. [DOI] [PMC free article] [PubMed] [Google Scholar]
- 10.Ionita CN, et al. Implementation of a high-sensitivity Micro-Angiographic Fluoroscope (HS-MAF) for in-vivo endovascular image guided interventions (EIGI) and region-of-interest computed tomography (ROI-CT). Proc Soc SPIE; 2008. p. 6918. [DOI] [PMC free article] [PubMed] [Google Scholar]
- 11.AAPM Report No. 60. Report of Task Group 4, Diagnostic x-ray imaging committee. 1998. Instrumentation requirements of diagnostic radiological physicists (Generic Listing) [Google Scholar]
- 12.Dobbins JT, III, Ergun DL, Rutz Lois, Hinshaw DA, Blume H, Clark DC. DQE (f) of four generations of computed radiography acquisition devices. Med. Phys. 1995;22(10):1581–1593. doi: 10.1118/1.597627. [DOI] [PubMed] [Google Scholar]
- 13.Cunningham IA. Chapter 2. In: Beutel J, Kundel HL, Van Metter RL, editors. Handbook of Medical Imaging. Vol. 1. Bellingham, WA: SPIE Press; 2000. pp. 79–162. [Google Scholar]
- 14.Zhao Wei, Ji WG, Debrie Anne, Rowlands JA. Imaging performance of a amorphous selenium based flatpanel detectors for digital mammography: Characterization of a small area prototype detector. Med. Phys. 2003;30:254–263. doi: 10.1118/1.1538233. [DOI] [PubMed] [Google Scholar]
- 15.Kuhls-Gilcrist AT, Jain A, Bednarek DR, Rudin S. Accurate MTF measurement in digital radiography using noise response. Med. Phys. 2010 doi: 10.1118/1.3284376. In Print. [DOI] [PMC free article] [PubMed] [Google Scholar]
- 16.Samei E, Flynn MJ, Reimann DA. A method for measuring the presampled MTF of digital radiographic systems using an edge test device. Med. Phys. 1998;25:102–113. doi: 10.1118/1.598165. [DOI] [PubMed] [Google Scholar]
- 17.Brezovich IA, Barnes Gary T. A new type of grid. Med. Phys. 1977;4(5):451–453. doi: 10.1118/1.594315. [DOI] [PubMed] [Google Scholar]
- 18.Boone JM, Arnold BA, Seibert JA. Characterization of the point spread function and modulation transfer function of scattered radiation using a digital imaging system. Med. Phys. 1986;13(2):254–256. doi: 10.1118/1.595906. [DOI] [PubMed] [Google Scholar]


