

Abstract
We describe a hierarchical multiscale computational approach based on molecular dynamics simulations, free energy-based molecular docking simulations, deterministic network-based kinetic modeling, and hybrid discrete/continuum stochastic dynamics protocols to study the dimer-mediated receptor activation characteristics of the Erb family receptors, specifically the epidermal growth factor receptor (EGFR). Through these modeling approaches, we are able to extend the prior modeling of EGF-mediated signal transduction by considering specific EGFR tyrosine kinase (EGFRTK) docking interactions mediated by differential binding and phosphorylation of different C-terminal peptide tyrosines on the RTK tail. By modeling signal flows through branching pathways of the EGFRTK resolved on a molecular basis, we are able to transcribe the effects of molecular alterations in the receptor (e.g., mutant forms of the receptor) to differing kinetic behavior and downstream signaling response. Our molecular dynamics simulations show that the drug sensitizing mutation (L834R) of EGFR stabilizes the active conformation to make the system constitutively active. Docking simulations show preferential characteristics (for wildtype vs. mutant receptors) in inhibitor binding as well as preferential enhancement of phosphorylation of particular substrate tyrosines over others. We find that in comparison to the wildtype system, the L834R mutant RTK preferentially binds the inhibitor erlotinib, as well as preferentially phosphorylates the substrate tyrosine Y1068 but not Y1173. We predict that these molecular level changes result in preferential activation of the Akt signaling pathway in comparison to the Erk signaling pathway for cells with normal EGFR expression. For cells with EGFR over expression, the mutant over activates both Erk and Akt pathways, in comparison to wildtype. These results are consistent with qualitative experimental measurements reported in the literature. We discuss these consequences in light of how the network topology and signaling characteristics of altered (mutant) cell lines are shaped differently in relationship to native cell lines.
Keywords: Epidermal growth factor receptor, Phosphorylation kinetics, Molecular dynamics, Molecular docking, Signal transduction, Stochastic dynamics
INTRODUCTION
The Erb family of receptors—the epidermal growth factor receptor (EGFR or ErbB1 or HER1), ErbB2 (or HER2), ErbB3, and ErbB4—activates a multi-layered network mediating crucial pathways leading to cell proliferation, differentiation, migration and altered metabolism,18,29,53,72 in response to activation of the receptor by the epidermal growth factor (EGF), transforming growth factor-α (TGF-α), and several other related peptide growth factors.18
Erb family of receptors are receptor tyrosine kinases (RTKs); RTKs are transmembrane glycoproteins with a cysteine rich ligand-binding extracellular domain, a transmembrane domain important in dimerization, and an intracellular tyrosine kinase domain with a tyrosine rich C-terminal tail.29,53 Activation of the ligand-binding domain by an extracellular ligand leads to homodimerization or heterodimerization among the members of the Erb family. The process of ligand-induced dimerization is now quite well understood, based on crystallographic studies.8,25 Precisely how this ligand-induced dimerization event is coupled to, and leads to, activation of the intracellular tyrosine kinase domain has also emerged from recent crystallographic studies.75 The crystal structure of the EGFRTK domain was first published in 2002, both alone and in complex with an inhibitor erlotinib,63 and displayed several unique features. While structural studies of the kinase domains from other RTKs (and protein kinases in general) have shown them to be catalytically inactive until an activation event such as ligand-induced dimerization causes them to become autophosphorylated within the activation loop29 and subsequently become locked into a characteristic ‘active’ conformation,47 members of the EGFR family appear to be unique in not requiring activation loop phosphorylation27 for their activity. The crystal structure of an unphosphorylated form of the EGFR kinase domain was found to be constitutively locked in the ‘active’ configuration.63 In a recent pioneering crystallographic study, it is suggested that the kinase domain of the EGFR is regulated by a direct allosteric stabilization of the ‘active’ conformation:75 specifically, the kinase–kinase contact through an asymmetric dimer interface allosterically promotes the active conformation. Indeed, such an interface is inferred from (and experimentally realized by) the presence of a high concentration of the kinase domain in the crystals. The study also reported a crystal structure of the V924R mutant of EGFRTK in an inactive form which aligned closely with a previously solved structure of wildtype EGFRTK bound to the inhibitor lapatinib.71 The mutation replaces a hydrophobic residue at the dimer interface with a charged group thereby destabilizing the dimer interface. As a consequence, the EGFRTK domain retains its inactive state and relaxes into an alternative crystallographic lattice which does not support the activating asymmetric dimer interface.
It is well established that alteration or over expression of EGFR and ErbB2—two (of 4) members of the ErbB family of RTKs—is correlated with a variety of clinical cancers.43,58 Hence, small molecule RTK inhibitors for EGFRTK and ErbB2 RTK are also of significant interest as cancer therapeutic drugs. Small molecule tyrosine kinase inhibitors (e.g., anilinoquinazoline compounds such as gefitinib and erlotinib), which are ATP analogues,2,3,34,46,51 have been shown to exhibit growth inhibitory effects against a wide variety of human tumors.13–17 The RTK inhibition approach has shown promise in some clinical trials, but results have been quite mixed.19 In particular, despite the promise in a small (demographic) sub-population with significantly advanced disease, clinical responses to gefitinib and erlotinib varied among population samples. Recently, somatic mutations L834R, L837Q, G685S, del L723-P729 ins S (there is an alternate clinical numbering scheme used in the literature with an offset of 24 residues according to which these mutations are denoted by L858R, L861Q, G719S, del L747-P753 ins S) in the EGFRTK domain were reported to correlate with the clinical response of gefitinib and erlotinib.9,38,42,48 In vitro, these EGFR mutants demonstrated enhanced tyrosine kinase activity in comparison to wildtype EGFR and increased sensitivity to inhibition.3,12,20,21,42,48,49,61
Although, the underlying biochemical basis involving the drug sensitivity to the mutations is still not clear, the remarkable sensitivity of cell lines carrying gefitinib sensitizing mutants appears not to be centered around inhibitor or ATP binding affinities, but rather on other biochemical mechanisms regulating the EGFRTK activity and EGF-mediated signaling.28 In a recent review, the ErbB signaling network is likened to a bow-tie-configured, evolvable network, displaying modularity, redundancy, and control circuitry.18 Under this framework, identifying the role and significance of drug sensitizing mutations of ErbB receptors would require a systems level understanding of the signaling network.31–33 This would prove to be of enormous value in effectively designing multikinase inhibitors in development for cancer therapy to target many points along the signaling pathway simultaneously.28,35 Evidence emerging from biochemical studies points to differential phosphorylation rates associated with different tyrosine phosphorylation sites in the receptor.1,36,61,70 Moreover, recent structural studies have indicated that the clinically identified mutations are able to alter the regulatory elements within the receptor such as bypassing the dimer-mediated activation step leading to constitutive activity. Therefore, implications of the effect of such mutations on preferential signaling can be crucial in shaping the signaling response in altered cell lines derived from cancer patients.
In this article, we adopt a multiscale modeling approach (see Flowchart 1 and Table 1) to study the dimer-mediated receptor activation characteristics of EGFRTK. Through these modeling approaches, we are able to extend the prior modeling of EGF-mediated signal transduction by considering specific EGFRTK docking interactions mediated by differential binding and phosphorylation of different C-terminal peptide tyrosines on the RTK tail. By modeling signal flows through branching pathways of the EGFRTK resolved on a molecular basis, we are able to transcribe the effects of molecular alterations in the receptor (e.g., mutant forms of the receptor) to differing kinetic behavior and downstream signaling response.
FLOWCHART 1.

Scheme for hierarchical multiscale simulations.
TABLE 1.
Summary of multiscale simulations.
| Scale | Method | Biological scope | Input | Output | Experimental validation |
|---|---|---|---|---|---|
| Å~nm fs~ns | Molecular dynamics (MD) simulations | Protein structure simulation | Structure, force-field, system parameters | Trajectory, hydrogen-bond tables, dominant motion, free energy | Crystal structure, mutation studies |
| Å~nm fs~ns | Free energy docking | Protein–ligand interaction | Protein conformations from MD simulation | Binding modes, binding affinities for inhibitor, ATP, peptide substrates | Crystal structure KM, KI values from affinity studies |
| nm~μm μs~s | Generalized Langevin dynamics, kinetic Monte Carlo | Protein intramolecular large-scale motion, protein–membrane interaction | Elastic Properties of membranes, persistence length of disordered protein chains | Time scale for C-terminal substrate tyrosine binding and for internalization | Micropipette, confocal microscopy, dielectric relaxation |
| μm ms~s | Transient system dynamics | Signal transduction | Initial expression levels, rate laws, kinetic parameters | Time course profiles, signal flow, sensitivity analysis | Pharmacological studies, mutant systems |
OVERALL SUMMARY OF METHODS
Our multiscale modeling strategy is depicted in the Flowchart 1 and Table 1, (here we provide a brief overview; detailed description is available in the supplementary information S1.1 to S1.6): our hierarchical scheme involves molecular dynamics (see also Section S1.1), free energy docking (see also Section S1.2), hybrid spatial and stochastic modeling69 (see also Sections S1.3 and S1.4), and their integration with existing deterministic network models of EGFR-mediated signal transduction (see also Section S1.5). Model approximations and scope are discussed in S1.6.
Molecular Dynamics (MD, see also S1.1)
Dynamics trajectories of fully atomistic, explicitly solvated systems of wildtype and L834R mutant EGFRTK are obtained and analyzed for specific stabilizing interactions such as hydrogen bonds and salt-bridges.
Molecular Docking (see also S1.2)
Molecular docking is used to predict ligand binding in the absence of a ligand-bound crystal structure and functional affinity data. We employ AutoDock, an automated docking tool designed to predict how small molecules, such as substrates or drug candidates, bind to a receptor of known 3-dimensional structure.45 The binding free energy is calculated based on the intermolecular energy between protein and ligands and torsional and solvation free energy of the ligands.45 We perform a global conformational search using a multiple conformation docking strategy, in which the protein flexibility is taken into account implicitly.
Signal Transduction (see also S1.3)
EGF stimulation in a cell results in the simultaneous activation of multiple pathways that are functionally interlinked.36,53,54 In the kinetic model we have employed, signaling through the EGFR is modeled by combining three published models and augmented by our own set of reactions and calculations (Section S1.3, Figs. S1 and S2). Phosphorylation and docking reactions are modeled according to Kholodenko et al.;37 the MAP kinase pathway reactions are modeled after Schoeberl et al.;57 Akt and PI3K activation are incorporated into the model as described in Brown et al.7 The similar parameterization and topology in these models allowed us to construct a consistent, stable, and comprehensive system with results in good agreement with published experimental data.52 Seventeen of these reactions are novel to this work and represent enhanced molecular resolution and detail in EGFR activation, phosphorylation, and docking reactions (Fig. 1 and Table 2). A detailed description of these reactions is provided in Sections S1 and S2. Using the system model, we calculate the state levels of well-known downstream indicators of cell growth and proliferation, such as phosphorylated ERK and Akt. Each output state is quantified according to peak response, total (integrated) state level, and the time elapsed until peak response.
FIGURE 1.

Phosphorylation model for EGFR. (v1) EGF binds reversibly to EGFR, which increases the receptor’s affinity for other ligand-bound receptors (v2). Basal levels of spontaneous dimerization also occur (v3, v4; not shown). ATP binds reversibly to the catalytic site of the receptor (v5). The transient ATP-bound EGFR must then encounter a free unphosphorylated peptide on either cytoplasmic tail in a diffusion-limited step (v8–v11). (v12) The receptor catalyzes autophosphorylation at either Y1068 or Y1173 (for clarity, only the Y1068 site is shown). Reactions with an asterisk denote more than one reaction involving similar kinetics but differing substrates (see Table 2).
TABLE 2.
Reaction mechanisms and parameterization for EGFR phosphorylation reactions.
| Reaction | Mechanism | Parameter values | Reference | ||
|---|---|---|---|---|---|
| v1 | [EGFR] + [EGF] ⇌ [EGFR:EGF] | kf = 3 × 10⁻⁷ M−1 s−1 | kr = 3.8 × 10⁻³ s−1 | Kholodenko et al.37 | |
| v2 | [EGFR:EGF] + [EGFR:EGF] ⇌ [EGFR2] | kf = 1 × 10⁻⁷ M−1 s−1 | kr = 0.1 s−1 | Kholodenko et al.37 | |
| v3a | [EGFR] + [EGFR] ⇌ [EGFR2] | kf = 1 × 10⁻⁷ M−1 s−1 | kf = 1 × 10⁻³ s−1 | Kholodenko et al.37, see S1.3 | |
| v5b | [EGFR2] + [ATP] ⇌ [EGFR2:ATP] | km = 2.4 × 10⁻⁸ M−1 | Brignola et al.5 | ||
| v8c | [EGFR2:ATP] ⇌ [EGFR2:ATP:Y1068] | kf = 6.51 × 10⁻⁵ s−1 | kr = 769 s−1 | Fan et al.23, see S1.3 | |
| v10d | [EGFR2:ATP] ⇌ [EGFR2:ATP:Y1173] | kf = 1.98 × 10⁻⁵ s−1 | kr = 48.1 s−1 | Fan et al.23, see S1.3 | |
| v12e |
|
kcat = 0.29 s−1 | Fan et al.23 | ||
| v14f |
|
kcat = 0.25 s−1 | Fan et al.23 | ||
| v16g |
|
Vmax = 4.5 × 10⁻⁷ M−1 s−1 | km = 5.0 × 10⁻⁸ M | Kholodenko et al.37 | |
An identical rate equation was employed for spontaneous dimerization of EGFR and EGFR:EGF (v4).
Identical rate equations were employed for ATP binding to EGFR2Y1068 (v6) and EGFR2Y1173 (v7).
An identical rate equation was employed for Y1068 binding to EGFR2Y1173-P:ATP (v9).
An identical rate equation was employed for Y1173 binding to EGFR2Y1068-P:ATP (v11).
An identical rate equation was employed for phosphorylation of EGFR2Y1173-P:ATP:Y1068 (v13).
An identical rate equation was employed for phosphorylation of EGFR2Y1068-P:ATP:Y1173 (v15).
Identical rate equations were employed for dephosphorylation of EGFR2Y1173-P (v17) and EGFR2Y1173-P (v18).
Intramolecular Diffusional Timescales of C-terminal Tail Tyrosines in Auto- and Trans-phosphorylation (see also S1.4)
Auto- as well as trans-phosphorylation of specific tyrosine sites in the C-terminal tail of the receptor involves diffusion of the particular tyrosine residue in the C-terminal tail to the active site of the EGFRTK. We model the tail diffusion as a freely joined chain (FJC) consisting of Kuhn segments.22 The diffusion coefficient of the tyrosine residue is then calculated using a reptation model22 (see S1.4). The reciprocal of the diffusional time of a specified tyrosine residue to reach the active site is taken as the kon for substrate binding.
Spatial Stochastic Model for Endocytotic Vesicle Nucleation (see also S1.5)
Clathrin mediated endocytosis is a major mechanism for the down regulation of activated receptor proteins. The assembly of a clathrin coat proceeds via a polymerization of clathrin trimers,55 which is observed to coat the endocytotic vesicle. However, it is believed that the clathrin coat alone may not be capable of inducing the required curvature in the membrane. Another protein, epsin, in fact plays a crucial role in inducing the curvature of the membrane.24,26 The protein epsin has binding sites in the clathrin lattice and also directly interacts with the membrane. This dual interaction together with the dual interaction of an adaptor protein Ap180 with clathrin and the membrane (Ap180 tethers the clathrin coat to the membrane) is believed to induce the vesicle nucleation and anchor the clathrin lattice to the budding vesicle. Recently, we developed the KMC-TDGL (kinetic Monte Carlo- time-dependent Ginzburg Landau) heterogeneous multiscale approach for studying membrane dynamical processes by combining two different phenomenological theories.69 Simulations performed using this approach yields the time evolution of the membrane undulations and deformation in response to the diffusion of membrane bound epsins and a timescale for the nucleation of an endocytotic vesicle. We calculate the timescale for epsin-induced endocytotic vesicle nucleation from our membrane simulations performed using the KMC-TDGL approach.69 We combine this timescale for nucleation with the timescales for signal transduction calculated using the network simulations (Section S1.3) to estimate an overall timescale for phosphorylated receptor internalization.
RESULTS
Dimer Mediated Activation of EGFRTK
We performed two 10 ns molecular dynamics (MD) simulations of the EGFRTK system in the active and the inactive conformations, respectively. Based on a comparison of the crystal structures—active: erlotinib-bound, wildtype,63 AMP-bound wildtype;75 inactive: lapatinib-bound wildtype,71 V924R mutant75—we conclude that the conformational switching from an inactive to an active conformation involves a rotation of the αC-helix of EGFRTK, and the shifting of the activation loop (A-loop) residues to make way for peptide and ATP binding. The recent study of Kuriyan et al.75 has implicated a dimer-mediated activation mechanism for the EGFRTK. That is, loss of interactions upon RTK dimerization leads to switching of the conformational state of the enzyme from inactive to active conformations. On this basis, we hypothesize that specific interactions (H-bonds and salt-bridges) between the residues of the αC-helix and those of the A-loop need to re-organize in the course of the conformational switching from inactive to active states. To elucidate the nature of these interactions, a hydrogen bond analysis focusing on the residues surrounding the A-loop, αC-helix, catalytic loop, and nucleotide-binding loop was carried out using CHARMM6 and VMD30 programs. The MD trajectories were first analyzed in CHARMM with a hydrogen bond cutoff of 2.4 Å and a cutoff angle of 150°. We generated a list of hydrogen bonds that were present in at least 60% of the trajectory. These hydrogen bonds were then visualized in VMD and any non-significant bonds were removed to reveal the stabilizing H-bonds. During the H-bond analysis, acidic and basic residues formed strong hydrogen bonds, similar to salt-bridges. The A-loop and αC-helix conformations were stabilized by internal hydrogen bonds (i.e., both the residues participating in the hydrogen bond are within the loop/helix), as well as external hydrogen bonds (i.e., one residue is in the loop/helix, the other is not). The residues participating in these stabilizing interactions are predominantly acidic and basic residues. A comparison of the specific interactions showed that the number of external interactions stabilizing the A-loop and αC-helix in the active conformations far out-numbered those in the inactive conformations (see Fig. 2 and Table 3). Intriguingly, the small number of stabilizing interactions holding the kinase in the inactive are predominantly located proximal to the dimer-interface residues (Table 3), which lends further credibility to the allosteric activation mechanism75 of the wildtype. Namely, that loss dimer-interface residues will alter the surrounding stabilizing bond network, which likely leads to the destabilization of the inactive conformation and triggers the conformational shift to the active conformation.
FIGURE 2.

Visualization of the stabilizing residues external to A-loop and αC-helix (shown in blue), dimer interface residues (shown in red) and clinical mutations (shown in green) of both the active (panel a) and inactive (panel b) EGFR tyrosine kinases. The A-loop is highlighted in sky blue while the αC-helix is shown in purple, the remainder of the protein is colored orange. The external stabilizing residues for the EGFR tyrosine kinases are numbered from 1–40, with 1–27 corresponding to residues in the active state while 28–40 correspond to the stabilizing residues in the inactive state. The stabilizing residues that are potentially affected by dimerization are highlighted in red boxes, and the residues that are potentially affected by the clinical mutations are highlighted in green boxes (See also Table 3). The inactive conformation has fewer stabilizing bonds holding the conformation stable: 13 stabilizing residues as opposed to 27 stabilizing residues. Therefore, the loss of interactions triggered by either mutation or dimerization will have a greater effect upon the stability of the inactive kinase and allow a conformation change. The numbered labels correspond to the residue numbers as follows: 1:672 2:679 3:721 4:728 5:732 6:734 7:737 8:738 9:740 10:741 11:743 12:744 13:745 14:808 15:810 16:812 17:832 18:834 19:836 20:838 21:840 22:843 23:845 24:848 25:851 26:867 27:932 28:738 29:740 30:742 31:744 32:753 33:812 34:813 35:834 36:836 37:846 38:848 39:851 40:865.
Table 3.
External stabilizing interactions in inactive and active conformations, dimer-interface residues, and clinical mutations.
| alphaC-helix | A-loop | ||
|---|---|---|---|
| Stabilizing Salt Bridges | |||
| Active | Inactive | Active | Inactive |
| 2 | 1 | 3 | 2 |
| Stabilizing H-bonds | |||
| 5 | 2 | 7 | 3 |
| alphaC-helix (Residues 729 to 743) | |||
| Active | Inactive | ||
| Stabilizing Salt Bridges | |||
| GLU 734 | LYS 851 | GLU 738 | LYS 836 |
| GLU 738 | LYS 721 | ||
| Stabilizing H-bonds | |||
| ASN 732 HN | SER 728 O | TYR 740 O | SER 744 HN,HG1 |
| GLU 738 OE1,2 | PHE 832 HN | MET 742 O | LEU 753 HN |
| TYR 740 O | SER 744 HG1 | ||
| VAL 741 O | VAL 745 HN | ||
| ALA 743 O | LEU 679 HN | ||
| Activation Loop (Residues 831 to 852) | |||
| Active | Inactive | ||
| Stabilizing Salt Bridges | |||
| LYS 843 | ASP 932 | LYS 836 | GLU 738 |
| GLU 848 | ARG 812 | GLU 848 | ARG 865 |
| LYS 851 | GLU 734 | ||
| Stabilizing H-bonds | |||
| PHE 832 HN | GLU 738 OE1,2 | LEU 834 HN | ASP 813 OD1 |
| LEU 834 O | ARG 812 HH12 | HIS 846 NE2 | ARG 865 HH11 |
| LYS 836 HZ2 | ASP 737 OD2 | LYS 851 O | ARG 812 HH11,21 |
| LYS 836 O,HN | VAL 810 HN,O | ||
| LEU 838 HN | ARG 808 O | ||
| ALA 840 HN | GLY 672 O | ||
| TYR 845 O,HN | TYR 867 HN,O | ||
| Dimer Interface Residues | |||
| L680 I682 L736 L758 V762 I917 Y920 M921 V924 M928 | |||
| Clinical Mutations | |||
| L834R del723-728 S744I L837Q E685G G695S | |||
Constitutive Activation of the L834R Mutant
The clinically relevant mutations del724-729, and L834R are structurally in distinct parts of the enzyme but overall both lead to enhanced activity.10,42,48,61 Our delineated pattern of stabilizing interactions in Table 3 serves as a platform for unifying the effects of these mutations at a structural level. The small number of stabilizing interactions holding the kinase in the inactive conformation also overlaps with the residues associated with several clinically relevant mutations. The deletion mutant interferes directly with the dimer interface and the R substitution of L at 834 as well as R substitution of Q in 837 destabilizes the specific (external H bonds) interactions associated with A-loop and αC-helix in the inactive but not the active conformations. Thus, these mutations have a deleterious effect (see Table 3) in stabilizing A-loop and αC-helix conformations in the inactive state, hence stabilizing the active conformation. Indeed, in one of our MD trajectories initiated from the active conformation of the wildtype monomer RTK, we observed the motion of the enzyme towards the inactive state in 10 ns. In this case, a key interaction between two residues in the αC-helix and the A-loop (salt-bridge between GLU851 and LYS734, see also Table 3) was broken. In stark contrast, a 12 ns MD trajectory of the L834R mutant system (under similar conditions) stayed stable in the active conformation. The collective evidence from these observations points to a constitutively active L834R mutant RTK system (i.e., activated in monomer and dimer states in the presence or in the absence of an EGF ligand) and a dimer-mediated activation of wildtype RTK (i.e., activated only in the dimer state in the presence of the EGF ligand).
Experimental observation of constitutive activation in the gefitinib-sensitive EGFR mutants has been recorded independently in several studies, which report significantly elevated basal phosphorylation (in the absence of the stimulating ligand) of the mutant systems in comparison to the wildtype.10,11,48,61
Ligand and Substrate Binding Affinities for EGFRTK
We determine the ATP and erlotinib binding modes and binding affinities based on our multiple conformations docking strategy (Section S1.2) and analyze several low-energy clusters of ligand conformations. For both wildtype and L834R mutant EGFRTK systems, one lead erlotinib binding conformation is found to be closely aligned with that in the crystal structure: the hydrogen bonds between the N1 of the quinazoline and Met769 are present and so is the interaction between Thr766 and the quinazoline nitrogen atom (N3). The binding modes for ATP and erlotinib are also consistent with the existing pharmacophore model for ATP binding to kinases.66,67,74 Significantly, a second binding mode, which has a higher affinity to the mutant kinase L834R, is revealed in our calculations. This mode still blocks the ATP binding pocket and in addition shows an additional interaction between erloitnib and the R834 residue. The effect is a higher calculated binding affinity for erlotinib binding to L834R (−9.4 ± 0.4 kcal/mol) in comparison to wild-type (−7.3 ± 0.5 kcal/mol).
In order to explore the C-terminal peptide-substrate-bound pre-catalytic conformation, we also dock EGFRTK substrate peptides to the catalytic site. First, we focus on an optimal peptide sequence EEEYFEL as a control. This optimal sequence is selected for a maximal value in kcat/KM among EGFRTK substrate peptides.60 Based on 500–1000 different genetic algorithm runs for docking of this peptide to EGFRTK, we select the best binding conformation for binding as one that yields the lowest binding free energy simultaneously with the correct orientation for the tyrosine binding into the active site. The latter criterion is essential in ensuring that kcat is not significantly compromised in obtaining a stronger binding. We depict in Fig. 3, the peptide conformation bound to the active site, which is seen to be ideally poised for a two-metal-ion catalyzed phosphoryl transfer from ATP to the bound tyrosine:44,64 i.e., the relative positions of the ATP, Mg2+ ions, and the catalytic aspartates are in good alignment. Encouraged by this result, we performed peptide docking simulations for two substrate peptides (each being seven amino acids long) corresponding to the Y1068 (VPEYINQ) and Y1173 (NAEYLRV) sites of the C-terminal tail for both wildtype and L834R mutant structures. Based on a similar criteria of lower binding free energy and optimal catalytic geometry, we calculated the peptide binding affinity corresponding to sites Y1068 and 1173 for wildtype and L834R mutant systems. Upon mutation, the calculated KM for the Y1068 peptide decreased 20-fold (calculated ΔΔG [wildtype → L834R] = −2.2 kcal/mol), while the calculated KM for the Y1173 peptide increased 4-fold (calculated ΔΔG [wildtype → L834R] = +0.9 kcal/mol). Analysis of the binding modes reveals that the relative alignment of the tyrosine with respect to the catalytic site is ideal (2.2 Å in the observed distance ξ between Tyr OH oxygen and Asp 813 Oδ2) for the two peptide tyrosines binding to wildtype, with the two mutant systems showing a 0–1.5 Å deviation. The differences can translate into differences in kcat values associated with the tyrosine phosphorylation. Assuming a harmonic energy profile along the reaction coordinate ξ with a force constant Kξ, the work done in reducing this distance is given by 1/2Kξξ2. The value of Kξ is obtained by recording the fluctuations of ξ in the MD simulations (Kξ = kBT/σξ2 = 0.77 kcal/mol/Å2 for the wildtype and 1.01 kcal/mol/Å2 for L834R), where σξ is the standard deviation associated with the fluctuations in ξ in the trajectories). The normalized values of kcat/KM can then be compared for the four systems at the same value of ξ = 2.2 Å); the relative increase in kcat/KM: 1068 for the L834R in comparison to the wildtype is 20-fold (increase by 1-order of magnitude), while the relative decrease for the 1073 is 200-fold (decrease by 2-orders of magnitude). This differential sensitivity translates into differences in phosphorylation of the associated tyrosine sites, which ultimately leads to differential signaling and down stream activation in the EGFR network: the Y1173-phosphorylation is associated Shc mediated ERK activation and Y1068-phosphorylation is associated with Akt activation.36,61
FIGURE 3.
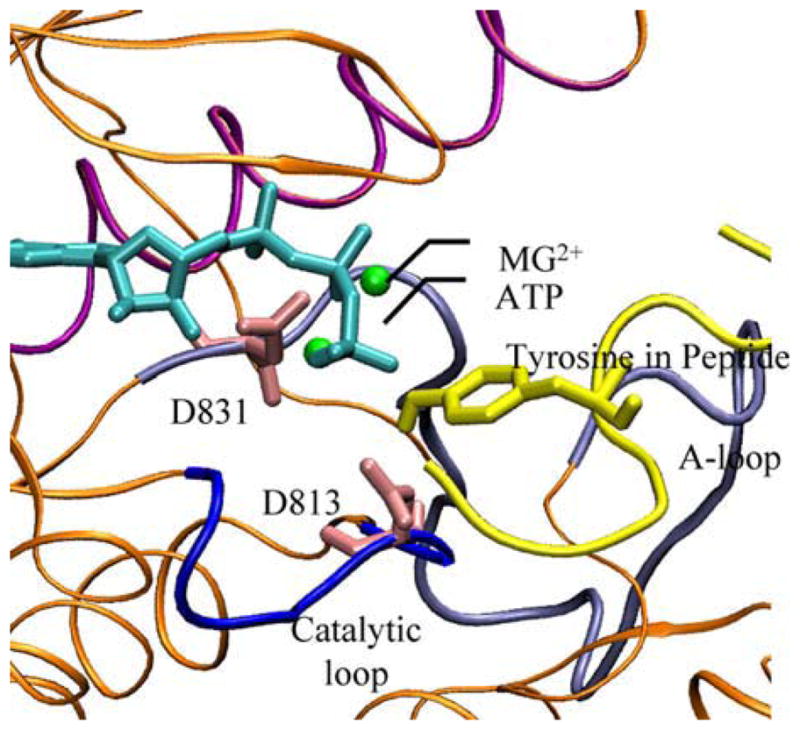
Binding modes for ATP (cyan) and the optimal peptide sequence (yellow) in the EGFRTK domain. The geometry of the active site is consistent with that prescribed for an ideal two-metal-ion catalyzed mechanism and reveals a state that is poised for the phosphoryl transfer reaction. The alignment of the two divalent Mg2+ ions as well as the catalytic aspartates D813 and D831 are also shown.
Time-scales Associated with Diffusion of Substrate Tyrosines Binding Prior to Auto- and Trans-phosphorylation and with Endocytotic Vesicle Nucleation
C-terminal Tail Diffusion
Using the method outlined in Section S1.4, we calculate the diffusional time scale for each of the seven tyrosine residues present on the C-terminal tail of EGFRTK to reach the active site (Table 4). The timescales for diffusion are in μs and not very different for the different tyrosine sites to bind to the active site prior to auto- (head) or trans- (tail) phosphorylation. For each case, the reciprocal of the corresponding timescale is taken as the on-rate (kon) of the tyrosine binding to the active site. The off-rate is calculated as koff = kon × exp(+ΔG/kBT), where ΔG is the binding free energy of the substrate to the active site; here it is assumed that the binding process is diffusion-limited with no significant additional barriers. The values for ΔG for each C-terminal tyrosine is obtained from the analogous data on peptide substrate affinities KM published in the literature:5,23 ΔG/kBT = −ln(KM). These calculated values are used in the model for signal transduction described in Section 2.3 and provided in Table 2.
TABLE 4.
Diffusional time for C-terminal tyrosines to reach the active site of EGFRTK.
| Tyrosine residue | Diffusional time to the active site (μs) |
|
|---|---|---|
| Head EGFRTK (auto-phosphorylation) | Tail EGFRTK (trans-phosphorylation) | |
| Y992 | 0.34 | 0.65 |
| Y1045 | 1.72 | 2.54 |
| Y1068 | 2.64 | 3.68 |
| Y1086 | 3.49 | 4.7 |
| Y1101 | 4.26 | 5.61 |
| Y1148 | 7.26 | 9.08 |
| Y1173 | 9.16 | 11.22 |
Endocytotic Vesicle Nucleation
In our earlier work, we identified different regimes conducive to nucleation of an endocytotic vesicle by exploring a range of parameters associated with the membrane adsorbed proteins, such as surface density of the protein on the membrane, and the intrinsic curvature of the membrane induced by the protein–membrane interaction.69 Here, we report our results specifically for epsins interacting with the membrane. Consistent with the experimental values of Ford et al., we assume that the intrinsic membrane curvature induced by the epsin molecules falls in the range of 10 μm−1. We further assume that the distance from a given epsin molecule that this curvature effect decays is four times the epsin diameter. A depiction of our findings for an epsin surface density (on the membrane) of 60 per μm2 is given in Fig. 4, in which in the time-course of 250–400 s, the nucleation of a vesicle is observed (see snapshots in panels B–D). Panels E and F provide the corresponding spatial and orientational correlations.69 The necessary condition for nucleation is the persistence of orientational (hexagonal) ordering of the membrane-adsorbed epsin molecules (see caption).69 Our results have suggested an interesting mechanism for the epsin-mediated membrane invagination. Namely, the invagination occurs through a nucleation event, which involves the co-localization and hexagonal ordering of several epsin molecules on the membrane. Based on our results (Fig. 4), the timescale for nucleation of such an event is 250–400 s.
FIGURE 4.

(a) Depiction of the system of epsin molecules interacting with the membrane. (b–d) Snapshots of the system at different time points (the epsin positions are not shown for clarity). The blue regions are recessed and red regions are elevated in the membrane. The nucleation of a budding vesicle in the membrane is evident in panel. (d, e) Spatial correlation function for the membrane adsorbed epsins. (f) Orientational correlation function for the membrane adsorbed epsins. The correlation functions are provided for 3 simulation runs at different epsin densities (ρ*, dimensionless) and values of the induced curvature (c0 expressed in μm−1). The value of a dimensionless density (ρ* = 0.024 corresponds to 60 epsins per μm2. The snapshots correspond to the red symbols in panels e and f (ρ* = 0.024 and c0 = 10 μm−1). For this case, there is persistence of orientational correlations (hexagonal ordering), see panel f. For the other two cases in panels e and f (for which snapshots are not shown), no nucleation and no significant orientational ordering is observed.
As described in Section 2.3, receptor activation, which is eventually followed by receptor internalization (via endocytosis), results in triggering many signal transduction cascades, one of which being the PLCγ pathway.4,72 The PLCγ pathway is accompanied by a transient release of calcium ions from intracellular stores. Models for the transient release of calcium have been developed on the basis of several published experimental studies.39,59 We work under the hypothesis that the signal transduction in the endocytosis pathway is coupled to membrane deformation via two functional interactions: (1) the direct induction of curvature via the interaction of the membrane lipids with epsin;24,50,56,62 and (2) through the assembly of the clathrin coat,56,73 which is triggered by an increase in the local concentration of Ca2+ ions released in the PLCγ pathway.4 In the latter case, above a threshold value of Ca2+ concentration the clathrin monomers spontaneously self-assemble to form a lattice.56,73 This leads to the following mechanism for endocytosis. The transient increase in calcium concentration at the site of the activated receptor helps promote clathrin polymerization and coat assembly. The adapter protein Ap180 tethers the clathrin lattice on the membrane. The vertices of the hexagonal lattice of the clathrin coat provide binding sites for epsins. Thus, in the vicinity of the activated receptor, the membrane adsorbed epsins assume a spatial conformation with persistent orientational correlations induced by the clathrin lattice. This provides the condition for a nucleation event leading to formation of the endocytotic vesicle. (We note that according to this mechanism, unactivated receptors can also internalize; however, in the absence of the transient calcium surge, which only occurs upon receptor activation, the clathrin coat assembly may represent a slower step).
An estimate for the timescale of receptor internalization τ(internalization) is therefore obtained by the sum of timescales for receptor phosphorylation at Y1045, PLCγ activation, calcium release, clathrin coat assembly, and nucleation of epsin-mediated vesicle formation.
Differential Signaling through EGFRTK
By employing the deterministic model described in Section 2.3 (see Figs. 1 and S1, Table 2) we have calculated transient evolution of the EGF-mediated signaling network under a variety of initial conditions and parameter values. In particular, we have focused on two pools of normal ([EGFR] = 100 nM or 33,000 receptors per cell) and over expressed ([EGFR] = 2000 nM or 660,000 receptors per cell) EGFR concentrations, each in the absence (serum starved, [EGF] = 0 nM) and presence (serum cultured, [EGF] = 8 nM) of the EGF ligand. A typical time-course resulting from our network simulations is provided in Fig. S3, in which the kinetics of phosphorylation of EGFRTK and down-stream markers Ras, Raf, PLCγ, PI3K, and Akt are depicted. Since our molecularly resolved model (Fig. 1) is currently focused on differential signaling through Y1068 and Y1173 phosphorylation sites of EGFRTK, we track the integrated response of ERK and Akt phosphorylation levels in our simulations. Each output state was quantified according to the peak level of phosphorylation over the simulated time of 1000 s. Specifically, we perform a two-dimensional scan over kcat/KM values associated with Y1068 and Y1173 phosphorylation in which the respective kcat/KM values are allowed to deviate from their default (wildtype) value over a logarithmic range of five log units. The result is a two-dimensional matrix in which each element represents output from a single simulation involving a unique pair of parameters (see Fig. 5).
FIGURE 5.

Calculated ERK and Akt phosphorylation levels in units of nM (peak-levels over the time course of 1000 s) under serum starved (EGF−) and serum cultured (EGF+) conditions for cell types with normal EGFR expression and EGFR over expression. In each panel the Y1173 rate of phosphorylation (kcat/KM) is varied along the x-axis (value relative to wildtype EGFRTK) and the Y1068 rate of phosphorylation (kcat/KM) is varied along the y-axis. In each panel, the blue circle denotes the wildtype levels and the green square denotes those relevant to the L834R mutant cell lines.
The simulated response of the EGFR network also enables us to estimate a timescale for receptor internalization τ(internalization). The typical timescale for EGFRTK phosphorylation is in the range of 10 s, while that for PLCγ activation is 50 s (see Figs. S3 and S4). The calcium release from intracellular stores through the activation of IP3R (IP3 receptors) is reported to occur within a short timescale of 10 s.59 While the timescale for clathrin coat self-assembly under high calcium concentration is not known, it is assumed here that this is a rapid process. According to our results from the spatial stochastic simulations (Section 3.4), the epsin mediated endocytotic vesicle nucleation in the presence of the clathrin coat is calculated to occur in a timescale 250–400 s. Further, assuming that the stabilization of the budding endocytotic vesicle and the vesicle pinch-off process catalyzed by dynamin are not rate-limiting, the estimated time for vesicle internalization upon EGF ligand binding is ≈450 s (≈8 min). We note that these time-scales from our simulations are ball park estimates and we have not yet attempted a careful comparison with timescales from experimental measurements.
DISCUSSION AND CONCLUSIONS
Based on an integration of a large body of knowledge accumulated over the years, the modular nature of EGFR-mediated signaling has become apparent.18,31 Through a hierarchical multiscale modeling scheme, we have realized a molecular resolution to this system-level view, which can potentially augment our predictive as well as comprehensive capabilities and rationalize the changes in early signaling characteristics of altered and mutant cell lines. Our overall findings are summarized below.
Analysis of stabilizing interactions in our molecular dynamics simulations have corroborated a dimer-mediated activation mechanism for the EGFRTK. That is, loss of key stabilizing interactions in the inactive conformation of the kinase upon dimerization results in destabilizing the inactive state and triggering a conformational change to the active state. Moreover, our results point to a constitutively active L834R mutant. That is, even in a monomer state, the RTK of the L834R mutant system is stabilized in an active conformation and can trigger signaling through the EGFR network by auto-phosphorylation of its C-terminal tail tyrosine residues in an EGF (ligand) independent manner. These results are consistent with the existing biochemical data which have10,42,48,61,75 qualitatively shown that the phosphorylation of C-terminal tail tyrosines of the L834R mutant in the absence of EGF stimulation is comparable to wildtype values in the presence of EGF stimulation at EGF concentrations of 30–100 ng/ml.
Our results from the free energy docking simulations suggest enhanced binding of the inhibitor erlotinib to the L834R mutant system in comparison to wildtype binding. Our results also reveal preferential binding and phosphorylation of certain C-terminal tyrosine substrates (but not others) to the L834R mutant in comparison to the wildtype: that is, the calculated change in the turn over rate (kcat/KM) upon the L834R mutation is markedly different for the Y1173 peptide in comparison to the Y1068 peptide. This results in a differential sensitivity at the receptor level. Specifically, the estimated increase in kcat/KM for the Y1068 peptide is ~10-fold in comparison to a decrease of ~100-fold for the Y1173 peptide. Thus, we expect to see a net increase in phosphorylation of Y1068 and a net decrease in phosphorylation of Y1173 for the L834R mutant, in comparison to wildtype levels. The biochemical results of Sordella et al.61 and Chen et al.10 corroborate this view qualitatively; in these studies, the immunoblots measuring the degree of phosphorylated receptor at the Y1173 site show a modest decrease for the L834R mutant in contrast to a strong increase for the Y1068 site, both in comparison to their respective wildtype measurements.
Our systems level simulation illustrates how the altered affinities at the receptor level for the wildtype and L834R translates into changes in the downstream response. In Fig. 5, we explored how the variation in Y1173 and Y1068 phosphorylation affects the peak responses of ERK and Akt for two different EGFR concentrations, each in the absence or presence of EGF stimulation. The calculated responses for the wildtype values are highlighted by the blue circles at the origin of each of the panels. The responses for L834R are identified by the green square centered at a (kcat/KM)/(kcat/KM)wildtype value of 1/100 (−2 in log10 units) for Y1073 and 10 (+1 in log10 units) for Y1068. Owing to the constitutively active characteristic of the L834R mutant, the signals relevant for the L834R system (even in the absence of EGF) are analogous to those in the panels with EGF stimulation. As indicated by the color maps in these two scans, increasing the degree of phosphorylation of the Y1173 site (positive x-direction) leads to an overall increase in ERK response. This finding is consistent with our model which is based on Y1173 being an important docking site for the Shc and Grb-2 adaptors that lead to Ras activation and subsequent Erk phosphorylation. For normal EGFR expression, the calculated ERK response in the absence of EGF is low for the L834R mutant (0.01 nM) but negligible (zero) for the wildtype. In the presence of EGF the ERK response for L834R is 7-fold lower than that for the wildtype. For over expressed EGFR, the ERK activation is 7-fold higher in L834R compared to wildtype both in the presence as well as in the absence of EGF stimulation. Thus, ERk stimulation is higher in EGFR over-expressed cells. The Akt response relative to the wildtype is 2-fold higher for the mutant cells under no EGF stimulation and about the same under EGF stimulation for normal EGFR expression. The Akt response does not seem to be affected by mutation for high EGFR expression either in the presence or absence of EGF.
Our calculated responses for ERK and Akt signaling for normal EGFR expression agree with the qualitative experimental observations of Sordella et al.61 and Tracy et al.:65 namely, that the ERk stimulation levels decrease and the Akt levels are maintained for the mutant cells with normal EGFR expression levels. This preferential activation of Akt in L834R mutant cell lines observed in these experiments is consistent with the systems level predictions from our simulations. Moreover, our calculations predict that the preferential Akt activation is not featured in EGFR over-expressed cells.
In light of the overall agreement between simulations and experiment, we can begin to explore the origins of inhibitor sensitivity in L834R mutant cell lines. The enhanced sensitivity of erlotinib to L834R mutant arises from a combination of several effects: (1) the mutant system has a higher binding affinity to the inhibitor; (2) the constitutive activity of L834R deems the mutant to be a more potent target for therapeutic inhibition; (3) The differences in the predicted downstream response (between the wildtype and the mutant) accounted for by early signaling events can potentially lead to a divergent long-term behavior in the two systems causing a differential sensitivity to inhibition. More conclusive inferences from our modeling results can only be obtained after we consider the effect of other receptor states (namely, one in which Y845 is phosphorylated) and interactions with other Erb partners (see below), on down-stream signal response.
In conclusion, we have described the role of a hierarchical multiscale computational approach in resolving at a molecular level the systems-level model of EGFR-mediated signal transduction, to help rationalize the collective information emerging from biochemical, cell biology, and clinical studies. Our approach enables us to transcribe differences in molecular mechanisms as well as functional activity originating at the single molecule level into tangible differences in early signaling events. Therefore, subject to the well appreciated modeling limitations discussed in Section S1.6, this predictive capability is useful in differentiating signaling characteristics of mutant cell lines from the native wildtype case. This molecular-based refinement of the overall EGFR signal transduction model is a first attempt at untangling the differential nature of early signaling events triggered by receptor activation and their consequences in shaping the signal transduction in altered cell lines derived from different pathologies. A complete model, which is currently being pursued, will not only require resolving the differential characteristics of all of the tyrosine phosphorylation sites in EGFRTK and their associated substrate recognition properties in EGFR, but also the extension to other Erb family members in the context of homo-and hetero-dimers. Transactivation of EGFR occurring through ligand-induced receptor heterodimerization68 combined with a potential for differential signaling adds a palette of finer control elements in the ErbB-family signaling network. Indeed, recent studies have identified possible mutations in ErbB2 that may correlate with drug sensitivity in different cancers.40,41 The computational tools described here are ideal for assessing the likely effect of novel EGFR and ErbB2 mutations and determining whether the drug-sensitizing mutations implicated in non-small-cell lung cancer also occur in other cancers. We believe that our model driven approach will in the long-term significantly impact the optimization of future small molecule therapeutic inhibition strategies.
Supplementary Material
Acknowledgments
We are indebted to Mark A Lemmon for inspiring us to work on this problem and for numerous discussions. We also thank Ms. Sunghee Choi for her input. Funding for this work was in part from the Whitaker Foundation, and a NIH training grant through the Genomics and Computational Biology program at the University of Pennsylvania. Computational resources were provided in part by the National Center for Supercomputing Alliance under Grant DAC1103423 and National Partnership for Advanced Computational Infrastructure under Grant MCB060006.
Footnotes
ELECTRONIC SUPPLEMENTARY MATERIAL
The online version of this article (doi: 10.1007/s10439-006-9251-0) contains supplementary material, which is available to authorized users.
References
- 1.Albeck JG, et al. Collecting and organizing systematic sets of protein data. Nat Rev Mol Cell Biol. 2006;7(11):803–812. doi: 10.1038/nrm2042. [DOI] [PubMed] [Google Scholar]
- 2.Arteaga CL. Epidermal growth factor receptor dependence in human tumors: More than just expression? Oncologist. 2002;7(Suppl 4):31–39. doi: 10.1634/theoncologist.7-suppl_4-31. [DOI] [PubMed] [Google Scholar]
- 3.Arteaga CL, Truica CI. Challenges in the development of anti-epidermal growth factor receptor therapies in breast cancer. Semin Oncol. 2004;31(1 Suppl 3):3–8. doi: 10.1053/j.seminoncol.2004.01.006. [DOI] [PubMed] [Google Scholar]
- 4.Bhalla US, Iyengar R. Emergent properties of biological networks. Science. 1999;283:381–387. doi: 10.1126/science.283.5400.381. [DOI] [PubMed] [Google Scholar]
- 5.Brignola PS, et al. Comparison of biochemical and kinetic properties of type 1 receptor tyrosine kinase intracellular domains. J Biol Chem. 2001;277:1576–1581. doi: 10.1074/jbc.M105907200. [DOI] [PubMed] [Google Scholar]
- 6.Brooks BR, et al. Charmm – a program for macromolecular energy, minimization, and dynamics calculations. J Comput Chem. 1983;4(2):187–217. [Google Scholar]
- 7.Brown KS, et al. The statistical mechanics of complex signaling networks: Nerve growth factor signaling. Phys Biol. 2004;1:184–195. doi: 10.1088/1478-3967/1/3/006. [DOI] [PubMed] [Google Scholar]
- 8.Burgess AW, et al. An open-and-shut case? Recent insights into the activation of EGF/ErbB receptors. Mol Cell. 2003;12:541–552. doi: 10.1016/s1097-2765(03)00350-2. [DOI] [PubMed] [Google Scholar]
- 9.Carey KD, et al. Kinetic analysis of epidermal growth factor receptor somatic mutant proteins shows increased sensitivity to the epidermal growth factor receptor tyrosine kinase inhibitor, erlotinib. Cancer Res. 2006;66(16):8163–8171. doi: 10.1158/0008-5472.CAN-06-0453. [DOI] [PubMed] [Google Scholar]
- 10.Chen YR, et al. Distinctive activation patterns in constitutively active and gefitinib-sensitive EGFR mutants. Oncogene. 2006;25(8):1205–1215. doi: 10.1038/sj.onc.1209159. [DOI] [PubMed] [Google Scholar]
- 11.Choi SH, Mendrola JM, Lemmon MA. EGF-independent activation of cell-surface EGF receptors harboring mutations found in gefitinib-sensitive lung cancer. Oncogene advance online publication. 2006 doi: 10.1038/sj.onc.1209957. [DOI] [PubMed] [Google Scholar]
- 12.Chou TY, et al. Mutation in the tyrosine kinase domain of epidermal growth factor receptor is a predictive and prognostic factor for gefitinib treatment in patients with non-small cell lung cancer. Clin Cancer Res. 2005;11(10):3750–3757. doi: 10.1158/1078-0432.CCR-04-1981. [DOI] [PubMed] [Google Scholar]
- 13.Ciardiello F. Epidermal growth factor receptor tyrosine kinase inhibitors as anticancer agents [Review] [44 refs] Drugs. 2000;60:25–32. doi: 10.2165/00003495-200060001-00003. [DOI] [PubMed] [Google Scholar]
- 14.Ciardiello F, et al. Inhibition of growth factor production and angiogenesis in human cancer cells by ZD1839 (Iressa), a selective epidermal growth factor receptor tyrosine kinase inhibitor. Clin Cancer Res. 2001;7(5):1459–1465. [PubMed] [Google Scholar]
- 15.Ciardiello F, et al. ZD1839 (IRESSA), an EGFR-selective tyrosine kinase inhibitor, enhances taxane activity in bcl-2 overexpressing, multidrug-resistant MCF-7 ADR human breast cancer cells. Int J Cancer. 2002;98(3):463–469. doi: 10.1002/ijc.10230. [DOI] [PubMed] [Google Scholar]
- 16.Ciardiello F, et al. The role of EGFR inhibitors in non-small cell lung cancer [Review] [54 refs] Curr Opin Oncol. 2004;16(2):130–135. doi: 10.1097/00001622-200403000-00008. [DOI] [PubMed] [Google Scholar]
- 17.Ciardiello F, Tortora G. A novel approach in the treatment of cancer: Targeting the epidermal growth factor receptor [Review] [101 refs] Clin Cancer Res. 2001;7(10):2958–2970. [PubMed] [Google Scholar]
- 18.Citri A, Yarden Y. EGF-ERBB signalling: towards the systems level. Nat Rev Mol Cell Biol. 2006;7(7):505–516. doi: 10.1038/nrm1962. [DOI] [PubMed] [Google Scholar]
- 19.Couzin J. Cancer drugs – Smart weapons prove tough to design. Science. 2002;298(5593):522. doi: 10.1126/science.298.5593.522. [DOI] [PubMed] [Google Scholar]
- 20.Dancey J. Epidermal growth factor receptor inhibitors in clinical development [Review] [40 refs] Int J Radiat Oncol Biol Phys. 2004;58(3):1003–1007. doi: 10.1016/j.ijrobp.2003.07.011. [DOI] [PubMed] [Google Scholar]
- 21.Dancey JE. Predictive factors for epidermal growth factor receptor inhibitors-the bull’s-eye hits the arrow [Review] [31 refs] Cancer Cell. 2004;5(5):411–415. doi: 10.1016/s1535-6108(04)00122-9. [DOI] [PubMed] [Google Scholar]
- 22.Dill KA. Molecular Driving Forces. Garland Science; New York: 2003. p. 614. [Google Scholar]
- 23.Fan YX, et al. Ligand regulates epidermal growth factor receptor kinase specificity – Activation increases preference for GAB1 and SHC versus autophosphorylation sites. J Biol Chem. 2004;279(37):38143–38150. doi: 10.1074/jbc.M405760200. [DOI] [PubMed] [Google Scholar]
- 24.Farsad K, et al. Generation of high curvature membranes mediated by direct endophilin bilayer interactions. J Cell Biol. 2001;155:193–200. doi: 10.1083/jcb.200107075. [DOI] [PMC free article] [PubMed] [Google Scholar]
- 25.Ferguson KM, et al. EGF activates its receptor by removing interactions that autoinhibit ectodomain dimerization. Mol Cell. 2003;11:507–517. doi: 10.1016/s1097-2765(03)00047-9. [DOI] [PubMed] [Google Scholar]
- 26.Ford MGJ, et al. Curvature of clathrin coated pits driven by Epsin. Nature. 2002;419:361–366. doi: 10.1038/nature01020. [DOI] [PubMed] [Google Scholar]
- 27.Gotoh N, et al. A highly conserved tyrosine residue at codon 845 within the kinase domain is not required for the transforming activity of human epidermal growth-factor receptor. Biochem Biophys Res Commun. 1992;186:768–774. doi: 10.1016/0006-291x(92)90812-y. [DOI] [PubMed] [Google Scholar]
- 28.Grubmüller H, et al. A small molecular-kianse interaction map for clinical kinase inhibitors. Nat Biotechnol. 2005;3:329–336. doi: 10.1038/nbt1068. [DOI] [PubMed] [Google Scholar]
- 29.Hubbard SR, Till JH. Tyrosine kinase structure and function. Annu Rev Biochem. 2000;69:373–398. doi: 10.1146/annurev.biochem.69.1.373. [DOI] [PubMed] [Google Scholar]
- 30.Humphrey W, Dalke A, Schulten K. VMD – visual molecular dynamics. J Mol Graph. 1996;14:33–38. doi: 10.1016/0263-7855(96)00018-5. [DOI] [PubMed] [Google Scholar]
- 31.Janes KA, et al. A systems model of signaling identifies a molecular basis set for cytokine-induced apoptosis. Science. 2005;310(5754):1646–1653. doi: 10.1126/science.1116598. [DOI] [PubMed] [Google Scholar]
- 32.Janes KA, et al. The response of human epithelial cells to TNF involves an inducible autocrine cascade. Cell. 2006;124(6):1225–1239. doi: 10.1016/j.cell.2006.01.041. [DOI] [PubMed] [Google Scholar]
- 33.Janes KA, Lauffenburger DA. A biological approach to computational models of proteomic networks. Curr Opin Chem Biol. 2006;10(1):73–80. doi: 10.1016/j.cbpa.2005.12.016. [DOI] [PubMed] [Google Scholar]
- 34.Janmaat ML, et al. Response to epidermal growth factor receptor inhibitors in non-small cell lung cancer cells: limited antiproliferative effects and absence of apoptosis associated with persistent activity of extracellular signal-regulated kinase or Akt kinase pathways. Clin Cancer Res. 2003;9(6):2316–2326. [PubMed] [Google Scholar]
- 35.Jarvis LM. Battling breast cancer. Chem Eng News. 2006;84(32):21–27. [Google Scholar]
- 36.Jorrinssen RN. Epidermal growth factor receptor: Mechanism of activation and signaling. Exp Cell Res. 2003;284:31–53. doi: 10.1016/s0014-4827(02)00098-8. [DOI] [PubMed] [Google Scholar]
- 37.Kholodenko BN, et al. Quantification of short-term signaling by EGFR. J Biol Chem. 2004;274:30169–30181. doi: 10.1074/jbc.274.42.30169. [DOI] [PubMed] [Google Scholar]
- 38.Kobayashi S, Boggon TJ, Dayaram T, Jänne PA, Kocher O, Meyerson M, Johnson BE, Eck MJ, Tenen DG, Halmos B. EGFR mutation and resistance of non-small-cell lung cancer to gefitinib. N Engl J Med. 2005;352(8):786–792. doi: 10.1056/NEJMoa044238. [DOI] [PubMed] [Google Scholar]
- 39.Krauss G. Biochemistry of Signal Transduction and Regulation. 3. Weinheim: Wiley-VCH; 2003. p. xvi.p. 541. completely rev. [Google Scholar]
- 40.Lee JW, et al. ERBB2 kinase domain mutation in a gastric cancer metastasis. APMIS. 2005;113(10):683–687. doi: 10.1111/j.1600-0463.2005.apm_284.x. [DOI] [PubMed] [Google Scholar]
- 41.Lee JW, et al. Somatic mutations of ERBB2 kinase domain in gastric, colorectal, and breast carcinomas. Clin Cancer Res. 2006;12(1):57–61. doi: 10.1158/1078-0432.CCR-05-0976. [DOI] [PubMed] [Google Scholar]
- 42.Lynch TJ, et al. Activating mutations in the epidermal growth factor receptor underlying responsiveness of non-small-cell lung cancer to gefitinib [see comment] N Engl J Med. 2004;350(21):2129–2139. doi: 10.1056/NEJMoa040938. [DOI] [PubMed] [Google Scholar]
- 43.Mendelsohn J, Baselga J. The EGF receptor family as targets for cancer therapy. Oncogene. 2000;19(56):6550–6565. doi: 10.1038/sj.onc.1204082. [DOI] [PubMed] [Google Scholar]
- 44.Mildvan AS. Mechanisms of signaling and related enzymes. Proteins Struct Funt Gen. 1997;29:401–416. [PubMed] [Google Scholar]
- 45.Morris GM, et al. Automated docking using a lamarckian genetic algorithm and and empirical binding free energy function. J Comput Chem. 1998;19:1639–1662. [Google Scholar]
- 46.Moulder SL, et al. Epidermal growth factor receptor (HER1) tyrosine kinase inhibitor ZD1839 (Iressa) inhibits HER2/neu (erbB2)-overexpressing breast cancer cells in vitro and in vivo. Cancer Res. 2001;61(24):8887–8895. [PubMed] [Google Scholar]
- 47.Nolen B, Taylor S, Ghosh G. Regulation of protein kinases: controlling activity through activation segment conformation. Mol Cell. 2004;15(5):661–675. doi: 10.1016/j.molcel.2004.08.024. [DOI] [PubMed] [Google Scholar]
- 48.Paez JG, et al. EGFR mutations in lung cancer: Correlation with clinical response to gefitinib therapy [see comment] Science. 2004;304(5676):1497–1500. doi: 10.1126/science.1099314. [DOI] [PubMed] [Google Scholar]
- 49.Pao W, V, Miller A. Epidermal growth factor receptor mutations, small-molecule kinase inhibitors, and non small-cell lung cancer: Current knowledge and future directions. J Clin Oncol. 2005;23:2556–2568. doi: 10.1200/JCO.2005.07.799. [DOI] [PubMed] [Google Scholar]
- 50.Petrelli A, et al. The endophilin-CIN85-Cbl complex mediates ligand-dependent downregulation of c-Met. Nature. 2002;416:187–190. doi: 10.1038/416187a. [DOI] [PubMed] [Google Scholar]
- 51.Ritter CA, Arteaga CL. The epidermal growth factor receptor-tyrosine kinase: A promising therapeutic target in solid tumors [Review] [69 refs] Semin Oncol. 2003;30(1 Suppl 1):3–11. doi: 10.1053/sonc.2003.50027. [DOI] [PubMed] [Google Scholar]
- 52.Saso K, et al. Differential inhibition of epidermal growth factor signaling pathways in rat hepatocytes by long-term ethanol treatment. Gastroenterology. 1997;112(6):2073–2088. doi: 10.1053/gast.1997.v112.pm9178701. [DOI] [PubMed] [Google Scholar]
- 53.Schlessinger J. Cell signaling by receptor tyrosine kinases. Cell. 2000;103:211–225. doi: 10.1016/s0092-8674(00)00114-8. [DOI] [PubMed] [Google Scholar]
- 54.Schlessinger J. Common and distinct elements in cellular signaling between EGF and FGF receptors. Science. 2004;306:1506–1507. doi: 10.1126/science.1105396. [DOI] [PubMed] [Google Scholar]
- 55.Schmid SL. Clathrin-coated vesicle formation and protein sorting. Ann Rev Biochem. 1997;66:511–548. doi: 10.1146/annurev.biochem.66.1.511. [DOI] [PubMed] [Google Scholar]
- 56.Schmidt A, et al. Endophilin~I mediates synaptic vesicle formation by transfer of arachidonate to lysophosphatidic acid. Nature. 1999;401:133–141. doi: 10.1038/43613. [DOI] [PubMed] [Google Scholar]
- 57.Schoeberl B, et al. Computational modeling of the dynamics of MAPKinase cascade activated by surface and internalized receptors. Nat Biotechnol. 2002;20:370–375. doi: 10.1038/nbt0402-370. [DOI] [PubMed] [Google Scholar]
- 58.Shawver LK, Slamon D, Ullrich A. Smart drugs: Tyrosine kinase inhibitors in cancer therapy. Cancer Cell. 2002;1:117–123. doi: 10.1016/s1535-6108(02)00039-9. [DOI] [PubMed] [Google Scholar]
- 59.Sneyd J, Dufour JF. A dynamic model of the type-2 inositol trisphosphate receptor. Proc Natl Acad Sci USA. 2002;99(4):2398–2403. doi: 10.1073/pnas.032281999. [DOI] [PMC free article] [PubMed] [Google Scholar]
- 60.Songyang Z, et al. Catalytic specificity of protein-tyrosine kinases is critical for selective signalling. Nature. 1995;373:536–539. doi: 10.1038/373536a0. [DOI] [PubMed] [Google Scholar]
- 61.Sordella R, et al. Gefitinib-sensitizing EGFR mutations in lung cancer activate anti-apoptotic pathways. Science. 2004;305(5687):1163–1167. doi: 10.1126/science.1101637. [DOI] [PubMed] [Google Scholar]
- 62.Soubeyran P, et al. Cbl-CIN85-endophilin complex mediates ligand-induced downregulation of EGF receptors. Nature. 2002;416:183–187. doi: 10.1038/416183a. [DOI] [PubMed] [Google Scholar]
- 63.Stamos J, Sliwkowski MX, Eigenbrot C. Structure of the epidermal growth factor receptor kinase domain alone and in complex with a 4-anilinoquinazoline inhibitor. J Biol Chem. 2002;277(48):46265–46272. doi: 10.1074/jbc.M207135200. [DOI] [PubMed] [Google Scholar]
- 64.Steitz TA, et al. A unified polymerase mechanism for nonhomologous DNA and RNA polymerases. Science. 1994;266:2022–2025. doi: 10.1126/science.7528445. [DOI] [PubMed] [Google Scholar]
- 65.Tracy S, et al. Gefitinib induces apoptosis in the EGFRL858R non-small-cell lung cancer cell line H3255. Cancer Res. 2004;64(20):7241–7244. doi: 10.1158/0008-5472.CAN-04-1905. [DOI] [PubMed] [Google Scholar]
- 66.Traxler P, et al. Use of a pharmacophore model for the design of EGFR tyrosine kinase inhibitors: Isoflavones and 3-phenyl-4(1H)-quinolones. J Med Chem. 1999;42(6):1018–1026. doi: 10.1021/jm980551o. [DOI] [PubMed] [Google Scholar]
- 67.Traxler P, Furet P. Strategies toward the design of novel and selective protein tyrosine kinase inhibitors. Pharmacol Ther. 1999;82(2–3):195–206. doi: 10.1016/s0163-7258(98)00044-8. [DOI] [PubMed] [Google Scholar]
- 68.Waterman H, Yarden Y. Molecular mechanisms underlying endocytosis and sorting of Erb receptor tyrosine kinases. FEBS lett. 2001;490:142–152. doi: 10.1016/s0014-5793(01)02117-2. [DOI] [PubMed] [Google Scholar]
- 69.Weinstein J, Radhakrishnan R. A coarse-grained methodology for simulating interfacial dynamics in complex fluids: Application to protein mediated membrane processes. Mol Phys. 2006 doi: 10.1080/00268970600997580. in press. [DOI] [PMC free article] [PubMed] [Google Scholar]
- 70.Wolf-Yadlin A, et al. Effects of HER2 overexpression on cell signaling networks governing proliferation and migration. Mol Syst Biol. 2:54. doi: 10.1038/msb4100094. [DOI] [PMC free article] [PubMed] [Google Scholar]
- 71.Wood ER, et al. A unique structure for epidermal growth factor receptor bound to GW572016 (Lapatinib) Cancer Res. 2004;64:6652–6659. doi: 10.1158/0008-5472.CAN-04-1168. [DOI] [PubMed] [Google Scholar]
- 72.Yarden Y, Sliwkowski MX. Untangling the ErbB signaling network. Nat Rev Mol Cell Biol. 2001;2:127–137. doi: 10.1038/35052073. [DOI] [PubMed] [Google Scholar]
- 73.Ybe JA, et al. Clathrin self-assembly is mediated by a tandemly repeated superhelix. Nature. 1999;399:317–375. doi: 10.1038/20708. [DOI] [PubMed] [Google Scholar]
- 74.Zhang L, Carroll P, Meggers E. Ruthenium complexes as protein kinase inhibitors. Org Lett. 2004;6(4):521–523. doi: 10.1021/ol036283s. [DOI] [PubMed] [Google Scholar]
- 75.Zhang X, et al. An allosteric mechanism for activation of the kinase domain of epidermal growth factor receptor. Cell. 2006;125(6):1137–1149. doi: 10.1016/j.cell.2006.05.013. [DOI] [PubMed] [Google Scholar]
Associated Data
This section collects any data citations, data availability statements, or supplementary materials included in this article.