

Summary
Background
Malaria, a non-fatal disease if detected promptly and treated properly, still causes many deaths in malaria-endemic countries with limited healthcare facilities. National malaria mortality rates are, however, particularly difficult to assess reliably in such countries, as any fevers reliably diagnosed as malaria are likely therefore to be cured. Hence, most malaria deaths are from undiagnosed malaria, which may be misattributed in retrospective enquiries to other febrile causes of death, or vice-versa.
Aim
To estimate plausible ranges of malaria mortality in India, the most populous country where it remains common.
Methods
Nationally representative retrospective study of 122,000 deaths during 2001-03 in 6671 areas. Full-time non-medical field workers interviewed families or other respondents about each death, obtaining a half-page narrative plus answers to specific questions about the severity and course of any fevers. Each field report was scanned and emailed to two of 130 trained physicians, who independently coded underlying causes, with discrepancies resolved either via anonymous reconciliation or, failing that, adjudication.
Findings
Of all coded deaths at ages 1 month to 70 years, 3.6% (2681/75,342) were attributed to malaria. Of these, 2419 (90%) were rural and 2311 (86%) were not in any healthcare facility. Malaria-attributed death rates correlated geographically with local malaria transmission rates derived independently from the Indian malaria control programme, and rose after the wet season began. The adjudicated results suggest 205,000 malaria deaths per year in India before age 70 (55,000 in early childhood, 30,000 at ages 5-14, 120,000 at ages 15-69); cumulative probability 1.8% of death from malaria before age 70. Plausible upper and lower bounds (based only on the initial coding) were 125,000 to 277,000.
Interpretation
Despite inevitable uncertainty as to which unattended febrile deaths are from malaria, even the lower bound greatly exceeds the current WHO estimate of only 15,000 malaria deaths per year in India (5000 early childhood, 10,000 thereafter). This low estimate should be reconsidered, as should the low WHO estimate of adult malaria deaths worldwide.
Funding
US National Institutes of Health, Canadian Institute of Health Research, Li Ka Shing Knowledge Institute.
Introduction
Malaria still causes many deaths in malaria-endemic countries with limited healthcare facilities,1,2 but estimation of global and regional malaria mortality has been difficult for three reasons. First, the recorded case-fatality rate from malaria may be misleadingly low even in populations that still have high malaria mortality rates because the disease can be cured easily if treated promptly, so those episodes that are diagnosed properly will not be those that cause most of the deaths.2 Second, where health care facilities are limited, severe malaria in people who die of it without any medical attention is easily mistaken in retrospective enquiries for some other life-threatening fever; conversely, other febrile causes of death can be mistaken retrospectively for malaria. Lastly, in most rural areas where death from malaria is common, proper medical attention at the time of death is uncommon.3-4
India is the most populous country in which malaria remains common.1 The cases and deaths reported by the Indian Government are concentrated mainly in a few states in east and northeast India (the “high-malaria” states, mainly Orissa but also Chhattisgarh, Jharkhand, and the states in the north-eastern tip of India).5 Because it cures nearly all the cases it treats, the Indian national malaria programme observes only about 1000 malaria deaths per year, and excludes the large majority of all malaria deaths.6 The World Health Organisation (WHO) currently estimates that malaria causes only about 15,000 deaths per year in India (5000 childhood, 10,000 thereafter), but this too depends indirectly on the low death rates in diagnosed patients.1 Small studies in specific regions of India or in special sub-populations,6-14 such as children or pregnant women, cannot directly estimate national numbers of malaria deaths.
Here we provide direct estimates of the range that is plausible for the number of deaths caused by malaria in India, based on structured interviews with non-medical witnesses of the death in a nationally representative study of 122,000 deaths. Written narratives of the deaths were used by study physicians to assign probable causes.4, 15-17
Methods
Most deaths in rural India take place at home, without prior attention by any qualified healthcare worker, so most causes are not medically certified.3-4 Thus, other sources of information are needed to help determine the probable underlying causes. The Registrar General of India (RGI) has during the past decade introduced a form of “verbal autopsy” 15 into the RGI's nationally representative Sample Registration System (SRS), which monitors all deaths in 1·1 million homes. For each narrow age range, the proportion of all deaths in 2001-03 that the SRS attributed to malaria was multiplied by the United Nations estimate18 of the number of deaths from all causes to estimate national numbers of malaria deaths.
India was divided into about a million areas for the 1991 census, each with about 1000 inhabitants. For the SRS, the RGI chose 6671 such areas randomly in 1993, each with all individuals and their household characteristics then enumerated and with subsequent births and deaths (but not death causes) in those areas reliably enumerated twice yearly.4, 19 Since 2002, one of 800 non-medical graduates (trained by the RGI in appropriate fieldwork methods) has visited each SRS area periodically to record from families (or other informants) a written narrative, usually in the local language, of each death, plus answers to some standard questions about the death 4, 15-17 (including the course of any fever preceding death, ie, whether it was prolonged; severe; intermittent; associated with shivering). Random re-sampling and other fieldwork quality control methods were used routinely. This survey is part of the Million Death Study (MDS), which seeks to assign causes to all deaths in the SRS areas during the 13 years 2001-13;4, 15 see online Supplementary Information.
These individual narratives were later scanned as images and emailed randomly (given the language of the narrative) to at least two of 130 collaborating physicians trained in disease coding who, working independently, assessed the probable underlying cause of death, assigning to it an International Classification of Diseases (ICD-10) 3-character code.20 Coding physicians knew the state but not the district where the death occurred. Any differences between the two coders were resolved either by anonymous reconciliation between them (asking each to reconsider) or, for persisting differences, adjudication by a third physician.4,15-17, 21
The physician coders' training, and their written guidelines (available online 21) instructed them to use their best medical judgement as to whether death was from malaria, but advised them to exclude malaria if there was evidence of respiratory infection, diarrhoea, burning during urination, rash, blisters, heatstroke or evidence of other specific infection (see below). Physicians were advised to consider the course of the fever, e.g., acute onset of fever with shivering and advised that assignment of malaria should generally require, in addition, at least one of the following: jaundice, vomiting, breathlessness, decreased urine output, headache, convulsions or unconsciousness. Blood tests for malaria were rarely performed. Separate guidelines were provided for assigning deaths to each of several other specific infections, including tuberculosis, acute respiratory infection, typhoid, other diarrhoeal disease, meningitis, influenza, dengue and rabies. The training of the coders advised that these would generally take precedent over a possible diagnosis of malaria.
The malaria-attributed mortality in each of India's 600 districts was compared geographically with three independent measures of malaria. One was the slide Plasmodium falciparum rate, i.e., the percentage of P. falciparum positive blood slides from 1995-2005 in the routine blood parasite surveillance data collected in each district by the National Vector-Borne Disease Control Programme (NVBDCP).6, 22 Although the denominator in this ratio may depend on the local prevalence of malaria (i.e. the number of slides tested), similar nationwide geographic distributions were seen if a composite of various NVBDCP surveillance indices was used instead.22 The second measure was the number of clinically-confirmed slide-positive malaria deaths recorded in each state by the NVBDCP from 2000-05. Although most malaria deaths occur outside this program 5, 6 (as it generally cures those it finds to have malaria), the geographic distribution of the relatively few deaths that do occur is informative. Lastly, we examined the district-specific proportion of households in which any member was reported to have had a fever in the past two weeks in the District-Level Health Survey, a nationally representative survey of 700,000 households covering about 6000 individuals per district in 2002-03.23 Simple correlation coefficients were used, excluding districts where our study assigned no deaths to malaria. The geographic distribution of malaria mortality in India as a whole was estimated from the malaria-attributed mortality in the SRS areas by smoothing (kriging 24) the results from the 5335 study areas with some malaria-attributed mortality, mapped to the locations of their PIN code addresses. Use of the data from all 6671 SRS areas to estimate district-based mortality rates yielded similar nationwide patterns.
Cause of death assignment is particularly difficult in old age, and the proportion of total deaths without a classifiable cause rises sharply after age 70.4, 15, 25-26 Thus, the major analyses are of deaths below age 70, with those at older ages considered separately. The SRS enumeration of all deaths slightly underestimates overall Indian adult mortality rates 27-28 and, in addition, our survey failed to interview informants for about 12% of the SRS-enumerated deaths. To estimate absolute numbers of malaria-attributed deaths, we therefore multiplied the 2005 United Nations estimates of age-specific numbers of deaths in India (irrespective of cause; 9.8 million total deaths in 2005) 18 by the age-specific proportion of all deaths that was attributed to malaria in our study. As our study included such a large proportion of all deaths in the study areas, no material bias is likely from systematic differences between those included and those not. Similarly, although our age-specific proportions were weighted according to the SRS sampling fractions in the rural and urban parts of each state 19, this weighting made no material difference.
Role of the funding source
The study was funded by the US National Institutes of Health, Canadian Institute of Health Research, and the Li Ka Shing Knowledge Institute. The funding sources had no role in study design or conduct, or in data collection, analysis, or interpretation. PJ had full access to all data and final responsibility for the decision to submit for publication on behalf of all authors.
Results
Of the 122,291 deaths at all ages available for analyses, 4690 (3.8%) were initially attributed to malaria by one or other coder. Of these, 3657 (3·0%) were eventually accepted as malaria. A total of 2122 (1·7%) had been immediately attributed to malaria by both physician coders, so no subsequent reconciliation or adjudication was required, and a further 1535 (1·3%) were eventually assigned to malaria after the first two coders had initially disagreed, generally with one saying malaria and the other uncertain (see Supplementary Information). One of the key things that led coders to assign unattended febrile deaths to malaria rather than to other infectious diseases was fever of sudden onset with chills or shaking (and no other specific diagnosis); more definite evidence would have been highly desirable 29 but was, of necessity often not available, especially for unattended deaths.
The coders eventually accepted as malaria 3.6% (2681/75,342) of all deaths after the first month of life but before age 70. Nationally, this would indicate 205,000 malaria deaths per year before age 70 (55,000 in early childhood, 30,000 at ages 5-14 years and 120,000 at ages 15-69 years: Table 1). Based purely on random variation the 99% confidence interval for the national total before age 70 would be 195,000-215,000, although, as discussed below, random variation is not the main source of uncertainty. Although the malaria-attributed death rate was high in young children, it became comparably high in later middle age. The age-specific rates indicate an overall probability of 1·8% of dying from malaria before age 70, in the absence of other causes. About half of the 205,000 malaria-attributed deaths before age 70 occurred in a few high-malaria states, with just one such state, Orissa, accounting for over 50,000 (Figure 1). (Physicians coding in Oriya, the main language of rural Orissa, were slightly more likely to assign febrile deaths to malaria, and this excess accounts for about 5% of national malaria-attributed mortality in this study; but, some or all of the excess appropriately reflects the high malaria mortality in rural Orissa.) Of the malaria-attributed deaths before age 70, 90% were in rural areas and 86% were not in any sort of health facility (Table 1). Even at ages 15-59 only one in five malaria-attributed deaths occurred in a health facility (where diagnosis might have been reasonably reliable), and at younger or older ages even fewer did so.
Table 1. Malaria-attributed deaths in the present study and estimated national totals, by age.
| Study deaths, 2001-2003 | All India, 2005 | |||||||||
|---|---|---|---|---|---|---|---|---|---|---|
| Age range in years or (months; m) | Malaria / all coded deaths | Details of the malaria deaths | All deaths / population, millions: UN estimates18 | Estimated malaria mortality | ||||||
| Numbers attributed | Proportion malarial* | Died in a health facility | Rural area | 2 coders immediately agreed | Deaths (1000s) | Rate per 100 000 | Period risk, %† | |||
| <1 m ‡ | 4 / 10 892 | 0·0% | 0 | 3 | 3 | 1·0 / 27 | 0 | 44 | 0·22 | |
| 1-59 m | 587 / 12 260 | 4·2% | 44 | 562 | 354 | 1·3 / 101 | 55 | |||
| 5-14 | 349 / 3876 | 8·3% | 44 | 328 | 240 | 0·3 / 246 | 29 | 12 | 0·12 | |
| 15-29 | 388 / 9085 | 3·6% | 95 | 339 | 261 | 0·7 / 313 | 25 | 8 | 0·12 | |
| 30-44 | 319 / 10 863 | 2·5% | 73 | 279 | 228 | 0·9 / 222 | 22 | 10 | 0·15 | |
| 45-59 | 500 / 18 124 | 2·6% | 83 | 426 | 345 | 1·5 / 142 | 37 | 27 | 0·40 | |
| 60-69 | 538 / 21 134 | 2·5% | 31 | 485 | 304 | 1·5 / 49 | 37 | 75 | 0·75 | |
| Subtotal, ages 0-69 (lower, upper bounds) |
2685 / 86 234 (1735, 3511) |
2·9% (2·0, 3·7) |
370 - |
2422 - |
1735 - |
7·2 / 1100 - |
205 (125, 277) |
18 (12, 25) |
1·76 (1·02, 2·33) |
|
| 70 + | 972 / 36 057 | 2·7% | 36 | 858 | 387 | 2·6 / 30 | 71 | 236 | - | |
Notes: A total of 122 727 deaths were coded by two physicians, of which 436 were excluded because they were stillbirths or had missing age or gender, leaving 122 291 (86 234 before age 70 and 36 057 at older ages). See Supplementary table S4 for details of deaths assigned immediately by both physicians to malaria and by at least one physician, some of which were eventually assigned to other causes.
These percentages are weighted for state and for urban/rural status (which generally decreases them, albeit only slightly) and for each age range are multiplied by the United Nations-estimated number of all deaths in 2005 to estimate national malaria mortality.
Annual rate times duration of age range, except that the period risk for ages 0-69 calculated by summation of the age-specific period risks (thereby yielding the probability of death from malaria before age 70 if there were no other causes of death).
While we do not attribute any neonatal deaths to malaria nationally, review of these 4 cases found 2 were neonates with haematologic confirmation of malaria. Small numbers of neonatal deaths due to malaria have been reported elsewhere.48
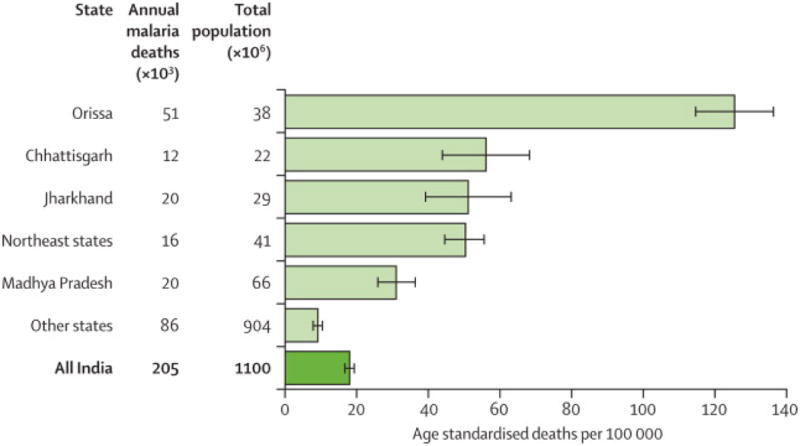
Figure 1. India, 2005: malaria mortality before age 70, by state.
Numbers of deaths (thousands, ages 0-69 years) and age-standardised rates (with 99% confidence intervals). Rates are standardised in 5-year age groups to total Indian population. The high-malaria states include 12% of national deaths from all causes and 47% of all-India malaria-attributed deaths before age 70. Apart from these, the only states in which at least 50 malaria deaths at ages 0-69 were recorded in our study (with all-India malaria deaths in thousands) include: Madhya Pradesh (20), Gujarat (12), Andhra Pradesh (10), Bihar (13), Rajasthan (12), Uttar Pradesh (19), Maharasthra (9) and other states (11).
To suggest plausible lower and upper national estimates, we tried considering only those deaths that were immediately coded by both physicians as malaria (1735 below age 70) and, at the other extreme, all deaths with malaria as the initial diagnosis by at least one coder (3511 below age 70), a quarter of which were eventually re-assigned to other causes. For ages 0-70 years, this results in a lower bound of 125,000 malaria-attributed deaths (99%CI 117,000-133,000, cumulative probability of malaria death by age 70 1.0%) and an upper bound of 277,000 (99%CI 265,000-289,000; cumulative probability 2·3%; see supplementary appendix).
Four correlations lend qualitative support to the present malaria-attributed mortality rates (see Supplementary Information). First, their proportional distribution across the major states was similar to that reported by the national malaria control program for the few slide-positive, clinically confirmed malaria deaths (total only 5647 deaths at all ages during 2000-2005; Table 2). Second, they varied seasonally (being higher some time after the wet season began), although perhaps not as extremely as might be expected for P. falciparum malaria. Third, they correlated geographically with the district-level P. falciparum transmission rates indicated independently by the Indian malaria control programme 5, 22 (Figure 2; r=0·59, p<0·0001) and with self-reported fever rates from nationwide district-level surveys of 700,000 households 23 in which a household informant was asked if any member had had any fever, malarial or not, in the past 2 weeks (not graphed; r=0·57, p<0·0001). In contrast, the rates of death our coders attributed not to malaria but to fever of unknown origin (ICD-10 code R50) did not correlate with these independent indicators (r<0·1, p>0·25). Finally, although our malaria-attributed mortality rates correlated well with national data on P. falciparum malaria, they did not correlate with national data on three diseases that might, in retrospective enquiries, be confused with malaria, namely dengue, typhoid, and meningitis (Figure 430). In the high-malaria states, our coders attributed far fewer deaths to the aggregate of all three of these diseases than to malaria.30
Table 2. Geographic variation in the Million Death Study (MDS) malaria-attributed deaths at ages 0-69 years and in the numbers of National Vector-Borne Disease Control Programme (NVBDCP) malaria deaths at any age, by state.
| State | MDS malaria-attributed deaths before age 70, 2001-03 | NVDCP slide-positive, clinically-confirmed malaria deaths, 2000-05 | ||
|---|---|---|---|---|
| No | % | No | % | |
| Orissa | 823 | 31% | 2102 | 37% |
| Northeast states | 468 | 17% | 1023 | 18% |
| Chhattisgarh | 131 | 5% | 109 | 2% |
| Jharkhand | 118 | 4% | 152 | 3% |
| Madhya Pradesh | 217 | 8% | 262 | 5% |
| All other states | 928 | 35% | 1999 | 35% |
| All India | 2685 | 100% | 5647 | 100% |
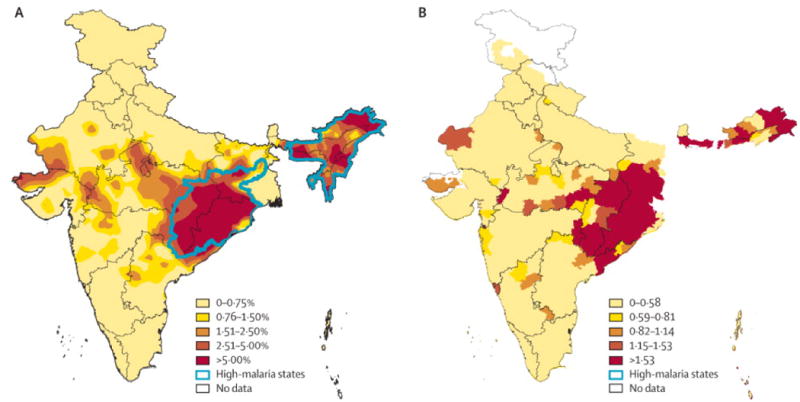
Figure 2. Geographic distributions of malaria-attributed mortality and slide P. falciparum rate.
(a) Percentage of 2001-2003 mortality attributed to malaria in this study at ages 1 month to 69 years. Mortality is plotted as the smoothed results from the 5335 study areas with some malaria-attributed mortality, mapped to the locations of their PIN code addresses. (b) District-level 1995-2005 slide falciparum rate from the National Vector-borne Disease Control Programme statistics.5, 22 High-malaria states comprise Orissa (OR), Jharkhand (JH), Chhattisgarh (CG) and Assam and all the smaller northeastern states except Sikkim (NE).
Figure 4. Reported cases (in 2006) of meningitis, typhoid and dengue infections and estimated malaria infections (in 1995-2005), per 10,000 population, by state.
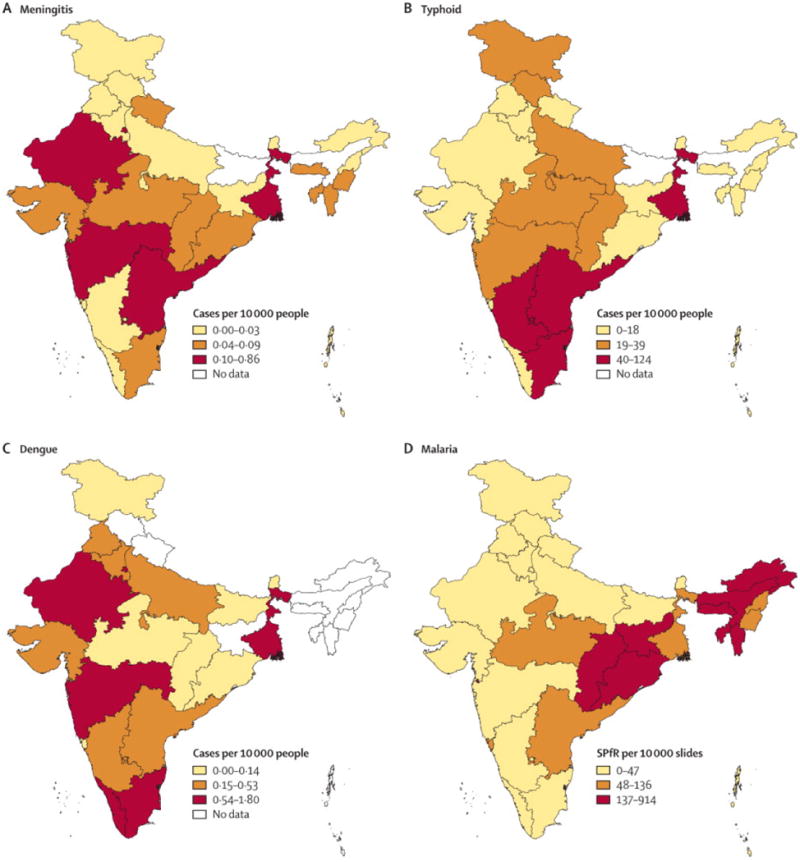
Total cases reported to the Government of India program of meningitis, typhoid and dengue are divided by total population for 2005 for that state and malaria cases are divided by total slides tested for malaria. Similar results are seen if reported deaths are plotted for each disease. Note that the scales differ for each disease.
Discussion
This study of written narratives of a large, nationally representative sample of all deaths indicates that malaria might well be a cause of about 200,000 deaths per year before age 70 in India (including 120,000 at ages 15-69), which is an order of magnitude greater than current WHO estimates.1 The range of reasonable uncertainty on both sides of the present estimate is inevitably wide, because the main contributor is febrile deaths of people who were never properly diagnosed or treated.
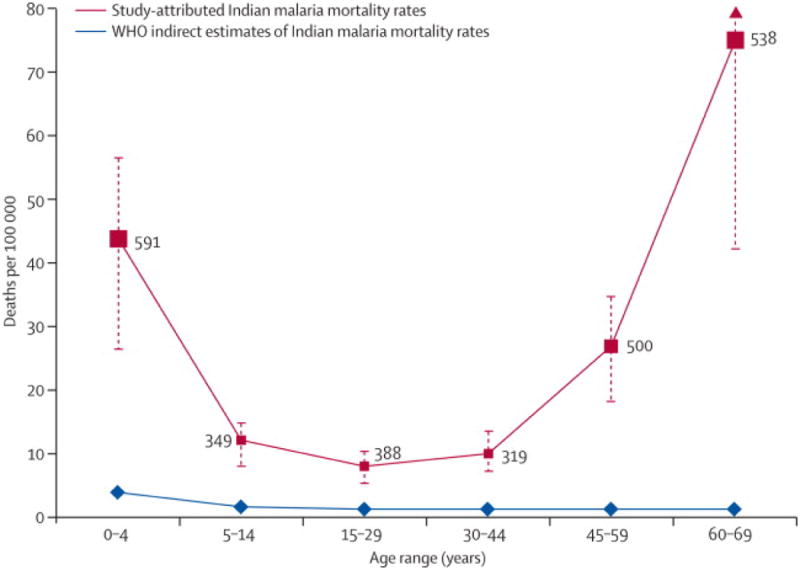
The U-shaped age-specific pattern of malaria-attributed mortality (Table 1; Figure 3), with high rates not only in early childhood but also in later middle age, is consistent with the age relationships previously reported for malaria mortality in selected urban hospitals in India,31 in family-reported causes of death from a national household demographic survey in 1998-99,32 and in a network of demographic mortality studies using physician adjudication in rural Africa,33-34 but not with WHO mortality estimates.1,35
Figure 3. Age-specific all-India malaria-attributed death rates estimated from the present study, and those estimated indirectly for WHO.
Within each age range, the all-India death rates from the present study are standardised in 5-year age groups to the 2005 Indian population.18 The vertical bars represent the upper and lower bounds (see text and supplementary appendix) based on physician coding. The numbers shown beside the main line represent the number of study deaths finally adjudicated to malaria for each age range.
Most of the malaria-attributed deaths were in rural areas and involved an acute fever that was never seen or diagnosed by any healthcare worker, so assignment of the pathogen is inherently uncertain. In retrospective enquiries to families about the symptoms, and hence the probable causes, of such deaths, malaria and some other infectious diseases are easily confused, although untreated fatal malaria may have somewhat distinct symptoms.25, 29, 36-40 Because treated malaria is rarely fatal, the distribution of pathogens in untreated fevers that cause rapid death in the community may be very different from the distribution of pathogens in fevers that cause death in hospital, and from the distribution of pathogens in fevers that do not cause death.41 This makes it difficult to use hospital-based studies to assess the reliability of community-based verbal autopsies or to predict the proportion of febrile deaths that is due to malaria. 36, 39 Other mosquito-borne diseases such as dengue or Japanese encephalitis may share the seasonal transmission patterns observed of malaria but they differ substantially from malaria in clinical symptoms and geographic distribution,30 and are not common enough to account for a large proportion of all Indian deaths, particularly in the high-malaria states. 30, 42-43
If there are large numbers of deaths from undiagnosed and untreated malaria in some parts of rural India then any method of estimating overall malaria deaths must rely, directly or indirectly, on evidence of uncertain reliability from non-medical informants – and, although our method of estimating malaria mortality is substantially uncertain, indirect methods may be even more so.44,45 The major source of uncertainty in our estimates arises from the possible misclassification of malaria deaths as deaths from other diseases, and vice versa. There is no wholly satisfactory method to quantify the inherent uncertainty in this, and indeed the use of statistical methods to quantify uncertainty can convey a false precision.46 However, even if we restrict our analyses to the deaths that were immediately classified by both physician coders as malaria, this still suggests that the current WHO estimates (15,000 deaths per year at all ages) 1 are more than 6-fold lower than our estimated of malaria deaths in India (125,000 deaths below age 70; of which about 18,000 alone would have been in health care facilities).
Our study suggests that the current low WHO estimate of malaria deaths in India (and only 100,000 adult malaria deaths per year worldwide) 1 should be reconsidered. If the WHO estimates of malaria deaths in India or among adults worldwide are likely to be substantial under-estimates, this could significantly change current disease control strategies, particularly in the rural parts of the high-malaria states. Better estimates of malaria incidence 45 and of malaria mortality in India, Africa and elsewhere will provide a more rational foundation for the current debates about funding for preventive measures, about the need for more rapid access to malaria diagnosis, and about affordable access in the community to effective antimalarial drugs for children and for adults. 1-2, 47
Supplementary Material
Acknowledgments
The Registrar-General of India established the SRS in 1971, has continued it ever since, and is collaborating with several of the authors on the ongoing Million Death Study. External funding is from the Fogarty International Centre of the US National Institutes of Health (grant R01 TW05991–01]), Canadian Institute of Health Research (CIHR; IEG-53506), Li Ka Shing Knowledge Institute and Keenan Research Centre at St. Michael's Hospital, University of Toronto (CGHR support) and UK Medical Research Council (CTSU support). PJ is supported by the Canada Research Chair program. All study materials are available freely at www.cghr.org. The opinions expressed here are those of the authors and do not necessarily represent those of the Government of India. We thank David Fisman, Hellen Gelband, Adrianna Murphy and Tom Peto for comments and Brendon Pezzack for graphics.
Footnotes
Author Contributions: PJ and the academic partners in India (RGI-CGHR Collaborators; Web Appendix) planned the Million Death Study in close collaboration with the Office of the Registrar General of India. ND, VPS and PJ planned the analyses. AAC, DGB, PSR, WS, RP and PJ did the statistical analyses. All authors were involved with data interpretation, critical revisions of the paper, and approved the final version; PJ is its guarantor.
Conflicts of interest: We declare that we have no conflicts of interest.
Publisher's Disclaimer: This is a PDF file of an unedited manuscript that has been accepted for publication. As a service to our customers we are providing this early version of the manuscript. The manuscript will undergo copyediting, typesetting, and review of the resulting proof before it is published in its final citable form. Please note that during the production process errors may be discovered which could affect the content, and all legal disclaimers that apply to the journal pertain.
References
- 1.World Health Organization . World Malaria Report 2008. Geneva: World Health Organization; 2008. [Google Scholar]
- 2.Nosten F, White NJ. Artemisinin-based combination treatment of falciparum malaria. Am J Trop Med Hyg. 2007;77(suppl. 2):181–92. [PubMed] [Google Scholar]
- 3.Jha P. Reliable mortality data: a powerful tool for public health. Natl Med J India. 2001;14(suppl. 3):129–31. [PubMed] [Google Scholar]
- 4.Jha P, Gajalakshmi V, Gupta PC, et al. Prospective study of one million deaths in India: rationale, design, and validation results. PLoS Medicine. 2006;3(suppl. 2) doi: 10.1371/journal.pmed.0030018. [DOI] [PMC free article] [PubMed] [Google Scholar]
- 5.National Institute of Malaria Research & National Vector Borne Disease Control Programme . In-depth Review on Malaria for National Vector Borne Disease Control Programme. New Delhi: National Institute of Malaria Research & National Vector Borne Disease Control Programme; 2007. [Google Scholar]
- 6.Kumar A, Valecha N, Jain T, Dash AP. Burden of malaria in India: retrospective and prospective view. Am J Trop Med Hyg. 2007;77(suppl. 6):69–78. [PubMed] [Google Scholar]
- 7.Sarkar J, Murhekar MV, Shah NK, van Hutin Y. Risk factors for malaria deaths in Jalpaiguri district, West Bengal, India: evidence for further action. Malar J. 2009;8:133. doi: 10.1186/1475-2875-8-133. [DOI] [PMC free article] [PubMed] [Google Scholar]
- 8.Tripathy R, Parida S, Das L, et al. Clinical manifestations and predictors of severe malaria in Indian children. Pediatrics. 2007;120:e454–60. doi: 10.1542/peds.2006-3171. [DOI] [PubMed] [Google Scholar]
- 9.Jain V, Nagpal AC, Joel PK, et al. Burden of cerebral malaria in central India (2004-2007) Am J Trop Med Hyg. 2008;79:636–42. [PMC free article] [PubMed] [Google Scholar]
- 10.Sharma SK, Tyagi PK, Padhan K, Adak T, Subbarao SK. Malarial morbidity in tribal communities living in the forest and plain ecotypes of Orissa, India. Ann Trop Med Parasitol. 2004;98:459–68. doi: 10.1179/000349804225003569. [DOI] [PubMed] [Google Scholar]
- 11.Gogoi SC, Dev V, Phookan S. Morbidity and mortality due to malaria in Tarajulie Tea Estate, Assam, India. Southeast Asian J Trop Med Public Health. 1996;27:526–9. [PubMed] [Google Scholar]
- 12.Chaturvedi HK, Mahanta J, Pandey A. Treatment-seeking for febrile illness in north-east India: an epidemiological study in the malaria endemic zone. Malar J. 2009;8:301. doi: 10.1186/1475-2875-8-301. [DOI] [PMC free article] [PubMed] [Google Scholar]
- 13.Diamond-Smith N, Singh N, Gupta RK, et al. Estimating the burden of malaria in pregnancy: a case study from rural Madhya Pradesh, India. Malar J. 2009;8:24. doi: 10.1186/1475-2875-8-24. [DOI] [PMC free article] [PubMed] [Google Scholar]
- 14.Hamer DH, Singh MP, Wylie BJ, et al. Burden of malaria in pregnancy in Jharkhand State, India. Malar J. 2009;8:210. doi: 10.1186/1475-2875-8-210. [DOI] [PMC free article] [PubMed] [Google Scholar]
- 15.Registrar General of India & Centre for Global Health Research . Causes of Death in India, 2001-2003, Sample Registration System. New Delhi: Government of India; 2009. [Google Scholar]
- 16.Jha P, Jacob B, Gajalakshmi V, et al. A nationally representative case-control study of smoking and death in India. N Engl J Med. 2008;358(suppl.11):1137–47. doi: 10.1056/NEJMsa0707719. [DOI] [PubMed] [Google Scholar]
- 17.Jha P, Kumar R, Khera A, et al. HIV mortality and infection in India: estimates from a nationally-representative mortality survey of 1.1 million homes. BMJ. 2010;340:c621. doi: 10.1136/bmj.c621. [DOI] [PMC free article] [PubMed] [Google Scholar]
- 18.United Nations, Department of Economic and Social Affairs World Population Prospects, the 2008 Revision. 2009 http://esa.un.org/peps/peps_interpolated-data.htm.
- 19.Registrar General of India . Sample Registration System, Statistical Report: 2004. New Delhi: Government of India; 2005. [Google Scholar]
- 20.World Health Organization . International Statistical Classification of Diseases and Related Health Problems, Tenth Revision (ICD - 10) Geneva: World Health Organization; 1994. [Google Scholar]
- 21.Sinha D, Dikshit R, Kumar V, Gajalakshmi V, Dhingra N, Seth J. Technical document VII: Health care professional's manual for assigning causes of death based on RHIME household reports. Toronto: Centre for Global Health Research, University of Toronto; 2006. [Google Scholar]
- 22.Cohen AA, Dhingra N, Jotkar RM, Rodriguez PS, Sharma VP, Jha P. The Summary Index of Malaria Surveillance (SIMS): A stable index of malaria within India. Population Health Metrics. 2010;8:1. doi: 10.1186/1478-7954-8-1. [DOI] [PMC free article] [PubMed] [Google Scholar]
- 23.International Institute for Population Sciences . District Level Household Survey (DLHS-2), 2002-04. India. Mumbai: International Institute for Population Sciences; 2006. [Google Scholar]
- 24.Kleinschmidt I, Bagayoko M, Clarke GP, Craig M, Le Sueur D. A spatial statistical approach to malaria mapping. Int J Epidemiol. 2000;29(suppl 2):355–61. doi: 10.1093/ije/29.2.355. [DOI] [PubMed] [Google Scholar]
- 25.Gajalakshmi V, Peto R, Kanaka S, Balasubramanian S. Verbal autopsy of 48 000 adult deaths attributable to medical causes in Chennai (formerly Madras), India. BMC Public Health. 2002;2 doi: 10.1186/1471-2458-2-7. [DOI] [PMC free article] [PubMed] [Google Scholar]
- 26.Gajalakshmi V, Peto R, Kanaka TS, Jha P. Smoking and mortality from tuberculosis and other diseases in India: retrospective study of 43 000 adult male deaths and 35 000 controls. Lancet. 2003;362(suppl. 9383):507–15. doi: 10.1016/S0140-6736(03)14109-8. [DOI] [PubMed] [Google Scholar]
- 27.Mari Bhat PN. Completeness of India's Sample Registration System: an assessment using the general growth balance method. Population Studies. 2002;56(suppl. 2):119–34. doi: 10.1080/00324720215930. [DOI] [PubMed] [Google Scholar]
- 28.Sivanandan V. An assessment of the completeness of death registration in India over the periods 1975-1978 and 1996-1999 under the generalized population model: an analysis based on SRS data. Mumbai, India: International Institute for Population Sciences; 2004. [Google Scholar]
- 29.Kumar R, Thakur J, Rao B, Singh M, Bhatia S. Validity of verbal autopsy in determining causes of adult deaths. Indian J of Public Health. 2006;50:90–94. [PubMed] [Google Scholar]
- 30.Central Bureau of Health Intelligence . National Health Profile 2007. New Delhi: Ministry of Health and Family Welfare, Government of India; 2007. http://cbhidghs.nic.in/index2.asp?slid=987&sublinkid=698. [Google Scholar]
- 31.Registrar General of India . Medically-Certified Causes of Death, Statistical Report: 2000. New Delhi: Government of India; 2005. [Google Scholar]
- 32.International Institute for Population Sciences . National Family Health Survey-2 (NFHS-2), 1998-99. India. Mumbai: International Institute for Population Sciences; 2002. [Google Scholar]
- 33.Adjuik M, Smith T, Clark S, et al. Cause-specific mortality rates in sub-Saharan Africa and Bangladesh. Bull World Health Organ. 2006;84:181–88. doi: 10.2471/blt.05.026492. [DOI] [PMC free article] [PubMed] [Google Scholar]
- 34.Bawah AA, Binka FN. How many years of life could be saved if malaria were eliminated from a hyperendemic area of Northern Ghana? Am J Trop Med Hyg. 2007;77(suppl. 6):145–52. [PubMed] [Google Scholar]
- 35.World Health Organization . The Global Burden of Disease: 2004 Update. Geneva: World Health Organization; 2008. [Google Scholar]
- 36.Chandramohan D, Maude GH, Rodrigues LC, Hayes RJ. Verbal autopsies for adult deaths: their development and validation in a multicentre study. Trop Med Int Health. 1998;3:436–46. doi: 10.1046/j.1365-3156.1998.00255.x. [DOI] [PubMed] [Google Scholar]
- 37.Snow RW, Armstrong JR, Forster D, et al. Childhood deaths in Africa: uses and limitations of verbal autopsies. Lancet. 1992;340:351–5. doi: 10.1016/0140-6736(92)91414-4. [DOI] [PubMed] [Google Scholar]
- 38.Anker M. The effect of misclassification error on reported cause-specific mortality fractions from verbal autopsy. Int J Epidemiol. 1997;26:1090–6. doi: 10.1093/ije/26.5.1090. [DOI] [PubMed] [Google Scholar]
- 39.Maude GH, Ross DA. The effect of different sensitivity, specificity and cause-specific mortality fractions on the estimation of differences in cause-specific mortality rates in children from studies using verbal autopsies. Int J Epidemiol. 1997;26:1097–106. doi: 10.1093/ije/26.5.1097. [DOI] [PubMed] [Google Scholar]
- 40.Joshi R, Cardona M, Iyengar S, et al. Chronic diseases now a leading cause of death in rural India-mortality data from the Andhra Pradesh Rural Health Initiative. Int J Epidemiol. 2006;35(suppl.6):1522–29. doi: 10.1093/ije/dyl168. [DOI] [PubMed] [Google Scholar]
- 41.Berkley JA, Lowe BS, Mwangi I, et al. Bacteremia among children admitted to a rural hospital in Kenya. N Engl J Med. 2005;1:39–47. doi: 10.1056/NEJMoa040275. [DOI] [PubMed] [Google Scholar]
- 42.Gupta E, Dar L, Kapoor G, Broor S. The changing epidemiology of dengue in Delhi, India. Virology Journal. 2006;3:92. doi: 10.1186/1743-422X-3-92. [DOI] [PMC free article] [PubMed] [Google Scholar]
- 43.Reuben R, Gajanana A. Japanese encephalitis in India. Indian Journal of Pediatrics. 1997;64:243–251. doi: 10.1007/BF02752458. [DOI] [PubMed] [Google Scholar]
- 44.Hay SI, Guerra CA, Gething PW, et al. A world malaria map: Plasmodium falciparum endemicity in 2007. PLoS Med. 2009;6(suppl. 3) doi: 10.1371/journal.pmed.1000048. [DOI] [PMC free article] [PubMed] [Google Scholar]
- 45.Smith DL, Smith T, Hay SI. Measuring Malaria for Elimination. In: Feachem RGA, Phillips AA, Targett GA, editors. Shrinking the Malaria Map: A Prospectus on Malaria Elimination. San Francisco: The Global Health Group, Global Health Sciences, University of California; 2009. pp. 108–126. [Google Scholar]
- 46.Rowe AK, Rowe SY, Snow RW, et al. The burden of malaria mortality among African children in the year 2000. Int J Epidemiol. 2006;35:691–704. doi: 10.1093/ije/dyl027. [DOI] [PMC free article] [PubMed] [Google Scholar]
- 47.Talisuna A, Grewal P, Rwakimari JB, Mukasa S, Jagoe G, Banerji J. Cost is killing patients: subsidising effective antimalarials. Lancet. 2009;374(suppl. 9697):1224–26. doi: 10.1016/S0140-6736(09)61767-0. [DOI] [PubMed] [Google Scholar]
- 48.Runsewe-Abiodun IT, Ogunfowora OB, Fetuga BM. Neonatal malaria in Nigeria—a 2 year review. BMC Pediatr. 2006;6:19. doi: 10.1186/1471-2431-6-19. [DOI] [PMC free article] [PubMed] [Google Scholar]
Associated Data
This section collects any data citations, data availability statements, or supplementary materials included in this article.