

Abstract
Background: Galactose consumption as the only carbohydrate source results in little increase in plasma glucose and insulin concentrations when compared with fasting. Lower insulin might promote endogenous lipolysis during meal absorption, which may facilitate fat loss.
Objective: The objective was to test the hypothesis that consumption of an isocaloric, isonitrogenous galactose drink will result in higher rates of lipolysis and fat oxidation than consumption of a glucose drink in obese lactating and nonlactating women.
Design: Seven healthy, obese, exclusively breastfeeding women and 7 healthy, obese, nonlactating women were studied on 2 occasions according to a randomized, crossover, single-blinded design. Subjects received drinks providing ≈70% of the daily estimated energy requirement, of which 60% was either glucose or galactose. The primary outcomes were the rate of appearance (Ra) of glycerol and palmitate, and the secondary outcomes were glucose Ra, milk production, energy expenditure, and substrate oxidation.
Results: Plasma glucose and insulin concentrations were lower (P < 0.05) and those of glycerol, palmitate, free fatty acids, and triglycerides were higher (P < 0.05) during galactose than during glucose feeding in both nonlactating and lactating women. During galactose feeding, glucose Ra was lower (P < 0.01) and glycerol, palmitate, and free fatty acid Ra were higher (P < 0.01) in both groups. During galactose feeding in all women combined, fat oxidation was higher (P = 0.01) and protein oxidation was lower (P < 0.01). Milk production, energy expenditure, and carbohydrate oxidation were similar between glucose and galactose feeding.
Conclusions: Galactose consumption is associated with higher endogenous fat mobilization and oxidation during meal absorption. Long-term studies are required to determine whether galactose as an exclusive carbohydrate source would promote body fat loss in obese subjects.
INTRODUCTION
Many lactating women are concerned about losing weight gained during pregnancy in the postpartum period without adversely affecting lactation. Weight gain during sequential pregnancies can lead to excessive weight gain and obesity. During pregnancy and the postpartum period, obesity is associated with short-term, but significant, adverse health effects, including hypertension, pre-eclampsia (1, 2), gestational diabetes (3, 4), thromboembolic events (3), cesarean delivery (5), and failure to initiate or sustain breastfeeding (6). Over the long term, obesity in these women increases their risk of type 2 diabetes (7) and other aspects of the metabolic syndrome (8).
A large number of dietary approaches have been proposed to facilitate weight loss in the general population (9–11). However, only a limited number of studies have dealt with weight loss among lactating women (12, 13). It is postulated that high-carbohydrate foods with a high glycemic index induce a rapid increase in blood glucose, which results in insulin release (14), which in turn inhibits endogenous fat mobilization (13, 15) and promotes the retention of body fat. On the other hand, diets that produce a low glycemic response may minimize postprandial insulin secretion, thus facilitating fat mobilization and loss. However, these premises remain largely unproven in clinical studies. Although returning to prepregnancy (or ideal) body weight after delivery should be the goal, extreme dietary programs could compromise milk production (16).
Oral galactose provides a nutrient substrate that is converted to glucose without significant increase in plasma glucose and insulin concentrations (17–19).Thus, galactose, a potential substrate for lactose synthesis (17), might also promote fat mobilization and oxidation. The present study was designed to determine whether an isocaloric, isonitrogenous drink of galactose as the sole carbohydrate source, when compared with an identical drink of glucose, will promote fat mobilization and oxidation in obese lactating and obese nonlactating nonpregnant women without adversely affecting milk production in lactating women.
SUBJECTS AND METHODS
Subjects
After approval by the Institutional Review Board for Human Subjects and the General Clinical Research Center (GCRC) Advisory Committee at Baylor College of Medicine, written consent was obtained from each subject. The initial recruitment started in September 2007. All subjects were determined to be healthy if they had normal results from a physical examination and liver function tests and normal fasting blood glucose, hemoglobin, and glycated hemoglobin concentrations. None of the women had a history of gestational diabetes or had children, parents, siblings, or grandparents with diabetes. Except for routine postpartum vitamin and mineral supplements prescribed by their physician, none of the subjects were taking any medications, including birth control pills. All women had a negative pregnancy test at the time of the study. To exclude any pregnancy-related changes in body composition and hormones and to ensure a stable physiologic model, all lactating women were studied between 6 and 12 wk postpartum. Nonlactating women were studied ≥1 y after their last delivery. No attempt was made to study the subjects at a specific time in their menstrual cycle or to select subjects on the basis of ethnicity. Seven obese, healthy, exclusively breastfeeding women [age: 26.6 ± 1.3 y; body mass index (in kg/m2): 34.5 ± 1.7; height: 165.7 ± 3.0 cm; weight: 94.2 ± 3.6 kg; and total body fat (measured by dual-energy X-ray absorptiometry; QDR 11.2; Hologic, Bedford, MA): 42.0 ± 1.4%; 1 African American, 2 whites, and 4 Hispanic Americans] were recruited. The infants of the lactating women weighed 5.24 ± 0.22 kg, were 9.76 ± 0.56 wk of age, and were healthy at the time of the study. In addition, 7 obese, healthy, nonpregnant, nonlactating women (age: 29.7 ± 1.7 y; body mass index: 35.5 ± 1.4; height: 162.6 ± 1.4 cm; weight: 94.0 ± 4.6 kg; and total body fat: 42.5 ± 0.6%; 2 African Americans, 1 white, and 4 Hispanic Americans) were recruited as control subjects.
Protocol
The participants were studied on 2 occasions separated by 1–2 wk. They were instructed to consume a standardized mixed meal providing ≈15% protein, 50% carbohydrate, and 35% fat for the 3 d preceding admission to the GCRC. Lactating women were asked to bring 180–300 mL breast milk to supplement their infants’ feedings should they have technical difficulty with breastfeeding and/or decreased milk production during the study.
On each study occasion, the women were admitted to the GCRC for 4 d and 3 nights. The women were randomly assigned to receive feedings (every 3 h) of a liquid, isocaloric drink containing either glucose or galactose (98% purity; Sigma-Aldrich, St Louis, MO). The sugars of the drinks provided ≈60% (325 ± 5 g/d) of the women's daily estimated energy requirement (EER). An additional ≈10% of their daily EER was provided as protein (38 ± 5 g/d, Beneprotein; Novartis, Minneapolis, MN) and essential fatty acids (13 ± 1 g safflower oil/d, >70% linoleic acid). Thus, the drink provided a total of 70% of the women's EER. Carbohydrate, protein, and fat provided 83%, 10%, and 7% of the calories in the drink, respectively. EER was calculated according to the Institute of Medicine for overweight and obese women ≥19 y of age (20):
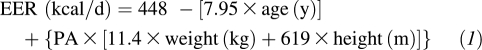 |
where PA is the physical activity coefficient: PA = 1.16 (low activity).
To overcome problems with calculations and comparisons, lactating women received the same intake as nonlactating women, and no further intake was provided to account for milk production (ie, the extra ≈400 kcal recommended for exclusive breastfeeding).
Women (and their infants if the women were lactating) were admitted to the GCRC before 1600 on day 1 of the study to allow time for administrative paperwork to be completed and a pregnancy test and physical examination to be conducted. At 1700, an antecubital intravenous catheter was placed in one arm under ELA-MAX cream (Astra Pharmaceuticals, Wayne, PA) analgesia for blood sampling. At 1800, a basal blood (and milk in lactating women) sample was collected. The women then received a standardized mixed meal providing 15% protein, 50% carbohydrate, and 35% fat followed by a snack at 2000. Thereafter, except for water, the subjects fasted until 0600 the following morning (day 2). Starting at 0600 on day 2, both nonlactating and lactating women consumed the drink containing either glucose or galactose every 3 h until 2000 on day 3. Throughout the study, the breastfeeding women were asked to feed their infants at ≈3-h intervals and to breastfeed from both breasts at each feeding time. Infants were weighed before and after each breastfeeding to determine the volume of milk consumed (21, 22). With the completion of each feeding, the women were asked to empty their breasts of residual milk using a standard electric breast pump (Embrace; Playtex, Dover, DE). A small milk sample from each breast was collected during the middle of each feeding and was saved for lactose, fat, and protein analysis. The volume of milk produced was the sum of the milk consumed, pumped, and collected for analysis (22).
During the first 3 d of the stay, a small blood sample was drawn for the measurement of plasma glucose concentrations at 6-h intervals. On the evening of study day 3, a second intravenous tube was placed in the contralateral arm under ELA-MAX cream analgesia for infusions. From 2000, each subject fasted except for ad libitum water until 0900 the following morning. On study day 4, between 0400 and 0900, a simultaneous primed-constant rate intravenous infusion of [6,6-2H2]glucose (22 μmol · kg−1 and 0.36 μmol · kg−1 · min−1) and [2-13C]glycerol (5.5 μmol · kg−1 and 0.09 μmol · kg−1 · min−1) was administered to measure the rate of appearance (Ra) of glucose and glycerol (an index of total lipolysis). From 0630 to 0900, a primed-constant rate intravenous infusion of [U-13C]palmitate bound to human albumin (0.90 μmol · kg−1 and 0.015 μmol · kg−1 · min−1) was administered to measure the Ra of palmitate [index of free fatty acid (FFA) turnover]. Blood samples (5 mL each) were obtained at baseline (0300), 0700, and every 15 min from 0800 to 0900 (representing the overnight fasting condition).
Between 0900 and 1500, the women were offered small drinks (25 mL every 15 min) that had the same composition and provided the same amount of calories as consumed over the previous 2 d (either glucose or galactose). In addition, the women received isotope infusions identical to those received between 0400 and 0900, except that the rate of [6,6-2H2]glucose was increased to 0.70 μmol · kg−1 · min−1. Blood samples were drawn hourly from 1000 to 1300 and every 15 min from 1400 to 1500 (representing the feeding condition).
Carbon dioxide production and oxygen consumption were measured hourly from 0700 to 0900 and from 1300 to 1500 by using indirect calorimetry for the calculation of substrate oxidations. Urine was collected during the last 24 h of the study (one collection representing the first 12 h followed by two 6-h collections during the last 12 h).
On completion of the study, the women were discharged from the GCRC. They were readmitted to the GCRC after 1–2 wk for the second study. The second study was performed by using a design identical to the first except that the drink had a different carbohydrate source (glucose or galactose). Nonlactating women were studied by using an identical protocol, except that, obviously, no breast-milk samples were obtained.
The large commitment of time in the GCRC and limitations with GCRC bed availability, particularly on weekends because of reduction in National Institutes of Health funding for the GCRC, made it very difficult to recruit subjects per the above protocol. Therefore, after completion by 5 lactating and 4 nonlactating women, we shortened the duration of the initial dietary period to one full day of diet (drink) with the infusion study occurring the following morning. Thus, the study was shortened from 4 d and 3 nights to 2 d and 1 night. For this shortened protocol, subjects were admitted to the GCRC at 0700 on day1 and received drinks every 3 h between 0900 and 2000, which corresponded to 24 h of intake in the long protocol. The infusions were performed on the following day in an identical fashion to that described above for the long protocol. The results from the first 9 subjects studied on the long protocol were indistinguishable from those of the 5 subjects (3 nonlactating and 2 lactating women) studied on the shortened protocol (comparison data not shown but available on request).
Materials
[6, 6-2H2]Glucose (99 atom% 2H), [2-13C]glycerol (99 atom% 13C), [2H5]glycerol (99 atom% 2H), [1, 2-13C2]palmitic acid (99 atom% 13C), and [U-13C]palmitate (99 atom% 13C) (potassium salt) were purchased as sterile and pyrogen free from Cambridge Isotope Laboratories (Andover, MA). The isotopes were again determined to be sterile and pyrogen free in the investigation pharmacy of Texas Children's Hospital. [6, 6-2H2]Glucose and [2-13C]glycerol were dissolved in isotonic saline, and the solutions were filtered through a 0.2-μm filter (Millipore Corp, Bedford, MA) into sterile syringes. The [U-13C]palmitate tracer was dissolved in heated sterile isotonic saline (60°C) and passed through a 0.2-μm filter into warm (50°C) human serum albumin solution (25%) (Baxter Health Corporation, Westlake Village, CA). The sterile solutions were prepared <48 h before the study and were maintained at 4°C until just before their use, as previously described (23).
Analytic methods
Substrate and hormone concentrations
Plasma glucose and lactate concentrations were measured by using enzyme-specific methods (YSI Glucose Analyzer; YSI, Yellow Springs, OH), plasma insulin and C-peptide concentrations by electrochemiluminescence with a Roche Elecsys 1010 analyzer (Roche Diagnostics Corporation, Indianapolis, IN), plasma lipids with standard laboratory techniques, and plasma FFAs and β-hydroxybutyrate by microfluorometric enzyme analyses as previously described (24). Plasma glycerol and palmitate concentrations were measured by reverse isotope dilution and gas chromatography–mass spectrometry (GC-MS) by using the internal standards [2H5]glycerol (23) and [1, 2-13C2]palmitic acid (25), respectively.
Milk lactose concentrations were measured by using an enzyme-specific method (YSI Glucose Analyzer; YSI), protein concentrations with a bicinchoninic acid protein assay kit (Novagen, Madison, WI) (26, 27), and fat concentrations with a colorimetric method as previously described (28). Production, composition, and the caloric content of the breast milk were calculated as previously described (26).
Isotopic enrichments
The penta-acetate derivative of glucose was prepared, and the isotopic enrichments of [6,6-2H2]glucose were measured by GC-MS as described previously (23, 29). The tripropionate derivative of glycerol was prepared, and the isotopic enrichments of [2-13C]glycerol and [2H5]glycerol were measured by GC-MS (HP 5890/HP5970; Hewlett-Packard Co, Palo Alto, CA) and an HP-1701 column (30 m × 0.25 mm × 0.25 μm) (Agilent Technologies, Wilmington, DE). The electron impact ionization mode was used with selected ion monitoring of m/z 173–176 for glycerol. Palmitate (in the FFA pool) was converted to the palmitate pentafluorobenzyl bromide derivative. Enrichments of [U-13C]palmitate and the internal standard [1, 2-13C2]palmitate were measured by GC-MS by using a quadrupole instrument (HP 5890/HP5970; Hewlett-Packard Co) and an SP2380 column (60 m × 0.25 mm × 0.25 μm) (Supelco Inc, Bellefonte, PA) according to the established method (30). Negative chemical ionization mode was used with methane as the reagent gas and selected ion monitoring of m/z 255–257 and 271. Lactose obtained from milk samples during the tracer infusions were hydrolyzed to glucose and galactose enzymatically, and enrichment of the resultant sugars was analyzed as previously described (17, 31). All measurements were made in the Stable Isotope Core Laboratory of the Children's Nutrition Research Center.
Indirect calorimetry
Indirect calorimetry was performed by using a MedGraphic Model Indirect Calorimeter (MedGraphics Inc, Minneapolis, MN). Substrate oxidation rates of protein, glucose, and lipid and resting energy expenditure were calculated by using the gaseous exchange equations previously described (32). The substrate oxidation rates were calculated as follows:
where  CO2 and O2 are the gaseous exchanges (L/min) obtained from the calorimeter, and N is total nitrogen urinary excretion (g/min).
Calculations
Kinetic measurements
The Ra values of glucose, glycerol (total lipolysis), and palmitate (indicator of total FFA Ra) into the systemic circulation were calculated under near steady state conditions by using the following standard isotope dilution equation:
where Ei and Ep are the infusate and plasma enrichments, respectively, of the tracers [6,6-2H2]glucose, [2-13C]glycerol, and [U-13C]palmitate, and I is the rate of infusion of the tracers. Ra FFA was calculated according to the following equation:
The fraction of glucose and galactose (product pool) in milk lactose that was derived from plasma glucose (precursor pool) and the fraction derived from de novo synthesis were calculated as previously described (17, 23).
Insulin sensitivity
Insulin sensitivity in the fasting condition was calculated by using the average baseline insulin and glucose values with the homeostasis model of assessment (HOMA) of insulin resistance and the quantitative insulin-sensitivity check index (33).
Statistical analysis
Values obtained during each near steady state period of tracer infusion (0800–0900 and 1400–1500, representing overnight fasting and the feeding state, respectively) were averaged for each subject and are presented as means ± SEs. Generalized Estimating Equations (GEEs) (SPSS 17.0) were used to assess the effects of the type of carbohydrate (glucose compared with galactose) and the interactions due to group × type of carbohydrate. Post hoc procedures (least significant difference) provided by GEE were used to perform the comparisons within groups and when all women were combined with regard to glucose and galactose after the overnight fasting and feeding conditions. The effect of the different sugars on milk volume and composition was compared by using Student's paired t test. Software program SPSS (version 17; SPSS Inc, Chicago, IL) was used for all statistical analyses. Significance was defined as P < 0.05.
RESULTS
After the overnight fast
Few differences in the metabolic variables measured after the overnight fast were observed between the glucose and galactose diets. When the data for all women were combined, plasma concentrations of C-peptide, cholesterol, LDL, and HDL were lower (P < 0.05) and concentrations of triglycerides were higher (P < 0.01) during the galactose diet than during the glucose diet (Table 1). In the lactating women, only C-peptide and glucose Ra were slightly but significantly (P < 0.05) lower during the galactose diet than during the glucose diet.
TABLE 1.
Substrate and hormone concentrations, kinetic measures, energy expenditure (EE), and substrate oxidation after the overnight fast1
| All women (n = 14) |
Nonlactating women (n = 7) |
Lactating women (n = 7) |
||||
| Glucose | Galactose | Glucose | Galactose | Glucose | Galactose | |
| Glucose (mmol/L) | 5.10 ± 0.08 | 5.09 ± 0.8 | 5.23 ± 0.12 | 5.10 ± 0.07 | 4.97 ± 0.09 | 5.09 ± 0.15 |
| Insulin (μU/mL) | 12.3 ± 2.2 | 9.5 ± 1.2 | 17.5 ± 4.3 | 13.0 ± 2.2 | 7.0 ± 1.1 | 6.0 ± 0.9 |
| C-peptide (ng/mL) | 3.0 ± 0.4 | 2.4 ± 0.3** | 3.5 ± 0.7 | 2.8 ± 0.5 | 2.5 ± 0.3 | 2.0 ± 0.2* |
| Galactose (μmol/L) | 21 ± 2 | 20 ± 2 | 14 ± 3 | 13 ± 3 | 28 ± 3 | 27 ± 3 |
| Lactate (mmol/L) | 0.95 ± 0.1 | 0.86 ± 0.1 | 1.06 ± 0.1 | 1.04 ± 0.09 | 0.83 ± 0.1 | 0.67 ± 0.0 |
| β-Hydroxybutyrate (mmol/L) | 115 ± 13 | 116 ± 11 | 67 ± 15 | 49 ± 14 | 163 ± 22 | 184 ± 16 |
| FFA (μmol/L) | 637 ± 52 | 610 ± 43 | 529 ± 47 | 504 ± 57 | 745 ± 92 | 717 ± 67 |
| Cholesterol (mg/dL) | 169 ± 10 | 161 ± 8** | 174 ± 16 | 165 ± 13* | 164 ± 11 | 158 ± 10 |
| LDL (mg/dL) | 103 ± 8 | 96 ± 6* | 109 ± 13 | 100 ± 11* | 97 ± 9 | 93 ± 7 |
| HDL (mg/dL) | 44 ± 3 | 40 ± 3** | 39 ± 3 | 33 ± 2* | 49 ± 4 | 46 ± 4 |
| Triglycerides (mg/dL) | 106 ± 14 | 132 ± 13** | 124 ± 15 | 167 ± 15** | 87 ± 18 | 96 ± 23 |
| Glycerol (μmol/L) | 76 ± 5 | 71 ± 5 | 59 ± 5 | 55 ± 3 | 92 ± 8 | 87 ± 9 |
| Palmitate (μmol/L) | 152 ± 10 | 138 ± 7 | 120 ± 11 | 108 ± 7 | 184 ± 17 | 168 ± 18 |
| Palmitate/FFA | 0.24 ± 0.01 | 0.23 ± 0.01 | 0.23 ± 0.02 | 0.23 ± 0.02 | 0.26 ± 0.02 | 0.24 ± 0.02 |
| HOMA | 2.86 ± 0.70 | 2.15 ± 0.36 | 4.21 ± 1.21 | 2.95 ± 0.56 | 1.52 ± 0.24 | 1.35 ± 0.20 |
| QUICKI | 0.34 ± 0.01 | 0.35 ± 0.01 | 0.35 ± 0.01 | 0.35 ± 0.01 | 0.36 ± 0.01 | 0.37 ± 0.01 |
| Glucose Ra (μmol−1 · kg−1 · min−1)2 | 8.15 ± 0.22 | 7.91 ± 0.23 | 7.10 ± 0.31 | 7.09 ± 0.31 | 9.19 ± 0.30 | 8.73 ± 0.33* |
| Glycerol Ra (μmol−1 · kg−1 · min−1)2 | 2.55 ± 0.13 | 2.46 ± 0.15 | 2.13 ± 0.18 | 2.07 ± 0.17 | 2.98 ± 0.19 | 2.84 ± 0.25 |
| Palmitate Ra (μmol−1 · kg−1 · min−1)2 | 1.47 ± 0.10 | 1.38 ± 0.10 | 1.26 ± 0.10 | 1.22 ± 0.11 | 1.68 ± 0.16 | 1.55 ± 0.17 |
| FFA Ra (μmol−1 · kg−1 · min−1)2 | 6.21 ± 0.54 | 6.06 ± 0.49 | 5.67 ± 0.61 | 5.56 ± 0.54 | 6.57 ± 0.89 | 6.56 ± 0.81 |
| RQ | 0.82 ± 0.01 | 0.82 ± 0.01 | 0.83 ± 0.01 | 84 ± 0.01 | 0.81 ± 0.01 | 0.80 ± 0.01 |
| EE (kcal/d) | 1501 ± 26 | 1479 ± 31 | 1485 ± 41 | 1475 ± 56 | 1518 ± 32 | 1483 ± 29 |
| Fat oxidation (g/d) | 84 ± 4 | 80 ± 6 | 82 ± 6 | 72 ± 9 | 86 ± 5 | 88 ± 6 |
| CHO oxidation (g/d) | 147 ± 11 | 144 ± 10 | 155 ± 17 | 169 ± 17 | 140 ± 15 | 119 ± 12 |
| Protein oxidation (g/d) | 37 ± 5 | 42 ± 7 | 32 ± 5 | 37 ± 4 | 42 ± 9 | 46 ± 12 |
All values are means ± SEMs. RQ, respiratory quotient; FFA, free fatty acid; Ra, rate of appearance; CHO, carbohydrate; HOMA, homeostasis model of assessment; QUICKI, quantitative insulin-sensitivity check index. Post hoc procedures provided by Generalized Estimating Equations were used to perform the comparisons of glucose and galactose within groups and in all women combined. *,**Significant difference between the glucose and galactose diets: *P < 0.05, **P < 0.01.
Based on total body weight.
During feeding
Substrate and hormone concentrations
Within both groups and when all women were combined, plasma concentrations of glucose, insulin, and C-peptide were lower (P < 0.01) and those of galactose, lactate, triglycerides, FFA, glycerol, and palmitate were higher (P < 0.01) (Table 2) during the galactose diet than during the glucose diet.
TABLE 2.
Plasma substrate concentrations during glucose and galactose feeding1
| All women (n = 14) |
Nonlactating women (n = 7) |
Lactating women (n = 7) |
||||
| Glucose | Galactose | Glucose | Galactose | Glucose | Galactose | |
| Glucose (mmol/L) | 5.84 ± 0.09 | 5.20 ± 0.08** | 6.02 ± 0.12 | 5.19 ± 0.07** | 5.66 ± 0.14 | 5.21 ± 0.14** |
| Insulin (μU/mL) | 34.8 ± 6.6 | 15.5 ± 2.2** | 53.8 ± 12.7 | 20.8 ± 4.0** | 15.8 ± 3.8 | 10.1 ± 1.8** |
| C-peptide (ng/mL) | 6.6 ± 0.9 | 3.2 ± 0.3** | 8.3 ± 1.6 | 3.5 ± 0.6** | 4.9 ± 0.6 | 2.8 ± 0.2** |
| Galactose (μmol/L) | 19 ± 2 | 125 ± 10** | 14 ± 4 | 155 ± 15** | 24 ± 2 | 95 ± 13** |
| Lactate (mmol/L) | 0.93 ± 0.1 | 1.26 ± 0.1** | 1.03 ± 0.1 | 1.44 ± 0.1** | 0.84 ± 0.1 | 1.07 ± 0.1** |
| β-OH-Butyrate (μmol/L) | 33 ± 6 | 41 ± 10 | 26 ± 8 | 17 ± 6 | 40 ± 8 | 64 ± 18 |
| FFA (μmol/L) | 211 ± 22 | 436 ± 36** | 102 ± 11 | 288 ± 31** | 320 ± 43 | 584 ± 65** |
| Cholesterol (mg/dL) | 168 ± 10 | 167 ± 9 | 172 ± 14 | 173 ± 16 | 163 ± 14 | 160 ± 9 |
| LDL (mg/dL) | 105 ± 8 | 96 ± 6** | 109 ± 11 | 97 ± 10* | 102 ± 12 | 94 ± 7 |
| HDL (mg/dL) | 43 ± 2 | 41 ± 2 | 37 ± 1 | 36 ± 3 | 48 ± 3 | 46 ± 4 |
| Triglycerides (mg/dL) | 97 ± 13 | 154 ± 20** | 126 ± 20 | 209 ± 37** | 69 ± 16 | 99 ± 17** |
| Glycerol (μmol/L) | 49 ± 2 | 66 ± 4** | 33 ± 2 | 47 ± 4** | 65 ± 5 | 86 ± 7** |
| Palmitate (μmol/L) | 55 ± 5 | 102 ± 9** | 30 ± 4 | 71 ± 7** | 80 ± 10 | 134 ± 17* |
| Palmitate/FFA | 0.28 ± 0.01 | 0.24 ± 0.01 | 0.29 ± 0.01 | 0.25 ± 0.01 | 0.26 ± 0.03 | 0.23 ± 0.02 |
All values are means ± SEMs. FFA, free fatty acid. Post hoc procedures provided by Generalized Estimating Equations were used to perform the comparisons within groups and all women combined with regard to glucose and galactose. *,**Significant difference between the glucose and galactose diets: *P < 0.05, **P < 0.01.
Glucose and lipid kinetics
Within both groups and when all women were combined, glucose Ra was lower (P < 0.01) and Ra values of glycerol, palmitate, and total FFA were higher during the galactose diet than during the glucose diet (P < 0.01) (Figure 1).
FIGURE 1.

Mean (±SEM) rates of appearance (Ra) of glucose, glycerol, palmitate, and total free fatty acids (FFAs) during the feeding of glucose (□) and galactose (▪) in all women combined (n = 14), in nonlactating women (n = 7), and in lactating women (n = 7). The calculations are based on total body weight (kg). Post hoc procedures provided by Generalized Estimating Equations were used to perform the comparisons of glucose and galactose within groups and in all women combined. **Significant difference between the glucose and galactose diets, P < 0.01.
Energy expenditure and substrate oxidation
No differences in the RQ, energy expenditure, or carbohydrate oxidation rates were observed between the glucose and galactose diets within either group or when all women were combined. However, when all women were combined, fat oxidation was higher (P = 0.01) and protein oxidation was lower (P < 0.01) during the galactose diet than during the glucose diet (Figure 2).
FIGURE 2.

Mean (±SEM) energy intake and expenditure, respiratory quotients, and substrate oxidation during the feeding of glucose (□) and galactose (▪) in all women combined (n = 14), in nonlactating women (n = 7), and in lactating women (n = 7). Post hoc procedures provided by Generalized Estimating Equations were used to perform the comparisons of glucose and galactose within groups and in all women combined. *,**Significant difference between the glucose and galactose diets: *P < 0.05, **P < 0.01.
Milk production and composition
Milk production and composition were similar between the glucose and galactose diets (Table 3). Regardless of the fasting or feeding condition, the percentage of milk lactose derived from plasma glucose was lower (P < 0.05) and the percentage derived from mammary hexoneogenesis was higher (P < 0.05) during the galactose diet than during the glucose diet (Table 4).
TABLE 3.
Milk production and composition1
| Glucose | Galactose | |
| Volume (mL/d) | 656 ± 77 | 702 ± 61 |
| Caloric content (kcal/d) | 409 ± 89 | 425 ± 88 |
| Lactose | ||
| (g/dL) | 6.1 ± 0.1 | 6.1 ± 0.1 |
| (g/d) | 39 ± 4 | 41 ± 4 |
| Fat | ||
| (g/dL) | 4.0 ± 0.4 | 3.8 ± 0.4 |
| (g/d) | 26.4 ± 4.0 | 26.3 ± 3.0 |
| Protein | ||
| (g/dL) | 2.0 ± 0.1 | 1.9 ± 0.1 |
| (g/d) | 12.7 ± 1.2 | 13.1 ± 1.4 |
All values are means ± SEMs; n = 7. The effect of the different sugars on milk volume and composition was compared by using Student's paired t test. No significant differences were found.
TABLE 4.
Source of milk lactose during the fasting and fed states1
| Fasting |
Fed |
|||
| Glucose | Galactose | Glucose | Galactose | |
| Milk glucose from plasma glucose (%) | 81 ± 2 | 70 ± 3* | 100 ± 2 | 94 ± 2 |
| Milk glucose from hexoneogenesis (%) | 19 ± 2 | 30 ± 3* | 0 ± 2 | 6 ± 2 |
| Milk galactose from plasma glucose (%) | 71 ± 2 | 62 ± 3 | 95 ± 2 | 83 ± 2** |
| Milk galactose from hexoneogenesis (%) | 29 ± 2 | 38 ± 3 | 5 ± 2 | 17 ± 2** |
| Milk lactose from plasma glucose (%) | 76 ± 2 | 66 ± 2* | 98 ± 2 | 89 ± 2* |
| Milk lactose from hexoneogenesis (%) | 24 ± 2 | 34 ± 2* | 2 ± 2 | 11 ± 2* |
All values are means ± SEMs; n = 7. The effect of the different sugars on the source of milk sugars during the fasting and fed states was compared by using Student's paired t test. *,**Significant difference between the glucose and galactose diets: *P < 0.05, **P < 0.01.
DISCUSSION
The present study indicates that consumption of a liquid meal of galactose as the sole carbohydrate source increases the rate of endogenous lipolysis when compared with glucose in both obese lactating and nonlactating women. As we anticipated, galactose ingestion resulted in lower plasma concentrations of glucose and insulin than did glucose ingestion (17–19). Despite the fact that the plasma glucose concentration was only 12% lower, glucose Ra decreased by 66%. This was associated with a >50% reduction in the plasma insulin concentration, which is most likely responsible for the higher Ra of glycerol (23%), palmitate (35%), and total FFA (40%). This is in keeping with the higher plasma concentrations of palmitate, glycerol, and FFA during the galactose diet than during the glucose diet. Thus, these findings collectively prove our hypothesis and are consistent with the well-known antilipolytic effect of insulin (34–36).
We did not detect any significant differences in energy expenditure or carbohydrate oxidation between the glucose and galactose diets. However, we did observe that fat oxidation was higher (30%) and protein oxidation was lower (45%) during the galactose diet than during the glucose diet in the lactating women. In 5 of 7 nonlactating women, fat oxidation was higher with galactose feeding than with glucose feeding. However, the difference between feedings (18%) was not significant (P = 0.15). This may have been the result of a type 2 error because, when the data from all 14 women studied were pooled (no interaction between group × carbohydrate type), the higher fat oxidation (28%) and lower protein oxidation (30%) were highly significant (P < 0.01). Several studies have compared the effects of low- with those of high-glycemic-index diets on substrate utilization during subsequent exercise in women (37) and men (38). No differences were reported in substrate oxidations or energy expenditure during the postprandial period (during resting); however, fat oxidation was significantly higher during exercise after the low-glycemic-index diets (37, 38).
Generally, the effects of the 2 sugars after the overnight fast were similar, suggesting a lack of carryover effect from day to day. The plasma concentrations of cholesterol, LDL, and HDL were slightly lower but those of triglycerides were higher during the galactose diet than during the glucose diet. Plasma C-peptide concentrations but not insulin were elevated on the glucose diet. This may reflect the higher insulin secretion in response to the glucose feeding and the slower rate of disappearance of C-peptide when compared with insulin (39).
In this short-term study, lactation performance was not affected by the type of carbohydrate in the maternal feeding because milk volume and composition were similar between the 2 diets. We (26) and others (40) have reported that dietary macronutrient composition affects milk composition, because a high-fat diet increases milk fat concentration compared with a low-fat diet. Conversely, the source of milk sugars (plasma glucose or mammary hexoneogenesis) was not affected by the macronutrient composition after an overnight fast or during feeding (26). However, in the present study, we observed that the source of milk sugars was affected by the type of dietary carbohydrate; lactose derived from plasma glucose was lower and, thus, mammary hexoneogenesis was higher during the galactose diet. This activation of mammary hexoneogenesis suggests a compensatory mechanism to provide substrate for lactose synthesis. Additionally, under the present experimental condition, it is possible that plasma galactose during galactose feeding could contribute directly to milk galactose (17).
In summary, we showed the proof of principle that oral consumption of galactose promotes endogenous fat mobilization and oxidation during meal absorption in obese women while not adversely affecting milk production. On the basis of these data, long-term studies are warranted to determine whether galactose consumption in conjunction with moderate caloric restriction will facilitate body fat loss in obese lactating and nonlactating women. These studies should not be contemplated in obese pregnant women until such a program is shown to be safe for both the pregnant mother and the fetus.
Acknowledgments
We thank the volunteers whose participation made this study possible; E O'Brian Smith for his invaluable advice on statistics; the technicians in our laboratory (Susan Sharma, Marcia Ekworomadu, Shaji Chacko, and Dan Donaldson); our research coordinators (Shawn Asphal, Janette Gonzalez, Cindy Bryant, and Linda Pleasant); our secretary (Karen Jones); and the staff in the Metabolic Research Unit and kitchen and the General Clinical Research Center, who greatly facilitated the execution of these studies.
The authors’ responsibilities were as follows—MAM: contributed to the study design, oversaw the studies, performed the biochemical and statistical analyses, and wrote the manuscript; ALS: contributed to the study design, revised the biochemical and statistical data analyses, and critically revised the manuscript; LAR: helped conduct the clinical studies and with manuscript revisions; and MWH: designed and funded the study, oversaw the data quality and data analysis, and critically revised the manuscript. All authors contributed to the intellectual content, interpretation of the results, writing of the manuscript, and acceptance of the final version. None of the authors had a personal or financial conflict of interest.
REFERENCES
- 1.Abenhaim HA, Kinch RA, Morin L, Benjamin A, Usher R. Effect of prepregnancy body mass index categories on obstetrical and neonatal outcomes. Arch Gynecol Obstet 2007;275:39–43 [DOI] [PubMed] [Google Scholar]
- 2.Cedergren M. Effects of gestational weight gain and body mass index on obstetric outcome in Sweden. Int J Gynaecol Obstet 2006;93:269–74 [DOI] [PubMed] [Google Scholar]
- 3.Crowther CA, Hiller JE, Moss JR, McPhee AJ, Jeffries WS, Robinson JS. Effect of treatment of gestational diabetes mellitus on pregnancy outcomes. N Engl J Med 2005;352:2477–86 [DOI] [PubMed] [Google Scholar]
- 4.LaCoursiere DY, Bloebaum L, Duncan JD, Varner MW. Population-based trends and correlates of maternal overweight and obesity, Utah 1991-2001. Am J Obstet Gynecol 2005;192:832–9 [DOI] [PubMed] [Google Scholar]
- 5.Dietz PM, Callaghan WM, Morrow B, Cogswell ME. Population-based assessment of the risk of primary cesarean delivery due to excess prepregnancy weight among nulliparous women delivering term infants. Matern Child Health J 2005;9:237–44 [DOI] [PubMed] [Google Scholar]
- 6.Hilson JA, Rasmussen KM, Kjolhede CL. Excessive weight gain during pregnancy is associated with earlier termination of breast-feeding among White women. J Nutr 2006;136:140–6 [DOI] [PubMed] [Google Scholar]
- 7.Stuebe AM, Rich-Edwards JW, Willett WC, Manson JE, Michels KB. Duration of lactation and incidence of type 2 diabetes. JAMA 2005;294:2601–10 [DOI] [PubMed] [Google Scholar]
- 8.Rooney BL, Schauberger CW, Mathiason MA. Impact of perinatal weight change on long-term obesity and obesity-related illnesses. Obstet Gynecol 2005;106:1349–56 [DOI] [PubMed] [Google Scholar]
- 9.D'Anci KE, Watts KL, Kanarek RB, Taylor HA. Low-carbohydrate weight-loss diets. Effects on cognition and mood. Appetite 2009;52:96–103 [DOI] [PubMed] [Google Scholar]
- 10.Foster GD, Wyatt HR, Hill JO, et al. A randomized trial of a low-carbohydrate diet for obesity. N Engl J Med 2003;348:2082–90 [DOI] [PubMed] [Google Scholar]
- 11.Truby H, Hiscutt R, Herriot AM, et al. Commercial weight loss diets meet nutrient requirements in free living adults over 8 weeks: a randomised controlled weight loss trial. Nutr J 2008;7:25. [DOI] [PMC free article] [PubMed] [Google Scholar]
- 12.McCrory MA, Nommsen-Rivers LA, Mole PA, Lonnerdal B, Dewey KG. Randomized trial of the short-term effects of dieting compared with dieting plus aerobic exercise on lactation performance. Am J Clin Nutr 1999;69:959–67 [DOI] [PubMed] [Google Scholar]
- 13.Lovelady CA, Garner KE, Moreno KL, Williams JP. The effect of weight loss in overweight, lactating women on the growth of their infants. N Engl J Med 2000;342:449–53 [DOI] [PubMed] [Google Scholar]
- 14.Ludwig DS, Majzoub JA, Al-Zahrani A, Dallal GE, Blanco I, Roberts SB. High glycemic index foods, overeating, and obesity. Pediatrics 1999;103:E26. [DOI] [PubMed] [Google Scholar]
- 15.De Glisezinski I, Harant I, Crampes F, et al. Effect of carbohydrate ingestion on adipose tissue lipolysis during long-lasting exercise in trained men. J Appl Physiol 1998;84:1627–32 [DOI] [PubMed] [Google Scholar]
- 16.Heinig MJ, Doberne K. Weighing the risks: the use of low-carbohydrate diets during lactation. J Hum Lact 2004;20:283–5 [DOI] [PubMed] [Google Scholar]
- 17.Sunehag A, Tigas S, Haymond MW. Contribution of plasma galactose and glucose to milk lactose synthesis during galactose ingestion. J Clin Endocrinol Metab 2003;88:225–9 [DOI] [PubMed] [Google Scholar]
- 18.Coss-Bu JA, Sunehag AL, Haymond MW. Contribution of galactose and fructose to glucose homeostasis. Metabolism 2009;58:1050–8 [DOI] [PMC free article] [PubMed] [Google Scholar]
- 19.Sunehag AL, Haymond MW. Splanchnic galactose extraction is regulated by coingestion of glucose in humans. Metabolism 2002;51:827–32 [DOI] [PubMed] [Google Scholar]
- 20.Panel on Macronutrients, Subcommittees on Upper Reference Levels of Nutrients and Interpretation and Uses of Dietary Reference Intakes, and the Standing Committee on the Scientific Evaluation of Dietary Reference Intakes, Food and Nutrition Board, Institute of Medicine Dietary reference intakes for energy, carbohydrate, fiber, fat, fatty acids, cholesterol, protein, and amino acids. Washington, DC: National Academies Press, 2005 [Google Scholar]
- 21.Motil KJ, Kertz B, Thotathuchery M. Lactational performance of adolescent mothers shows preliminary differences from that of adult women. J Adolesc Health 1997;20:442–9 [DOI] [PubMed] [Google Scholar]
- 22.Borschel MW, Kirksey A, Hannemann RE. Evaluation of test-weighing for the assessment of milk volume intake of formula-fed infants and its application to breast-fed infants. Am J Clin Nutr 1986;43:367–73 [DOI] [PubMed] [Google Scholar]
- 23.Tigas S, Sunehag A, Haymond MW. Metabolic adaptation to feeding and fasting during lactation in humans. J Clin Endocrinol Metab 2002;87:302–7 [DOI] [PubMed] [Google Scholar]
- 24.Miles J, Glasscock R, Aikens J, Gerich J, Haymond M. A microfluorometric method for the determination of free fatty acids in plasma. J Lipid Res 1983;24:96–9 [PubMed] [Google Scholar]
- 25.Bougneres PF, Bier DM. Stable isotope dilution method for measurement of palmitate content and labeled palmitate tracer enrichment in microliter plasma samples. J Lipid Res 1982;23:502–7 [PubMed] [Google Scholar]
- 26.Mohammad MA, Sunehag AL, Haymond MW. Effect of dietary macronutrient composition under moderate hypocaloric intake on maternal adaptation during lactation. Am J Clin Nutr 2009;89:1821–7 [DOI] [PMC free article] [PubMed] [Google Scholar]
- 27.Keller RP, Neville MC. Determination of total protein in human milk: comparison of methods. Clin Chem 1986;32:120–3 [PubMed] [Google Scholar]
- 28.Mitoulas LR, Kent JC, Cox DB, Owens RA, Sherriff JL, Hartmann PE. Variation in fat, lactose and protein in human milk over 24 h and throughout the first year of lactation. Br J Nutr 2002;88:29–37 [DOI] [PubMed] [Google Scholar]
- 29.Sunehag AL, Treuth MS, Toffolo G, et al. Glucose production, gluconeogenesis, and insulin sensitivity in children and adolescents: an evaluation of their reproducibility. Pediatr Res 2001;50:115–23 [DOI] [PubMed] [Google Scholar]
- 30.Hachey DL, Patterson BW, Reeds PJ, Elsas LJ. Isotopic determination of organic keto acid pentafluorobenzyl esters in biological fluids by negative chemical ionization gas chromatography/mass spectrometry. Anal Chem 1991;63:919–23 [DOI] [PubMed] [Google Scholar]
- 31.Sunehag AL, Louie K, Bier JL, Tigas S, Haymond MW. Hexoneogenesis in the human breast during lactation. J Clin Endocrinol Metab 2002;87:297–301 [DOI] [PubMed] [Google Scholar]
- 32.Mohammad MAPD, Sunehag AL, Chacko SK, Pontius AS, Maningat PD, Haymond MW. Mechanisms to conserve glucose in lactating women during a 42-h fast. Am J Physiol Endocrinol Metab 2009;297:E879–88 [DOI] [PMC free article] [PubMed] [Google Scholar]
- 33.Conwell LS, Trost SG, Brown WJ, Batch JA. Indexes of insulin resistance and secretion in obese children and adolescents: a validation study. Diabetes Care 2004;27:314–9 [DOI] [PubMed] [Google Scholar]
- 34.Jensen MD, Haymond MW, Gerich JE, Cryer PE, Miles JM. Lipolysis during fasting. Decreased suppression by insulin and increased stimulation by epinephrine. J Clin Invest 1987;79:207–13 [DOI] [PMC free article] [PubMed] [Google Scholar]
- 35.Campbell PJ, Carlson MG, Hill JO, Nurjhan N. Regulation of free fatty acid metabolism by insulin in humans: role of lipolysis and reesterification. Am J Physiol 1992;263:E1063–9 [DOI] [PubMed] [Google Scholar]
- 36.Sadur CN, Eckel RH. Insulin stimulation of adipose tissue lipoprotein lipase. Use of the euglycemic clamp technique. J Clin Invest 1982;69:1119–25 [DOI] [PMC free article] [PubMed] [Google Scholar]
- 37.Stevenson EJ, Williams C, Mash LE, Phillips B, Nute ML. Influence of high-carbohydrate mixed meals with different glycemic indexes on substrate utilization during subsequent exercise in women. Am J Clin Nutr 2006;84:354–60 [DOI] [PubMed] [Google Scholar]
- 38.Wu CL, Nicholas C, Williams C, Took A, Hardy L. The influence of high-carbohydrate meals with different glycaemic indices on substrate utilisation during subsequent exercise. Br J Nutr 2003;90:1049–56 [DOI] [PubMed] [Google Scholar]
- 39.Kruszynska YT, Home PD, Hanning I, Alberti KG. Basal and 24-h C-peptide and insulin secretion rate in normal man. Diabetologia 1987;30:16–21 [DOI] [PubMed] [Google Scholar]
- 40.Park Y, McGuire MK, Behr R, McGuire MA, Evans MA, Shultz TD. High-fat dairy product consumption increases delta 9c,11t-18:2 (rumenic acid) and total lipid concentrations of human milk. Lipids 1999;34:543–9 [DOI] [PubMed] [Google Scholar]