Abstract
Background
After coronary occlusion, the infarct region loses contractile function immediately and then undergoes a progressive healing process. This causes complex and time-dependent changes in infarct material properties that have not been well described experimentally. We used a theoretic approach to assess how infarct compliance effects left ventricular (LV) size and function after myocardial infarction.
Methods
We used a closed-loop lumped-parameter model of the ovine cardiovascular system developed to study the effect of infarct size and compliance on cardiovascular function. The time-varying LV function was partitioned into infarct and noninfarct regions where the parameters of each could be adjusted separately. The model incorporated an adaptive compensatory mechanism to maintain stroke volume by varying the total blood volume.
Results
For the preinfarction heart, the model produced pressure, volume, and functional results that were consistent with normal values for large animals. When infarcts of progressively larger size (5% to 25%) were introduced and stroke volume adaptation was permitted, the model produced pressure, volume, and functional results that were consistent with postinfarction values measured experimentally in large animals. Infarct size was held at 20% as infarct compliance decreased from 7 to 1 mL/mm Hg. This stiffening of the infarct resulted in reduced LV end-diastolic volume (200 to 60 mL), increased ejection fraction (0.10 to 0.30), and reduced LV end-diastolic pressure (14 to 5 mm Hg). Estimated LV oxygen consumption was also improved in the stiffer infracts.
Conclusion
Stiffer infarcts are associated with less LV dilatation, reduced filling pressures and better global LV function.
More than 1 million initial or recurrent myocardial infarctions (MIs) occur in the United States each year, and at least 90% of these patients survive their initial hospitalization [1]. Left ventricular (LV) remodeling caused by MI is responsible for nearly 70% of 5 million cases of heart failure in the United States [2]. Improved management of the healing MI to ameliorate its negative influence on the uninfarcted portion of the LV would result in an enhanced quality of life for a large number of patients and a reduction in the $30 billion yearly cost associated with treating established heart failure [1].
Impairment in cardiac function after infarction is due not only to a loss of contracting myocardium but also to the short-term and long-term mechanical and biologic effects of the infarct on the remaining normally perfused myocardium [3, 4]. Although infarct material properties (compliance) have been theoretically predicted to have significant effects on cardiac performance [5, 6], surprisingly little is known about the changes in material properties that occur as the infarct heals [7–9].
We believe that increases in material compliance (reduction in stiffness) that occur during infarct healing and maturation contribute to the immediate and progressive loss of cardiac function experienced by many patients after MI. To theoretically assess the validity of this hypothesis, we used a closed-loop lumped-parameter model of the cardiovascular system that was developed to study the effect of infarct size and compliance on cardiovascular function. The time-varying LV function was partitioned into infarct and noninfarct regions where the parameters of each could be adjusted separately. In addition, the model incorporated an adaptive compensatory mechanism to maintain stroke volume by varying the total blood volume.
Material and Methods
Cardiovascular Mathematical Modeling
Previously, we developed a closed-loop model that represents the cardiovascular system as lumped elements, with the active portion of the right and left ventricle represented as a time varying elastance [10]. For the current analysis the model was modified to include both normal and infarcted regions. LV function was divided into two components, and the value of each element was altered such that the size of the infarct and remote (uninfarcted) region could be varied along with their function. Force generation was altered in the remote region dependent on the size of the infarct, whereas time dependency of the force was invariant.
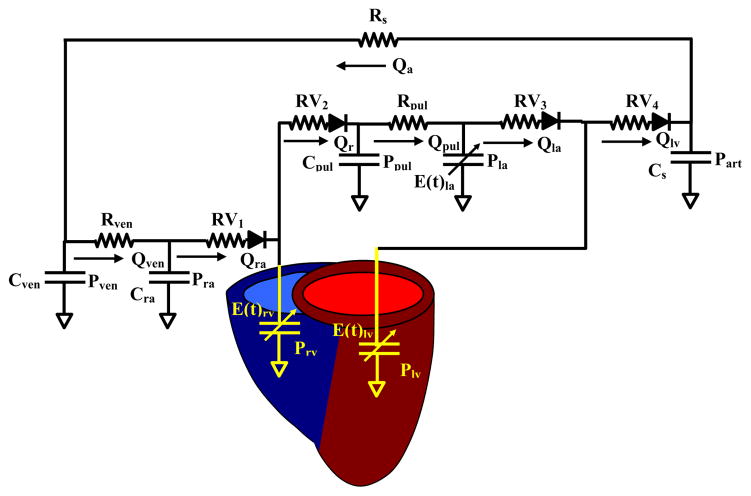
Figure 1 is an analog representation of the closed-loop cardiovascular system. The model consists of a preload section, which includes the venous and pulmonary systems and the right atrium and ventricle. Afterload section is represented as a modified Windkessel with total peripheral (Rs) and total arterial compliance (Cs). Heart valves are represented by diodes, which allow flow and resistance in the positive pressure gradient direction. Blood flow from the arterial section is applied to the venous system by Rs, resulting in a closed-loop model where total blood volume is held constant.
Fig 1.
Lumped-parameter closed-loop model of the cardiovascular system. Right and left ventricles (LV) are represented by time-varying elastance elements. LV preload consists of the venous system, pulmonary system, and right and left atrium connected in series. LV afterload is represented by a three-element Windkessel with an arterial compliance (Cs) and resistance (Rs) element. The model is made closed-loop by connecting the arterial flow (Qart) to the preload.
Equations for the complete closed-loop model were described previously and were modified to incorporate the infarct region function [10]. Venous function (Fig 1) was modeled by a lumped capacitive element (Cven), which represents the total compliance of the systemic veins, and a lumped resistive element (Rven), which represents the venous flow resistance. Venous flow (Qven) and pressure (Pven) were determined from the flow gradient between the arterial input (Qa) and right atrial (Qra) output and venous compliance (Cven) as follows:
Pulmonary flow (Qpul) pressure (Ppul) relationship results from the flow gradient between the right ventricle (Qrv) and the left atrium (Qla) and the pulmonary compliance (Cpul).
Right and left ventricles are characterized by an active and passive element, with systolic function represented by a time-varying elastance and diastolic function by a fixed compliance. For ventricular flows and pressures
Where Qrv is the right ventricular flow, Qlv is LV flow, Prv and Plv are the right and left ventricular pressures, and E(t)rv and E(t)lv are the right and left ventricular elastance. The variables used for the normal cardiovascular system are summarized in Table 1 and were derived experimentally in large-animal models [10, 11].
Table 1.
Model Variables for Normal Heart Simulation
| Variables | Value |
|---|---|
| Cardiac variables | |
| Cra | |
| RA compliance | 1.5 mL/mm Hg |
| Cla | |
| LA compliance | 4.0 mL/mm Hg |
| Klas | |
| LA contractility | 1.0 mL/mm Hg |
| Crv | |
| RV compliance | 10.0 mL/mm Hg |
| Clv | |
| LV compliance | 6.67 mL/mm Hg |
| Klvs | |
| LV contractility | 15 mL/mm Hg |
| Krvs | |
| RV contractility | 3 mL/mm Hg |
| Vascular variables | |
| Cven | |
| Venous compliance | 6.0 mL/mm Hg |
| Rven | |
| Venous resistance | 0.05 mm Hg/mL/s |
| Cpul | |
| Pulmonary compliance | 1.0 mL/mm Hg |
| Rpul | |
| Pulmonary resistance | 0.3 mm Hg/mL/s |
| Cs | |
| Arterial compliance | 0.3 mL/mm Hg |
| Rs | |
| Arterial resistance | 4.0 mm Hg/mL/s |
| Valve variables | |
| Rv1 | |
| Tricuspid valve | 0.005 mm Hg/mL/s |
| Rv2 | |
| Pulmonary valve | 0.05 mm Hg/mL/s |
| Rv3 | |
| Mitral valve | 0.2 mm Hg/mL/s |
| Rv4 | |
| Aortic valve | 0.05 mm Hg/mL/s |
C = compliance; K = contractility; LA = left atrium; RA = right atrium; ven = venous; pul = pulmonary; R = resistance.
Myocardial Regional Model
The remote (uninfarcted) region was chosen to have an active and passive component, whereas the infarct region possessed only passive function (Fig 2). Remote active and passive function elastance (E(t)lvrm) was modeled using the following:
where Klvs is the contractility, IF is the infarct factor (fraction of the LV that is infarcted), Tp is the time to peak contraction, t is time, Ts is the systolic phase time, and Clv is the passive compliance. Because the elastance in the infarct region is time-invariant, it can be expressed as:
Fig 2.
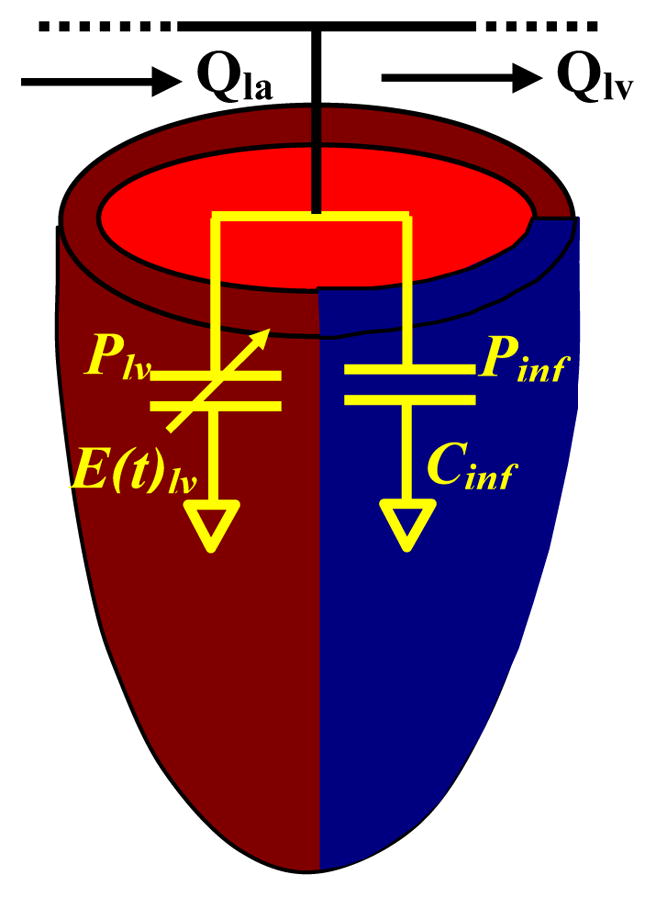
Left ventricular infarct model. Normal portion of the ventricle is represented by a fixed elastance combined with a time-varying component. In the infarct, the fixed component represents the infarct with no time-varying elastance. The elements are in parallel, with the pressure in the normal myocardium (Plv) equal to the pressure in the infarct (Pinf).
Therefore, the pressure in the LV can be expressed as
where inf denotes the infarct region and rm the remote or noninfarcted region. The remote regional value for elastance and contractility are referred to their total ventricular value. Infarct factor (IF) designates the portion of the value to be assigned.
Adaptive Model
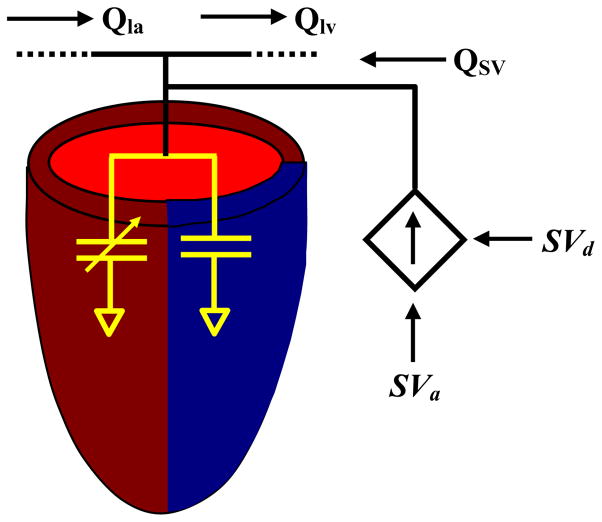
Blood volume control was incorporated into the model to provide the ability to adjust pressures and flows separate from model parameters to account for the compensatory characteristics of the cardiovascular system (Fig 3). Volume was adjusted as a function of the total blood volume (Vtotal) and the stroke volume. The desired stroke volume (SVd) altered the total volume as expressed by the following formula:
where SVa is the actual stroke volume. Volume adjustment was achieved by altering the LV pressure according to the following formula:
Fig 3.
Blood volume control model. Total blood volume is adjusted to maintain stroke volume (SV), with SVd the desired stroke volume and SVa the actual stroke volume. To adjust SV, blood volume is added to the left ventricle and the model is allowed to return to steady state before blood volume is readjusted.
The additional volume was distributed throughout the entire model resulting in a modification of the pressures and flows of the individual compartments according to the model equations.
Left Ventricular Oxygen Consumption
LV oxygen (LVO2) consumption was computed from the model according to LV pressure-volume area (PVA) method of Suga and colleagues [12, 13]. PVA is the sum of the area for the external mechanical work (EW) within the PV loop trajectory and the area (PE) bounded by the end-systolic and end-diastolic PV relationship lines and the relaxation segment of the PV loop trajectory. The following empirical formula using these areas can be used to determine the rate of oxygen consumption of the LV:
where A, B, and C are empirical constants; A is the weight given to the external work performed, B is the weight given to the potential energy performed, and C is the basal metabolic rate of oxygen consumption. Values for the empirical constants were obtained from Suga and colleagues [12, 13].
Model Protocol
The linear differential equations that represent the model were solved using the method of Runga-Kutta [14] with time increment of 0.1 μsec. Valve function was adjusted by adding statements that continuously monitor the pressure gradients across the valve opening and closing the valves accordingly. Stroke volume adjustment was performed when the model reached steady state using a statement that tested agreement with desired stroke volume. Steady state was achieved after parameter or volume adjustment by running multiple iterations and monitoring pressure changes between runs.
Results
Cardiovascular Model
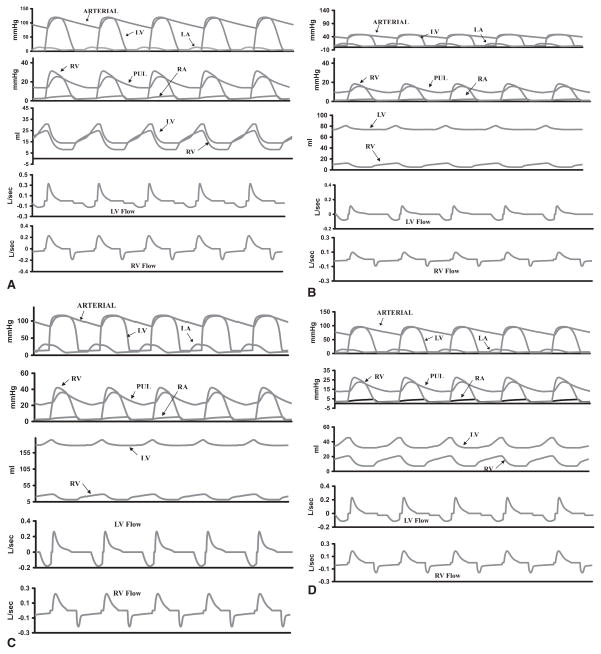
For the normal (preinfarction) heart, the selected pressure, volume, and flow waveforms (Fig 4A) were computed along with the pressure-volume loop (Fig 5). All values are consistent with those of normal large animal physiology. The LVO2 from the pressure-volume loop was calculated to be 5.9 × 10⁻² mL O2/beat, which is in the normal range observed by Suga and colleagues [12, 13].
Fig 4.
(A) Hemodynamics for the model with normal left ventricle (LV) simulation after steady state is reached. LV and right ventricular (RV) pressures, flows, and volumes are within normal ranges, as is the systemic and pulmonary (PUL) pressures. (B) Uncompensated LV with 20% infarct and infarct compliance = 7 mL/mm Hg. (C) Compensated LV with 20% infarct with infarct compliance = 7 mL/mm Hg. (D) Compensated LV with 20% infarct with compliance = 1 mL/mm Hg. LA = left atrium; RA = right atrium.
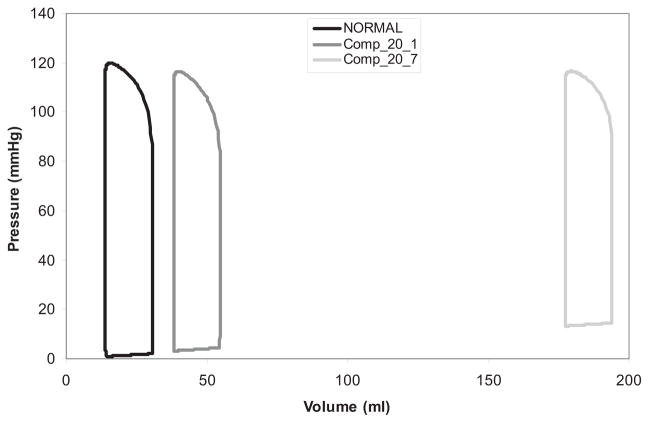
Fig 5.
Pressure-volume (PV) loops generated for model simulations. Normal PV loop for normal (noninfarcted) simulation. With a 20% infarct, the compensated simulation indicates a greater rightward shift in the PV loop for the more compliant infarct (green) compared with the stiffest infarct (yellow).
Infarct Size
The model was applied first to investigate the effect of infarct size on cardiac performance. Infarct size was adjusted by varying IF in the model equations in the range from 0.05 to 0.25, corresponding to a 5% to 25% infarct, while all other model parameters were unchanged. Infarct compliance was set at 7 mL/mm Hg.
Representative waveforms for a 20% uncompensated infarct are shown in Figure 4B. Increased infarct size increased end-diastolic volume (EDV), end-diastolic pressure (EDP), and decreased ejection fraction (EF; Fig 6). In addition, LV pressure and stroke volume decreased while LVO2 had a biphasic response to infarct size (Fig 6).
Fig 6.
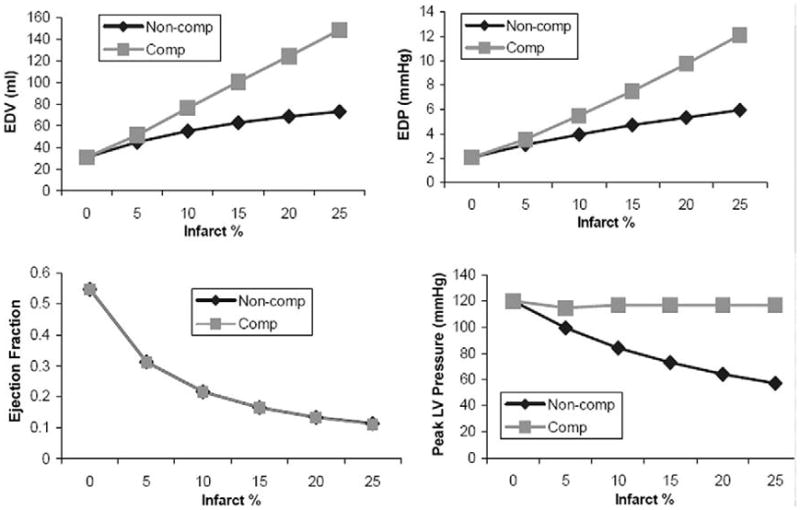
Hemodynamic performance as a function of infarct size for stroke volume compensated and noncompensated simulations with infarct compliance = 7 mL/mm Hg. Left ventricular (LV) end-diastolic volume (EDV) and end-diastolic pressure (EDP) increase with infarct size for both compensated and noncompensated models. Ejection fraction (EF) decreases with infarct size. Compensation (Comp) has no effect on EF due to an increase in EDV and a constant LV stroke volume (LVSV). The SV compensation maintains peak LV pressure; however, in the non-compensated (Non-Comp) model, pressure decreases as infarct size increases. In the noncompensated model, LV oxygen consumption (LVO2) decreases slightly with infarct size. After compensation, LVO2 increases with increasing infarct size. This result is due primarily to the maintenance of normal LV pressure in the compensated model.
Adjusting total blood volume in the model equations to maintain normal stroke volume altered the response of the LV function to infarct size and resulted in hemodynamic and LV volume values that were more consistent with our experience with experimental infarct models [15–17]. Hemodynamic waveforms for a compensated 20% infarct are shown in Figure 4C. EDV, ESV, EDP, EF, and LVO2 for compensated and uncompensated models are depicted in Figure 6.
Infarct Compliance
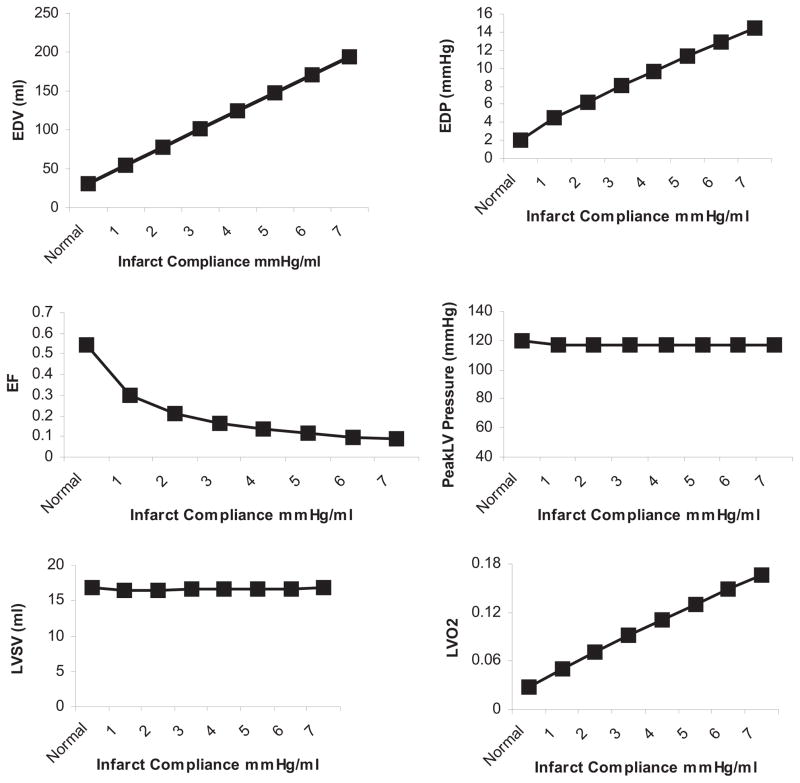
The model was next applied to study the effect of infarct compliance on compensated LV function. Infarct size was held constant at 20%, while infarct compliance was varied from 1 mL/mm Hg (stiffer) to 7 mL/mm Hg (less stiff), which was chosen to represent no change in normal passive myocardial material properties (7 mL/mm Hg) to a stiffening of the infarct region. All other model parameters were maintained. Representative waveforms for compensated infarct with a compliance of 7 mL/mm Hg and 1 mL/mm Hg are shown in Figures 4C and D, respectively. A stiffer infarct (decreased compliance) decreased EDV, ESV, EDP, and LVO2 over the range of infarct compliances as EF, SV, and LV pressure remained constant (Fig 7).
Fig 7.
Increasing infarct stiffness (decreased compliance) improves left ventricular (LV) end-diastolic volume (EDV), LV end-diastolic pressure (EDP), ejection fraction (EF), and LV oxygen consumption (LVO2) in the stroke volume (SV) compensated model of a 20% infarct. SV and peak systolic pressure are maintained in the compensated model. Normal = preinfarction values.
Pressure-volumes loops for the maximum and minimum infarct compliances studied demonstrate a shift upwards and to the right after infarction; however, the shift was far greater for the more compliant infarct (Fig 5).
Comment
This investigation of infarct material properties using a closed-loop lumped-parameter model of the cardiovascular system combined with stoke volume adaptation produces a physiologically realistic simulation. Incorporating the loading conditions into the model provides boundary conditions for the LV pressures and flows, which are omitted from isolated LV finite element models. In addition, coupling the output flow and pressure to the input conserves the blood volume limiting the LV dimensions for a given total blood volume. Finally, regulating stroke volume makes it possible to ascertain the effect of infarct material properties under similar loading conditions.
The hemodynamic, LV volume, and functional output results produced from our closed-loop model for the normal uninfarcted heart were within accepted normal ranges and consistent with our experience with experimental large-animal models [15–17]. Introduction of a MI into the model without regard to cardiovascular adaptability led to results that were not consistent with hemodynamic stability and short-term survival. Allowing for compensation to maintain stroke volume resulted in hemodynamic, LV volume, and functional output that were, again, very similar to what we have described after infarction of between 15% and 25% of the LV mass in large-animal models [15–17]. We believe that these results support the soundness of the compensated model and validate subsequent results reported for a spectrum of infarct compliances.
The effects of varying infarct compliance in the compensated model are presented in Figure 7. These results provide compelling evidence that infarct stiffening should lead to less LV dilatation, improved EF, and enhanced efficiency (less oxygen consumption). Interestingly, infarct stiffening is not predicted to compromise LV diastolic function, because LV EDP was found to decrease almost linearly with infarct stiffening. This seemingly paradoxic effect is due to the large increase in LV volume required to maintain stroke volume with more compliant infarct material properties and could be the rational for progressive dilatation [3, 4].
Although our approach only provides results at a given point in time and does not model time-dependent variations in infarct material properties or inherent changes that occur in the myocardium outside the infarct, our analysis does provide insight into the mechanism of post-MI remodeling. LV remodeling after MI is manifest by progressive LV dilatation, reduction in EF, and increased filling pressures; one explanation for this phenomenon based on our results would be that infarcts become more compliant as they heal and mature. Work by Gupta and colleagues [9] support this hypothesis. These investigators used a biaxial force-extension apparatus to assess tissue material properties and demonstrated that transmural apical infarcts from sheep become more compliant between 2 and 6 weeks after coronary occlusion. They also reported that infarct stiffness was not dependent on collagen content, which was demonstrated to increase even as the infarct became more compliant.
Our results also support the potential therapeutic value of stiffening the infarct as a means of preventing, limiting, or reversing LV remodeling after MI. Virtually nothing is known regarding the time-dependent changes that occur in infarct material properties after 6 weeks. Such data would be of great value in determining the therapeutic window of opportunity during which strategies to stiffen infarcts might be beneficial. In addition, our results suggest that a noninvasive diagnostic modality for assessing infarct material in vivo would be a powerful tool for stratifying patients after MI who are at increased risk for adverse post-MI LV remodeling in the future.
We have done extensive experimental work to assess the efficacy of early post-MI ventricular restraint in preventing adverse remodeling [15–17]. Our results in these past experiments demonstrated that restraint approaches are highly effective in limiting LV remodeling. Our laboratory experience suggests that whole heart wrapping is most effective [16], but we are pessimistic that a surgically placed LV restraining mechanism will ever gain acceptance, especially in the very early post-MI period. The results of the current study imply that directly altering material properties of the infarct alone should be beneficial. The best technique for effectively increasing infarct stiffness remains to be determined, but early preclinical studies suggest that this therapeutic goal may be accomplished by the catheter-based delivery of biomaterials into the infarct [18–21].
Although illustrative, our theoretic approach is a simplification of a highly complex, time-dependent, mechanical-biologic process. Inherent to our method is the assumption that the properties, both passive and active, of the myocardium outside the infarct remain unchanged. These assumptions are likely valid in the early post-MI period but probably breakdown substantially as remodeling progresses and LV wall stress increases [22], leading to changes in both the active and passive myocardial material properties [23]. It is quite possible that infarct material properties stabilize or ultimately become stiffer with time and that it is changes in the tissue characteristics of the perfused myocardium that drive later remodeling. This is an important distinction, with implications for directing where and when therapy would best be applied.
This study, in conjunction with the past work of other investigators [5, 24], emphasizes the potential importance of infarct material properties on global LV remodeling and function. Technologic advances in biomaterial and catheter engineering raise the possibility of modifying infarct material properties early after MI by percutaneous approaches in the near future. The successful application of this novel therapeutic approach will be dependent on a better understanding of the time-dependent changes that occur in healing and mature MI region.
Finite element modeling of infarcted/remodeled heart as reported by other investigators [23–25] has taught us a great deal about stress distribution within the remodeled ventricle. The finite element modeling approach allows for infarct location, fiber angles, and complex LV geometry to be modeled. It is limited, however, by a lack of preload and afterload boundary conditions that are essential for evaluating the effect of infarct material properties on global cardiac performance under physiologic loading conditions. It would be optimal to link the loading boundary conditions of our lumped-parameter approach with finite element modeling and state-of-the-art cardiac imaging. Theoretically, this would allow time-dependent regional stress and regional material properties (passive and active) to be assessed under physiologic loading conditions. The optimal infarct stiffness at given time after infarction could also be accurately predicted. Such an elegant approach is possible [26] but will require significant time and a collaborative effort to validate and implement.
The theoretic approach presented in this article allows us to say with confidence that infarct stiffening is quite likely to improve global systolic performance after MI and not impair diastolic function; however, we can say little about what the optimal timing for stiffening is or what the optimal stiffness should be at a given time during the remodeling process. These questions in all likelihood will require preclinical and clinical experiments to answer.
Acknowledgments
This research was supported by National Institutes of Health grants HL63954 (RCG), HL71137 (RCG), HL76560 (JHG), and by individual Established Investigator Awards from the American Heart Association (RCG, JHG).
References
- 1.Rosamond W, Flegal K, Furie K, et al. Heart disease and stroke statistics–2008 update: a report from the American Heart Association Statistics Committee and Stroke Statistics Subcommittee. Circulation. 2008;117:e25–146. doi: 10.1161/CIRCULATIONAHA.107.187998. [DOI] [PubMed] [Google Scholar]
- 2.Gheorghiade M, Bonow RO. Chronic heart failure in the United States: a manifestation of coronary artery disease. Circulation. 1998;97:282–9. doi: 10.1161/01.cir.97.3.282. [DOI] [PubMed] [Google Scholar]
- 3.Jackson BM, Gorman JH, 3rd, Moainie S, et al. Extension of borderzone myocardium in postinfarction dilated cardiomyopathy. J Am Coll Cardiol. 2002;40:1160–7. doi: 10.1016/s0735-1097(02)02121-6. [DOI] [PubMed] [Google Scholar]
- 4.Ratcliffe MB. Non ischemic infarct expansion. J Am Coll Cardiol. 2002;40:1168–71. [Google Scholar]
- 5.Bogen DK, Rabinowitz SA, Needleman A, McMahon TA, Abelmann WH. An analysis of the mechanical disadvantage of myocardial infarction in the canine left ventricle. Circ Res. 1980;47:728–41. doi: 10.1161/01.res.47.5.728. [DOI] [PubMed] [Google Scholar]
- 6.Janz RF, Waldron RJ. Predicted effect of chronic apical aneurysms on the passive stiffness of the human left ventricle. Circ Res. 1978;42:255–63. doi: 10.1161/01.res.42.2.255. [DOI] [PubMed] [Google Scholar]
- 7.Parmley WW, Chuck L, Kivowitz C, Matloff JM, Swan HJ. In vitro length tension relations of human ventricular aneurysms. Relation of stiffness to mechanical disadvantage. Am J Cardiol. 1973;32:889–94. doi: 10.1016/s0002-9149(73)80153-5. [DOI] [PubMed] [Google Scholar]
- 8.Laird JD, Vellekoop HP. Time course of passive elasticity of myocardial tissue following experimental infarction in rabbits and its relation to mechanical dysfunction. Circ Res. 1977;41:715–21. doi: 10.1161/01.res.41.5.715. [DOI] [PubMed] [Google Scholar]
- 9.Gupta KB, Ratcliffe MB, Fallert MA, Edmunds LH, Jr, Bogen DK. Changes in passive mechanical stiffness of myocardial tissue with aneurysm formation. Circulation. 1994;89:2315–26. doi: 10.1161/01.cir.89.5.2315. [DOI] [PubMed] [Google Scholar]
- 10.Drzewiecki GM, Pilla JJ, Welkowitz W. Design and control of the atrio-aortic left ventricular assist device based on O2 consumption. IEEE Trans Biomed Eng. 1990;37:128–37. doi: 10.1109/10.46252. [DOI] [PubMed] [Google Scholar]
- 11.Pilla JJ, Blom AS, Brockman DJ, Ferrari VA, Yuan Q, Acker MA. Passive ventricular constraint to improve left ventricular function and mechanics in an ovine model of heart failure secondary to acute myocardial infarction. J Thorac Cardiovasc Surg. 2003;126:1467–76. doi: 10.1016/s0022-5223(03)00739-6. [DOI] [PubMed] [Google Scholar]
- 12.Suga H, Hayashi T, Shirahata M, Suehiro S, Hisano R. Regression of cardiac oxygen consumption on ventricular pressure volume area in dog. Am J Physiol. 1981;240:H320–5. doi: 10.1152/ajpheart.1981.240.3.H320. [DOI] [PubMed] [Google Scholar]
- 13.Suga H, Hayaski T, Shirahata M. Ventricular systolic pressure-volume area as a predictor of cardiac oxygen consumption. Am J Physiol. 1981;240:H39–44. doi: 10.1152/ajpheart.1981.240.1.H39. [DOI] [PubMed] [Google Scholar]
- 14.Gerald CF. Applied numerical analysis. 2. Reading, MA: Addison-Wesley; 1977. [Google Scholar]
- 15.Kelley ST, Malekan R, Jackson BM, et al. Restraining infarct expansion preserves left ventricular geometry and function after acute anteroapical infarction. Circulation. 1999;99:135–42. doi: 10.1161/01.cir.99.1.135. [DOI] [PubMed] [Google Scholar]
- 16.Enomoto Y, Gorman JH, 3rd, Moainie SL, et al. Early ventricular restraint after myocardial infarction: the extent of the wrap determines the outcome of remodeling. Ann Thorac Surg. 2005;79:881–7. doi: 10.1016/j.athoracsur.2004.05.072. [DOI] [PubMed] [Google Scholar]
- 17.Pilla JJ, Blom AS, Gorman JH, 3rd, et al. Early post infarction ventricular restraint improves borderzone wall thickening dynamics during remodeling. Ann Thorac Surg. 2005;80:2257–62. doi: 10.1016/j.athoracsur.2005.05.089. [DOI] [PubMed] [Google Scholar]
- 18.Dai W, Wold LE, Dow JS, Kloner RA. Thickening of the infarcted wall by collagen injection improves left ventricular function in rats: a novel approach to preserve cardiac function after myocardial infarction. J Am Coll Cardiol. 2005;46:714–9. doi: 10.1016/j.jacc.2005.04.056. [DOI] [PubMed] [Google Scholar]
- 19.Ryan LP, Matsusaki K, Noma M, et al. Dermal filler injection: a novel approach for limiting infarct expansion. Ann Thorac Surgery. 2009 doi: 10.1016/j.athoracsur.2008.09.028. [in press] [DOI] [PMC free article] [PubMed] [Google Scholar]
- 20.Christman KL, Lee RJ. Biomaterials for the treatment of myocardial infarction. J Am Coll Cardiol. 2006;48:907–13. doi: 10.1016/j.jacc.2006.06.005. [DOI] [PubMed] [Google Scholar]
- 21.Sherman W, Martens TP, Viles-Gonzalez JF, Siminiak T. Catheter-based delivery of cells to the heart. Nat Clin Pract Cardiovasc Med. 2006;3(suppl 1):S57–64. doi: 10.1038/ncpcardio0446. [DOI] [PubMed] [Google Scholar]
- 22.Jackson BM, Gorman JH, 3rd, Salgo IS, et al. Border zone geometry increases wall stress after myocardial infarction: contrast echocardiographic assessment. Am J Physiol Heart Circ Physiol. 2003;284:H475–9. doi: 10.1152/ajpheart.00360.2002. [DOI] [PubMed] [Google Scholar]
- 23.Guccione JM, Moonly SM, Moustakidis P, et al. Mechanism underlying mechanical dysfunction in the borderzone of left ventricular aneurysm: a finite element model study. Ann Thorac Surg. 2001;71:654–62. doi: 10.1016/s0003-4975(00)02338-9. [DOI] [PubMed] [Google Scholar]
- 24.Wall ST, Walker JC, Healy KE, Ratcliffe MB, Guccione JM. Theoretical impact of the injection of material into the myocardium: a finite element model simulation. Circulation. 2006;114:2627–35. doi: 10.1161/CIRCULATIONAHA.106.657270. [DOI] [PubMed] [Google Scholar]
- 25.Kerckhoffs RCP, Healy SN, Usyk TP, McCulloch AD. Computational modeling of cardiac electromechanics. Proc IEEE. 2006;94:769–83. [Google Scholar]
- 26.Kerckhoffs RCP, Neal ML, Gu Q, Bassingthwaighte JB, Owens JH, McCulloch AD. Coupling of a finite element model of cardiac ventricular mechanics to lumped systems models of the systemic and pulmonic circulation. Ann Biomed Eng. 2007;35:1–18. doi: 10.1007/s10439-006-9212-7. [DOI] [PMC free article] [PubMed] [Google Scholar]


