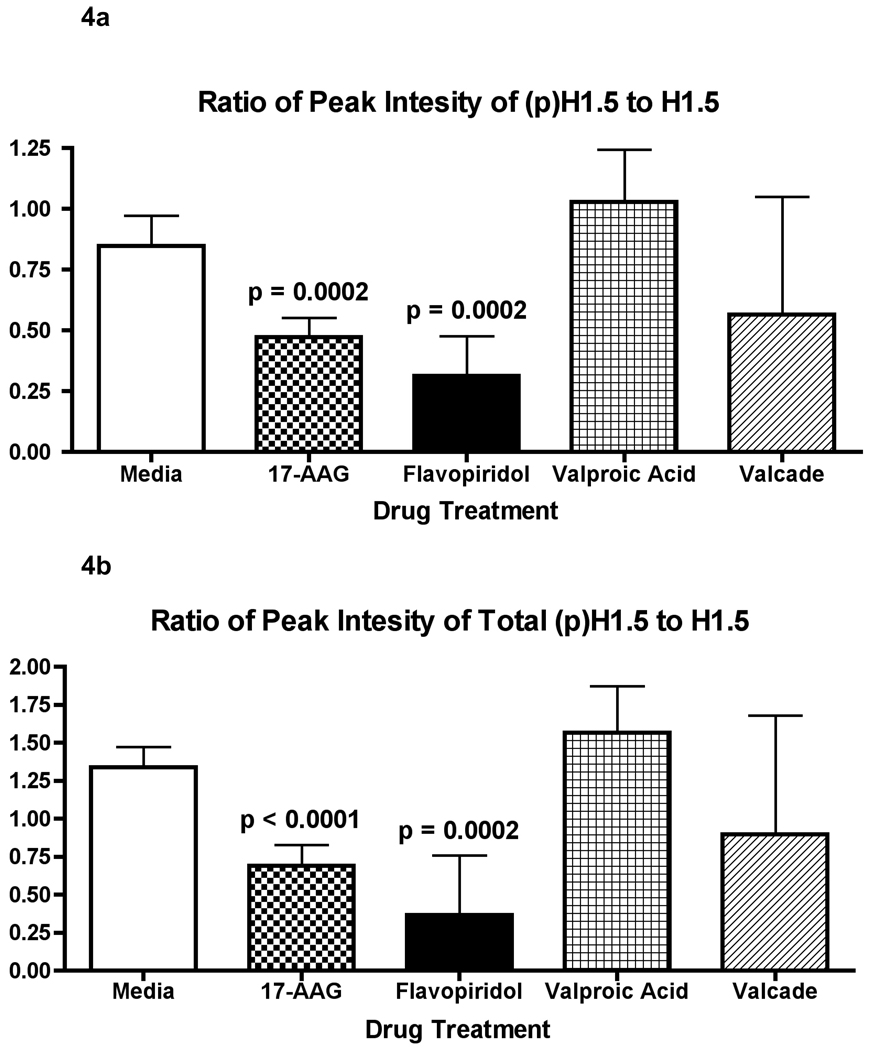
Figure 4.
Bar chart depicting the changes in the monophosphorylated (top) and total phosphorylated (bottom) H1.5 peak abundance in response to each drug treatment. The charts show the significant decrease in the peak ratios for the flavopiridol and 17AAG drug treatments when compared to the untreated Kasumi control as determined by a student’s t-test (N=3–4 for each sample). The other drug treatment’s abundance ratios were not significantly different from the Kasumi control abundance ratio. The error bars show the 95% confidence interval for the abundance ratios.

