Abstract
Purpose: To experimentally investigate whether a computed tomography (CT) system based on CdZnTe (CZT) detectors in conjunction with a least-squares parameter estimation technique can be used to decompose four different materials.
Methods: The material decomposition process was divided into a segmentation task and a quantification task. A least-squares minimization algorithm was used to decompose materials with five measurements of the energy dependent linear attenuation coefficients. A small field-of-view energy discriminating CT system was built. The CT system consisted of an x-ray tube, a rotational stage, and an array of CZT detectors. The CZT array was composed of 64 pixels, each of which is 0.8×0.8×3 mm. Images were acquired at 80 kVp in fluoroscopic mode at 50 ms per frame. The detector resolved the x-ray spectrum into energy bins of 22–32, 33–39, 40–46, 47–56, and 57–80 keV. Four phantoms were constructed from polymethylmethacrylate (PMMA), polyethylene, polyoxymethylene, hydroxyapatite, and iodine. Three phantoms were composed of three materials with embedded hydroxyapatite (50, 150, 250, and 350 mg∕ml) and iodine (4, 8, 12, and 16 mg∕ml) contrast elements. One phantom was composed of four materials with embedded hydroxyapatite (150 and 350 mg∕ml) and iodine (8 and 16 mg∕ml). Calibrations consisted of PMMA phantoms with either hydroxyapatite (100, 200, 300, 400, and 500 mg∕ml) or iodine (5, 15, 25, 35, and 45 mg∕ml) embedded. Filtered backprojection and a ramp filter were used to reconstruct images from each energy bin. Material segmentation and quantification were performed and compared between different phantoms.
Results: All phantoms were decomposed accurately, but some voxels in the base material regions were incorrectly identified. Average quantification errors of hydroxyapatite∕iodine were 9.26∕7.13%, 7.73∕5.58%, and 12.93∕8.23% for the three-material PMMA, polyethylene, and polyoxymethylene phantoms, respectively. The average errors for the four-material phantom were 15.62% and 2.76% for hydroxyapatite and iodine, respectively.
Conclusions: The calibrated least-squares minimization technique of decomposition performed well in breast imaging tasks with an energy resolving detector. This method can provide material basis images containing concentrations of the relevant materials that can potentially be valuable in the diagnostic process.
Keywords: material decomposition, energy resolving detector, CT, breast imaging
INTRODUCTION
The energy dependence of the x-ray attenuation coefficients can be exploited to identify and quantify specific materials.1 In computed tomography (CT), the decomposition process can be accomplished in the projection domain (prereconstruction) or the image domain (postreconstruction).2 In the projection domain, the line integral through the object is separated into different components,1, 3, 4 whereas in the image domain, each voxel is decomposed into different constituent basis materials.2, 5, 6 While the projection-based method is advantageous because it eliminates the beam hardening effect, the image-based method is computationally simpler.6 Nevertheless, in both methods, the traditional assumption is that each element to be decomposed contains some fraction of the basis material. In this paper, we will report on an image-based method that deviates from this idea by assuming that each voxel primarily contains one basis material. Phantom experiments were performed to verify this method on a prototype computed tomography system with an energy resolving detector.
Basis functions for decomposition algorithms are based on one of two types: The physical processes of x-ray attenuation1, 5, 7 or the specific elements and compounds.3, 4, 8 Attenuation in the x-ray diagnostic range is the result of a combination of the photoelectric effect and the Compton scattering process9
| (1) |
where μ is the linear attenuation coefficient that is dependent on photon energy E and position , a is the local density of either the photoelectric effect (subscript p) or the Compton scattering (subscript c), and f is the mass attenuation functions of the two physical processes. The objective of material decomposition is to solve for the local densities and relate them to more meaningful quantities. This formalism has previously been used to solve for the spectral components in the projection domain1 and to estimate the effective density and atomic number in the image domain.5 An alternative method demes the basis functions as materials that are similar to different tissues. Traditionally, polymethylmethacrylate (PMMA) and aluminum were used for dual-energy decomposition to separate soft tissue and bone.10 But the number and identity of the basis materials can be different, depending on the imaging task and system properties. In this case, the μ can be formulated by
| (2) |
where a is now the local density of the chosen material (m’s) and μm is the mass attenuation coefficients as a function of photon energy. Solving for the local densities typically requires a calibration process to measure the attenuation properties of each material. This formalism was used to decompose two materials5, 6 and three materials in the image domain.2
Due to limitations of x-ray detector technology, previous investigations primarily focused on the dual-energy methods. Techniques such as fast kVp switching,11 dual source CT,2 and layered detectors12 were used to produce two attenuation measurements of the same object at different energies. Recent advances in semiconductor materials has made it possible to produce energy resolving detectors that can provide multiple energy measurements of the object in one acquisition.13 Currently, detectors based on CdZnTe (CZT) crystals have the ability to resolve the x-ray spectrum into five to eight energy bins.7, 14, 15, 16 Linear attenuation coefficients from these energy bins can be used to decompose two or more materials. Parameter estimation algorithms can be used for cases in which the number of attenuation measurements is more than the number of unknowns (number of material basis). The maximum likelihood estimation technique was used to decompose materials with prominent k-edge(s) such as gadolinium and iodine.7, 17 This “k-edge” algorithm was implemented in the projection space. Although their technique performed well for gadolinium and iodine, it is not designed for materials without a k-edge. Our technique performs parameter estimation by minimizing the least-squares. It is able to decompose materials both with and without prominent k-edges in the diagnostic energy range. A key feature is that the algorithm separates the decomposition implementation into a segmentation and a quantification task. This separation is possible because it is applied in the reconstructed image space where each voxel is not a line integral but a specific location in space.
The purpose of this study is to test the proposed decomposition technique for materials relevant to breast computed tomography. Breast CT with charge integrating flat-panel detectors are currently in the clinical trial phase and has shown to have advantages over other breast imaging modalities.18 Some authors have proposed using energy discriminating detectors for breast CT to improve image quality and reduce patient dose.14, 15, 19 Simulations showed that for various breast imaging tasks, the contrast-to-noise ratio can be increased by a factor of 1.28–1.57 with optimal energy weighting.19 Experimental comparison between a CZT detector and a CsI indirect flat-panel detector showed an increased in CNR of 1.25–1.35.15 This increase in image quality can be translated to dose reduction if the image quality is kept the same between the imaging systems. Dose reductions were found to be 47%–52% with a CZT computed tomography system.15 With energy-resolved data, four-material decomposition is possible and it is useful in the case of contrast-enhanced breast CT. With one image acquisition, the relevant materials, such as calcifications, iodine contrast, and glandular and adipose tissue, can be identified and quantified. It is beneficial to have this capability because the properties of calcifications can determine malignancy20 or risks for heart disease.21 Regions of iodine contrast accumulation indicate increased angiogenesis in neoplasm.22 Glandular and adipose tissue quantification provides the capability to measure breast density, where an increase in density indicates an increase in one’s risk of developing breast cancer. It is also possible to use temporal subtraction of contrast-enhanced images to accurately isolate the iodine signal.23 However, the acquisition of the precontrast image would impart additional radiation dose to the patient. With energy discriminating CT, a precontrast image is not needed for material separation.
The primary purpose of this paper is to evaluate a general parameter estimation method to decompose up to four materials using five spectral measurements. A simulation study evaluating the technique’s potential were performed and reported in a companion paper. This study provides an experimental validation of the technique in phantoms relevant to breast imaging. Although this study is focused on a breast imaging task, the technique can be applied generally to any material. However, each imaging task will need to be individually investigated with the corresponding materials.
METHODS
This section is divided into four parts: Theory, CZT CT system, phantom description, and data analysis. The decomposition algorithm was chosen because it performed the best out of the three least-squares parameter estimation techniques that were described in the companion simulation paper. This algorithm is summarized here.
Theory
In energy-resolved computed tomography, the measured linear attenuation coefficient is a function of both the spatial coordinates and the energy bin (B). Its value is dependent on the concentration and mass attenuation coefficient [μM,i(B)] of the constituent materials (i)
| (3) |
where K is the total number of materials. If the partial-volume effect is negligible, then each voxel can be treated as consisting of one material. In this case, only depends on one material
| (4) |
The decomposition algorithm first identifies the material and then computes its concentration. Thus, it is divided into a segmentation task and a quantification task. For the segmentation task, the identity of the material at each voxel can be determined by least-squares minimization
| (5) |
where J is the number of energy bins that the detector can resolve. Accordingly, the quantification task is computed by
| (6) |
The average mass attenuation coefficients μM,i(B) at each energy bin can be computed based on a preattenuated x-ray beam (the beam that exits the x-ray tube). However, the beam hardening effect changes the detected μM,i(B). As photons travel through an object, low energy photons are preferentially attenuated over higher energy ones, which results in a beam that “hardens” or contains relatively more high energy photons. The average attenuation coefficient also changes because it is dependent on the x-ray spectrum. Furthermore, the detector response function also affects the effective coefficient. To account for these effects on the attenuation coefficients, μM,i(B) can be obtained from a calibration process. A similar calibration technique was performed by Johns et al.24, 25 for their dual-energy method in the projection domain. For contrast elements that have varying concentrations, such as hydroxyapatite and iodine, the calibration consists of measuring the linear attenuation coefficients at different concentrations and extracting the effective mass attenuation coefficients. For glandular and adipose tissues, the mass attenuation coefficients can be extracted by imaging a region with homogeneous density. The calibrated μM,i(B) can be obtained as follows:
| (7) |
where d refers to each concentration point in the calibration and Q denotes the total number of concentrations. Since the purpose is to quantify the contrast elements (hydroxyapatite and iodine), different concentrations of these materials were used. From our experience, the observer can visually distinguish glandular and adipose tissues on breast CT with relative ease. For these two tissues, the μL,i(B) can be obtained directly from the energy-resolved CT data with a region-of-interest (ROI) in the corresponding tissue type
| (8) |
where l refers to the pixel and V denotes the total number of pixels in the ROI.
Small field-of-view CZT CT system
System description
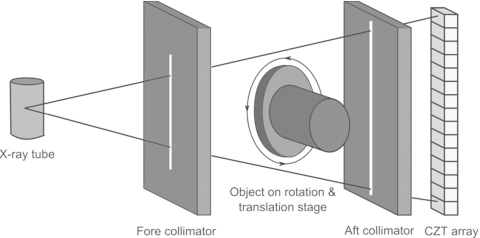
All images were acquired with a computed tomography system built with an energy resolving detector made of CZT crystals. The system consisted of a tungsten target x-ray tube (Dynamax 78E) coupled to a Phillips Optimus M200 x-ray generator and a CZT array. A high precision motor (Kollmorgen Goldline DDR D062M, Danaher Motion, Wood Dale, IL) provided the rotational mechanism and also served as a platform for the object. The system was mounted on an optical bench with the CZT (eV2500, eV Microelectronics Inc., Saxonburg, PA) detector aligned with the central ray of the x-ray beam. The detector consisted of a row of four CZT crystals of 12.8 mm in length and 3 mm in thickness. Each crystal was divided into 16 pixels with a pitch of 0.8 mm, yielding a total of 64 pixels that were 51.2 mm in length. The x-ray detection process starts when photons are absorbed in the crystals, causing the generation of electrons and holes that propagate in opposite directions according to a bias voltage (300 V) on the crystal’s surfaces. These electrical charges create a current that is amplified and collected by downstream integrated circuits. Our CZT system has five comparators that sort the photons into five energy ranges. The energy of an incoming photon is compared to a user-selectable threshold. The corresponding counters increase by increments of one if the voltage is greater than the threshold. The total photon count in each energy bin is obtained by finding the difference between counters of consecutive thresholds. Figure 1 shows a schematic of the CZT setup. The source-to-image distance of the system was 1.4 m and the source-to-object distance was 1 m. Slit collimators were constructed from lead sheets that were 3 mm thick. A 0.3 mm slit fore collimator shaped the beam while a 0.8 mm slit aft collimator rejected scattered x rays.
Figure 1.
Schematic of the CZT system.
Acquisition parameters
CZT data were acquired in the fluoroscopic mode because the detectors require a low tube output.15 The x-ray technique used was 80 kVp and 1 mA. The phantoms were rotated at 0.98 RPM for 360°, giving 1229 frames per scan at 50 ms per frame. The resulting air kerma at the isocenter was 4.85 mGy. Photon counts for each energy bin were obtained with proprietary software (eV Microelectronics, Saxonburg, PA). The detector communicated with a workstation through a USB port. Preliminary tests showed that the optimal lowest energy threshold to eliminate electronic noise was 22 keV. The energy ranges were set at 22–32, 33–39, 40–46, 47–56, and 57–80 keV. These thresholds were chosen because they allow the detector to obtain approximately the same number of photon counts in the open field images of each energy bin.
Phantom description
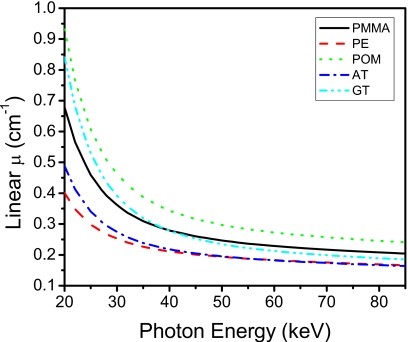
Phantoms were constructed to test the technique’s performance. Phantom materials needed for breast imaging are adipose tissue, glandular tissue, hydroxyapatite, and iodine. Glandular and adipose tissues are the two principle components of a breast. Microcalcification (hydroxyapatite) is often observed on mammographic images as clusters of calcifications and is indicative of underlying pathology.26 Iodine is used as the contrast agent in contrast-enhanced imaging to better visualize the breast vasculature and abnormal angiogenesis.27 We investigated the algorithm on phantoms that were composed of both three materials and four materials. PMMA and polyethylene were used to simulate soft tissues. Figure 2 shows the similarity in linear attenuation coefficients of PMMA and polyethylene to glandular and adipose tissues, respectively. Different hydroxyapatite concentrations were made by mixing corresponding amounts of hydroxyapatite powder (Acros Organics, Morris Planes, NJ) with a polymeric casting resin (ETI, Fields Landing, CA). Similarly, different iodine concentrations were obtained by diluting an iodinated contrast material (Omnipaque Injection 350 mg∕ml, GE Healthcare Inc., Princeton, NJ) in water. Each phantom consisted of “base” materials and embedded contrast elements. Base materials refer to PMMA and polyethylene, whereas contrast elements refer to hydroxyapatite and iodine. There were three types of constructed phantoms: Three-material, four-material, and calibration.
Figure 2.
Linear attenuation coefficients of the plastics used in the base material of the phantoms. Adipose (AT) and glandular (GT) tissues are also shown for comparison. PMMA=polymethylmethacrylate, PE=polyethylene, and POM=polyoxymethylene.
Three-material phantoms
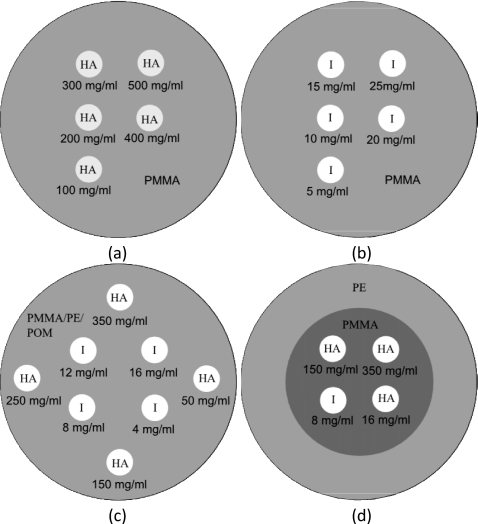
Three different phantoms were constructed, which consisted of three different materials [Fig. 3c]. In the first phantom, the base material was PMMA and the contrast elements were hydroxyapatite and iodine. A PMMA cylinder of 3.175 cm in diameter was used to embed eight wells that were 0.5 cm in diameter. Four of the wells contained hydroxyapatite of 50, 150, 250, and 350 mg∕ml. The other four wells contained iodine of 4, 8, 12, and 16 mg∕ml. The second phantom had the same geometry and concentrations of contrast elements except that the base material was polyethylene. The third phantom also had the same configuration except that the base material was polyoxymethylene. The polyoxymethylene phantom was added to test the method on a base material whose density (1.41 g∕ml) is significantly different from glandular and adipose tissues.
Figure 3.
Diagrams of the calibration phantoms with (a) hydroxyapatite and (b) iodine contrast elements and measurement phantoms of (c) three and (d) four materials. PMMA=polymethylmethacrylate, PE=polyethylene, POM=polyoxymethylene, HA=hydroxyapatite, and I=iodine.
Four-material phantom
One phantom consisted of four materials. Its diameter was also 3.175 cm [Fig. 3d]. It contained PMMA and polyethylene as the base materials and hydroxyapatite and iodine as the contrast elements. Polyethylene resided in periphery and made up 70% of the total area, while PMMA was centrally located and made up 30% of the total area. The ratio of polyethylene and PMMA were chosen to approximately equal to the adipose and glandular content of an average breast.28 Embedded in the PMMA region were two concentrations of hydroxyapatite (150 and 350 mg∕ml) and two concentrations of iodine (8 and 16 mg∕ml).
Calibration phantoms
Similar phantom geometry was used for calibration. The base cylinders were 3.175 cm and the wells were 0.5 cm in diameter. Two phantoms were made to separately calibrate hydroxyapatite and iodine [Figs. 4a, 4b]. They consisted of PMMA as the base material. The five concentrations of hydroxyapatite were 100, 200, 300, 400, and 500 mg∕ml and iodine were 5, 10, 15, 20, and 25 mg∕ml. The calibration phantoms were scanned using the same techniques as the measurement phantoms.
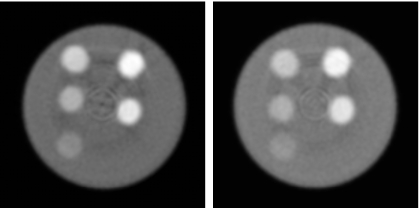
Figure 4.
Photon counting CT images of hydroxyapatite calibration (left) and iodine calibration (right) phantoms (L∕W:0.010∕0.02 mm−1).
Data analysis
The segmentation task was evaluated qualitatively for all phantoms. The quantification task was evaluated by comparing the measured concentrations of contrast elements to their known concentrations. The mean and standard deviation of the values for each contrast element were measured with a 10-pixel-diameter ROI. Linear regressions were performed with the MATLAB Curve Fitting Toolbox.
RESULTS
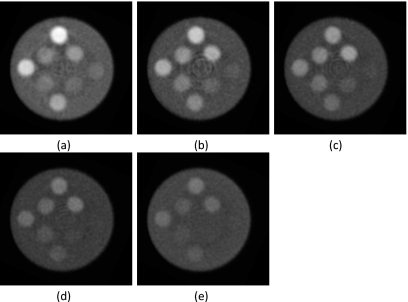
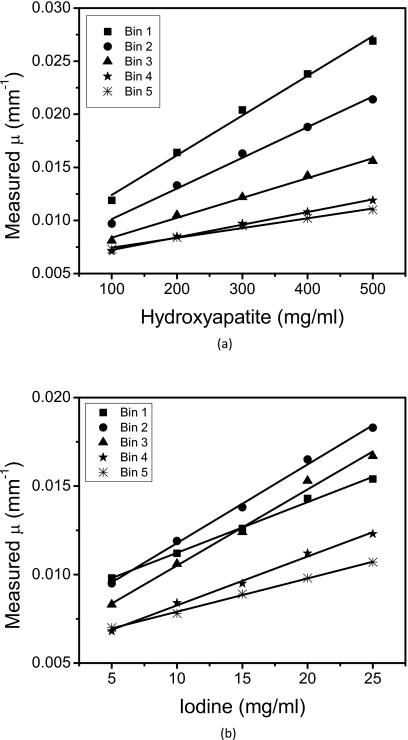
The general image quality produced by the CZT system was adequate for the material separation task. Ring artifacts were present toward the center of the reconstructed images. This effect was more prominent in some energy bins than others (Fig. 5): Energy bins 2, 3, and 4 had more ring artifacts than bins 1 and 5. Reconstructed images of the calibration phantoms (Fig. 4) showed that the hydroxyapatite and iodine regions had adequate contrast for analysis. Energy-resolved images of the PMMA three-material phantom (Fig. 5) revealed the expected dependence of the linear attenuation coefficient on photon energy. The gray level of PMMA and hydroxyapatite decreased as the photon energy increased, but the k-edge (33.2 keV) of iodine in the second energy bin increased the measured μ of iodine on the corresponding image. The plots (Fig. 6) of the measured μ versus known concentrations of contrast elements indicated strong correlations with average correlation coefficients of 0.992 and 0.994 for hydroxyapatite and iodine, respectively.
Figure 5.
CT slices of the polymethylmethacrylate three-material phantom for energy bins (a) 1, (b) 2, (c) 3, (d) 4, and (e) 5 (L∕W:0.01∕0.02 mm−1).
Figure 6.
Calibration curves for (a) HA and (b) iodine. The slope of the each line indicates the effective mass attenuation coefficients for the corresponding energy bin.
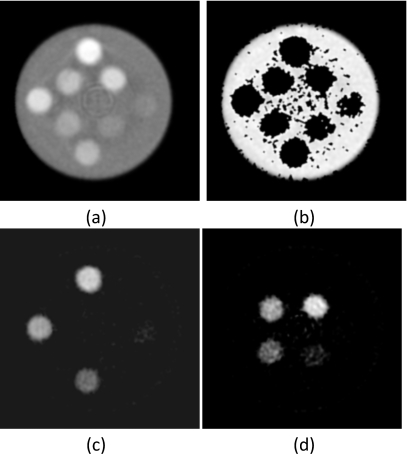
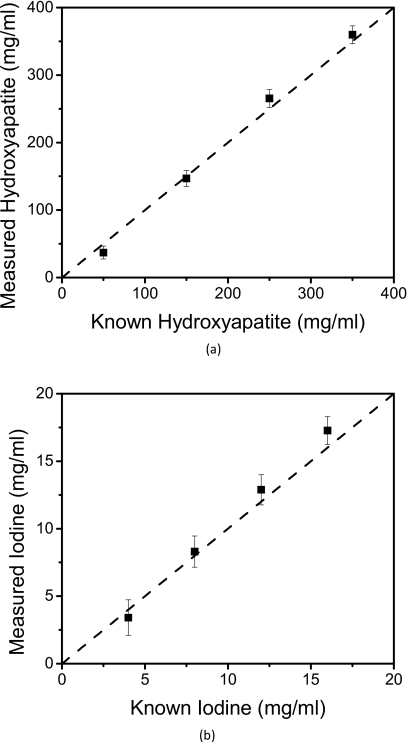
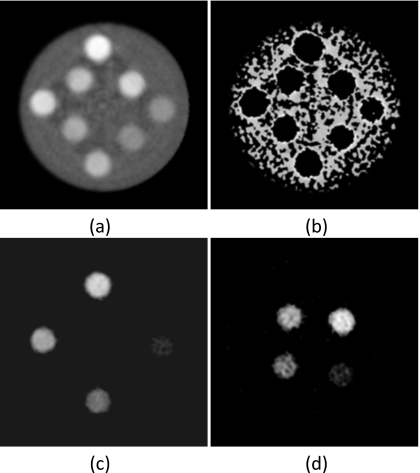
The material separation algorithm performed well on the PMMA three-material phantom (Fig. 7). The larger three concentrations of hydroxyapatite and iodine separated well. However, for the smallest concentration points (50 mg∕ml hydroxyapatite and 4 mg∕ml iodine), some voxels did not separate correctly. The PMMA-only image contained noisy areas where some voxels were incorrectly identified as hydroxyapatite or iodine. The relationship [Fig. 8a] between measured (HM) and known (HK) amounts for hydroxyapatite was HM=1.09HK−15(R2=0.997). Correspondingly, the relationship [Fig. 8b] between the measured (IM) and known (IK) amounts of iodine was IM=1.15IK−1(R2=0.999). The average errors for measured hydroxyapatite and iodine were 9.26% (Table 1) and 7.13% (Table 2), respectively.
Figure 7.
Material separation was applied to the polymethylmethacrylate three-material phantom. (a) Photon counting image (L∕W:0.01∕0.01 mm−1) and decomposed images of (b) PMMA (L∕W: 600∕1000 mg∕ml), (c) hydroxyapatite (L∕W: 200∕600 mg∕ml), and (d) iodine (L∕W: 10∕20 mg∕ml) are shown.
Figure 8.
Relationships between the measured and known concentrations of (a) hydroxyapatite and (b) iodine. The identity line is shown is dashed.
Table 1.
Quantification of the hydroxyapatite measured with the three-material phantoms. PMMA=polymethylmethacrylate, PE=polyethylene, and POM=polyoxymethylene.
| Known HA (mg∕ml) | Measured HA (mg∕ml) | Error (%) | ||||
|---|---|---|---|---|---|---|
| PMMA | PE | POM | PMMA | PE | POM | |
| 50 | 37 | 45 | 34 | 25.96 | 9.75 | 31.97 |
| 150 | 147 | 158 | 138 | 2.18 | 5.51 | 7.72 |
| 250 | 265 | 269 | 233 | 6.14 | 7.47 | 6.65 |
| 350 | 360 | 374 | 331 | 2.78 | 6.77 | 5.36 |
| Average error | 9.26 | 7.37 | 12.93 | |||
Table 2.
Quantification of the iodine measured with the three-material phantoms. PMMA=polymethylmethacrylate, PE=polyethylene, and POM=polyoxymethylene.
| Known iodine (mg∕ml) | Measured iodine (mg∕ml) | Error (%) | ||||
|---|---|---|---|---|---|---|
| PMMA | PE | POM | PMMA | PE | POM | |
| 4.00 | 3.62 | 3.75 | 4.33 | 9.45 | 6.22 | 8.19 |
| 8.00 | 8.30 | 8.58 | 8.67 | 3.79 | 7.21 | 8.31 |
| 12.00 | 12.88 | 12.46 | 12.92 | 7.37 | 3.87 | 7.66 |
| 16.00 | 17.27 | 16.80 | 17.40 | 7.93 | 5.02 | 8.76 |
| Average error | 7.13 | 5.58 | 8.23 | |||
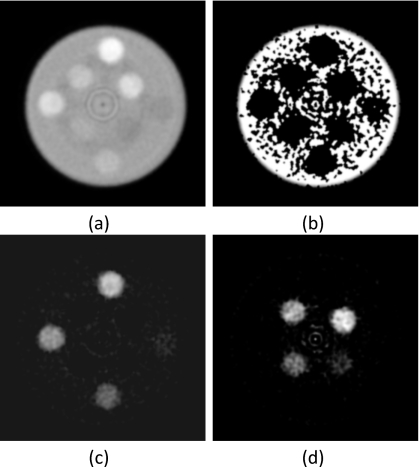
The method’s robustness in decomposing phantoms that have a different base material from the calibration phantom was tested with the polyethylene and polyoxymethylene phantoms using PMMA for calibration. Although the algorithm segmented the polyethylene three-material phantom well, it did not perform as well as the PMMA three-material phantom. There were more noisy regions with incorrect material identification in the polyethylene-only image [Fig. 9b]. However, quantification of hydroxyapatite and iodine was still accurate with average errors of 7.37% (Table 1) and 5.58% (Table 2), respectively. The same trend was observed for the three-material polyoxymethylene phantom. There was more noise on the polyoxymethylene-only image [Fig. 10b] and more ring artifacts that were incorrectly identified as hydroxyapatite or iodine [Figs. 10c, 10d]. The average errors for quantification of hydroxyapatite and iodine were 12.93% (Table 1) and 8.23% (Table 2), respectively.
Figure 9.
Material separation was performed on the polyethylene three-material phantom. (a) Photon counting image (L∕W:0.01∕0.01 mm−1) and decomposed images of (b) PMMA (L∕W: 600∕1000 mg∕ml), (c) hydroxyapatite (L∕W: 200∕600 mg∕ml), and (d) iodine (L∕W: 10∕20 mg∕ml) are shown. Base material was calibrated with PMMA.
Figure 10.
Material separation was performed on the polyoxymethylene three-material phantom. (a) Photon counting image (L∕W:0.01∕0.01 mm−1) and decomposed images of (b) PMMA (L∕W: 600∕1000 mg∕ml), (c) hydroxyapatite (L∕W: 200∕600 mg∕ml), and (d) iodine (L∕W: 10∕20 mg∕ml) are shown. Base material was calibrated with PMMA.
Material decomposition with the four-material phantom (Fig. 11) performed as well as the three-material phantom. Polyethylene and polymethylmethacrylate images contained some noisy decomposed voxels, but generally separated well. Hydroxyapatite and iodine quantification were also accurate with average errors of 15.62% and 2.76% (Table 3), respectively.
Figure 11.
Material separation was performed on the four-material phantom. (a) Photon counting image (L∕W:0.01∕0.01 mm−1) and decomposed images of (b) PE (L∕W: 600∕1000 mg∕ml), (c) PMMA (L∕W: 600∕1000 mg∕ml), (d) hydroxyapatite (L∕W: 200∕600 mg∕ml), (e) and iodine (L∕W: 10∕20 mg∕ml) are shown.
Table 3.
Quantification of the hydroxyapatite and iodine measured with the four-material phantom.
| Material | Known (mg∕ml) | Measured (mg∕ml | Error (%) |
|---|---|---|---|
| HA | 150 | 172 | 14.68 |
| HA | 350 | 408 | 16.55 |
| Iodine | 8.00 | 7.71 | 3.58 |
| Iodine | 16.00 | 15.72 | 1.75 |
DISCUSSION
A least-squares parameter estimation algorithm was used to decompose three and four materials using a computed tomography system with a CZT detector with five energy windows. Breast imaging tasks were chosen for this study. However, the technique can theoretically be applied toward any imaging task. Although the study was performed in phantoms, the materials chosen were similar to breast tissues in terms of the attenuation properties. For the task of material decomposition, an important factor to consider is the amount of separation between the attenuation properties. This separation needs to be realistic for the algorithm to be valid for clinical applications. In this aspect, the average difference between the linear attenuation coefficients of polymethylmethacrylate and polyethylene is 26%. This is comparable to the difference between glandular and adipose tissue, which is 29%. Overall, the results indicate that material segmentation and quantification were accurate. The method was found to be robust for both the three-material and four-material phantoms.
Although the phantom materials are similar to real tissues, there is still the question of whether a calibration can be applied clinically. In our studies, the calibration phantom consisted of polymethylmethacrylate as the base material while the measurement phantoms consisted of polymethylmethacrylate, polyethylene, or polyoxymethylene. The results show that calibrating with one base material, while measuring with another, did not greatly affect the segmentation and quantification. The decomposition worked adequately well on all three-material phantoms with the same PMMA phantom as the calibration. This finding is important because calibration phantoms contain materials that can only approximate tissues, not duplicate them. This is seen in Fig. 2, where the attenuation property of PMMA and polyethylene slightly differ from glandular and adipose tissues, respectively. Thus, it is possible to use a plastic calibration phantom in the decomposition of clinical images. Furthermore, a single calibration can be used for images from different patients despite the differences in exact composition of tissues between individuals.29
Quantification of hydroxyapatite (Table 2) and iodine (Table 3) showed that the average errors were greatest for phantoms of polyoxymethylene, followed by polymethylmethacrylate, and, lastly, polyethylene. This is consistent with the density differences of the three materials: Polyoxymethylene has the greatest density (1.41 g∕ml), followed by PMMA (1.19 g∕ml) and then polyethylene (0.93 g∕ml). Since cylindrical phantoms all have the same diameter, the denser ones attenuate more photons, leaving fewer photons to be detected. Images formed from fewer photons contained more noise, resulting in greater error in the concentration measurements. Despite the calibration phantom consisting of PMMA base material, the quantification of the three-material PMMA phantom had greater error than the polyethylene phantom. Thus, given that the objects had the same diameter, density has a greater impact on the quantification than the material mismatch to the calibration phantom. The quantification of iodine was found to be more accurate than hydroxyapatite. This is due to the k-edge of iodine that “defines” the material more uniquely in terms of its spectral property. Energy bins that contained a k-edge provided more material-specific information for the decomposition algorithm. Thus, materials with k-edges will more likely be decomposed accurately.
In contrast with previous methods,3, 4, 7, 8, 17 this technique produces material images that have a “binary” property, meaning that voxels without any component of a basis material are set to zero. This is the direct consequence of the assumption that each voxel consists of primarily one material. In the segmentation task, after a material is identified for each voxel, its value on other material basis images is assumed to be zero. The binary nature of the image allows for clear visualization of the regions-of-interest, since background noise is effectively eliminated. In addition, the algorithm gives local concentration information. Thus, in the diagnostic process, the clinician can display the basis material images side-by-side and obtain the concentration of a particular material by “moving the cursor” to a particular region. This potentially adds versatility to the diagnostic process.
One limitation of this study is the imperfections of the current CZT detector. As seen on the reconstructed and decomposed images, ring artifacts were present toward the center. These had negative effects on the decomposition. These artifacts arose from detector nonuniformity that could not be compensated by flat-field corrections. Other effects intrinsic to CZT detectors, aside from a deterioration in its detection accuracy, include charge sharing,30 hole tailing of the detected spectrum,31 k-fluorescent x-ray production,30 scatter cross-talk within the crystals, and pulse pile-up.32 These effects can only be lessened by using higher quality crystals and faster electronics. The performance of the algorithm is expected to improve as CZT detector technology advances. Specific to the current system, there were three dead spaces between the four CZT crystals. To compensate, three pixels were added to the corresponding positions. The values of those positions were obtained by linear interpolation. Thus, the detector produced 64 pixels of raw data, while the processed images were 67 pixels wide. Despite the various deteriorating effects, the detector produced images of adequate quality for the decompositions.
Another limitation of the system is that it is a small field-of-view (FOV) system that can image objects of approximately 3.2 cm in diameter. The effect of dose on the decomposition was not investigated due to the small object requirement and presence of image artifacts. The air kerma used in this study was 4.85 mGy, while the value used to scan an average breast of 14 cm diameter on flat-panel breast CT was 9.04 mGy.33 To investigate the algorithm at a clinical dose, a full FOV system is being developed with a detector that has improved electronic and material properties. Despite these limitations, the results showed the general concept of segmentation and quantification for more than two materials using energy discriminating detectors. Also, a simulation study (reported in a companion paper) showed that by using the correct mean glandular dose and breast size, the technique was able to accurately identify and quantify glandular tissue, adipose tissue, hydroxyapatite, and iodine. Future research will investigate the method on a full-size system with phantoms and postmortem breast specimens. Another issue to address is whether calibration at one diameter can be applied to breasts of different diameters. Simulations showed that the accuracy deteriorates as the diameter mismatch increases. This problem can be solved by using a “multipoint” calibration, where different diameters are calibrated and the calibration slopes are fitted with respect to breast size. It was found that a four-point calibration performed well in the decomposition. Thus, this technique can be applied in future clinical implementations of energy resolving systems by using a set of calibrations performed once for each system.
In conclusion, a proof-of-concept study was performed where three and four materials were decomposed accurately using detectors that provide five energy windows. The least-squares parameter estimation technique was applied successfully to breast imaging tasks. Current system properties allow investigation of only small phantoms. Improvement to the growing CZT technology will enable testing the technique in more realistic clinical situations.
ACKNOWLEDGMENTS
This research was supported in part by Grant No. R01 CA136871 awarded by the National Cancer Institute and a fellowship Award No. F31EB009630 from the National Institute of Biomedical Imaging and Bioengineering. The content is solely the responsibility of the authors and does not necessarily represent the official views of the National Cancer Institute, National Institute of Biomedical Imaging and Bioengineering, or the National Institutes of Health. The authors would like to thank David Rundle and Richard Smith from eV Microelectronics for their technical support, Michael Klopfer for his hardware expertise, and Justin Ducote for his discussions regarding material decomposition.
References
- Alvarez R. E. and Macovski A., “Energy-selective reconstructions in x-ray computerized tomography,” Phys. Med. Biol. 21, 733–744 (1976). 10.1088/0031-9155/21/5/002 [DOI] [PubMed] [Google Scholar]
- Liu X., Yu L., Primak A. N., and McCollough C. H., “Quantitative imaging of element composition and mass fraction using dual-energy CT: Three-material decomposition,” Med. Phys. 36, 1602–1609 (2009). 10.1118/1.3097632 [DOI] [PMC free article] [PubMed] [Google Scholar]
- Lehmann L. A., Alvarez R. E., Macovski A., Brody W. R., Pelc N. J., Riederer S. J., and Hall A. L., “Generalized image combinations in dual KVP digital radiography,” Med. Phys. 8, 659–667 (1981). 10.1118/1.595025 [DOI] [PubMed] [Google Scholar]
- Kalender W. A., Perman W. H., Vetter J. R., and Klotz E., “Evaluation of a prototype dual-energy computed tomographic apparatus. 1. Phantom studies,” Med. Phys. 13, 334–339 (1986). 10.1118/1.595958 [DOI] [PubMed] [Google Scholar]
- Heismann B. J., Leppert J., and Stierstorfer K., “Density and atomic number measurements with spectral x-ray attenuation method,” J. Appl. Phys. 94, 2073–2079 (2003). 10.1063/1.1586963 [DOI] [Google Scholar]
- Maaβ C., Baer M., and Kachelrieβ M., “Image-based dual energy CT using optimized precorrection functions: A practical new approach of material decomposition in image domain,” Med. Phys. 36, 3818–3829 (2009). 10.1118/1.3157235 [DOI] [PubMed] [Google Scholar]
- Schlomka J. P., Roessl E., Dorscheid R., Dill S., Martens G., Istel T., Baumer C., Herrmann C., Steadman R., Zeitler G., Livne A., and Proksa R., “Experimental feasibility of multi-energy photon-counting K-edge imaging in pre-clinical computed tomography,” Phys. Med. Biol. 53, 4031–4047 (2008). 10.1088/0031-9155/53/15/002 [DOI] [PubMed] [Google Scholar]
- Ducote J. L. and Molloi S., “Quantification of breast density with dual energy mammography: An experimental feasibility study,” Med. Phys. 37, 793–801 (2010). 10.1118/1.3284975 [DOI] [PMC free article] [PubMed] [Google Scholar]
- Bushberg J. T., Seibert J. A., E. M.Leidholdt, Jr., and Boone J. M., The Essential Physics of Medical Imaging, 2nd ed. (Lippincott Williams and Wilkins, Philadelphia, 2002), pp. 278–279. [Google Scholar]
- Wong C. K. and Huang H. K., “Calibration procedure in dual-energy scanning using the basis function technique,” Med. Phys. 10, 628–635 (1983). 10.1118/1.595367 [DOI] [PubMed] [Google Scholar]
- Xu T., Ducote J. L., Wong J. T., and Molloi S., “Feasibility of real time dual-energy imaging based on a flat panel detector for coronary artery calcium quantification,” Med. Phys. 33, 1612–1622 (2006). 10.1118/1.2198942 [DOI] [PubMed] [Google Scholar]
- Barnes G. T., Sones R. A., Tesic M. M., Morgan D. R., and Sanders J. N., “Detector for dual-energy digital radiography,” Radiology 156, 537–540 (1985). [DOI] [PubMed] [Google Scholar]
- Darambara D., “State-of-the-art radiation detectors for medical imaging: Demands and trends,” Nucl. Instrum. Methods Phys. Res. A 569, 153–158 (2006). 10.1016/j.nima.2006.08.054 [DOI] [Google Scholar]
- Shikhaliev P. M., “Energy-resolved computed tomography: First experimental results,” Phys. Med. Biol. 53, 5595–5613 (2008). 10.1088/0031-9155/53/20/002 [DOI] [PubMed] [Google Scholar]
- Le H. Q., Ducote J. L., and Molloi S., “Radiation dose reduction using a CdZnTe-based computed tomography system: Comparison to flat-panel detectors,” Med. Phys. 37, 1225–1236 (2010). 10.1118/1.3312435 [DOI] [PMC free article] [PubMed] [Google Scholar]
- Szeles C., Soldner S. A., Vydrin S., Graves J., and Bale D. S., “Ultra high flux 2-D CdZnTe monolithic detector arrays for x-ray imaging applications,” IEEE Trans. Nucl. Sci. 54, 1350–1358 (2007). 10.1109/TNS.2007.902362 [DOI] [Google Scholar]
- Roessl E. and Proksa R., “K-edge imaging in x-ray computed tomography using multi-bin photon counting detectors,” Phys. Med. Biol. 52, 4679–4696 (2007). 10.1088/0031-9155/52/15/020 [DOI] [PubMed] [Google Scholar]
- Lindfors K. K., Boone J. M., Nelson T. R., Yang K., Kwan A. L., and Miller D. F., “Dedicated breast CT: Initial clinical experience,” Radiology 246, 725–733 (2008). 10.1148/radiol.2463070410 [DOI] [PMC free article] [PubMed] [Google Scholar]
- Shikhaliev P. M., “Computed tomography with energy-resolved detection: A feasibility study,” Phys. Med. Biol. 53, 1475–1495 (2008). 10.1088/0031-9155/53/5/020 [DOI] [PubMed] [Google Scholar]
- van Noord P. A., Beijerinck D., Kemmeren J. M., and van der Graaf Y., “Mammograms may convey more than breast cancer risk: Breast arterial calcification and arterio-sclerotic related diseases in women of the DOM cohort,” Eur. J. Cancer Prev. 5, 483–487 (1996). [PubMed] [Google Scholar]
- Taskin F., Akdilli A., Karaman C., Unsal A., Koseoglu K., and Ergin F., “Mammographically detected breast arterial calcifications: Indicators for arteriosclerotic diseases?,” Eur. J. Radiol. 60, 250–255 (2006). 10.1016/j.ejrad.2006.06.006 [DOI] [PubMed] [Google Scholar]
- Miles K. A., “Tumour angiogenesis and its relation to contrast enhancement on computed tomography: A review,” Eur. J. Radiol. 30, 198–205 (1999). 10.1016/S0720-048X(99)00012-1 [DOI] [PubMed] [Google Scholar]
- Baldelli P., Bravin A., Di Maggio C., Gennaro G., Sarnelli A., Taibi A., and Gambaccini M., “Evaluation of the minimum iodine concentration for contrast-enhanced subtraction mammography,” Phys. Med. Biol. 51, 4233–4251 (2006). 10.1088/0031-9155/51/17/008 [DOI] [PubMed] [Google Scholar]
- Johns P. C. and Yaffe M. J., “Theoretical optimization of dual-energy x-ray imaging with application to mammography,” Med. Phys. 12, 289–296 (1985). 10.1118/1.595766 [DOI] [PubMed] [Google Scholar]
- Johns P. C., Drost D. J., Yaffe M. J., and Fenster A., “Dual-energy mammography: Initial experimental results,” Med. Phys. 12, 297–304 (1985). 10.1118/1.595767 [DOI] [PubMed] [Google Scholar]
- Levtoaff A. S., Feig S. A., Saitas V. L., Finkel G. C., and Schwartz G. F., “Stability of malignant breast microcalcifications,” Radiology 192, 153–156 (1994). [DOI] [PubMed] [Google Scholar]
- Lewin J. M., Isaacs P. K., Vance V., and Larke F. J., “Dual-energy contrast-enhanced digital subtraction mammography: Feasibility,” Radiology 229, 261–268 (2003). 10.1148/radiol.2291021276 [DOI] [PubMed] [Google Scholar]
- Nelson T. R., Cervino L. I., Boone J. M., and Lindfors K. K., “Classification of breast computed tomography data,” Med. Phys. 35, 1078–1086 (2008). 10.1118/1.2839439 [DOI] [PMC free article] [PubMed] [Google Scholar]
- Woodard H. Q. and White D. R., “The composition of body tissues,” Br. J. Radiol. 59, 1209–1218 (1986). 10.1259/0007-1285-59-708-1209 [DOI] [PubMed] [Google Scholar]
- Kalemci E. and Matteson J. L., “Investigation of charge sharing among electrode strips for a CdZnTe detector,” Nucl. Instrum. Methods Phys. Res. A 478, 527–537 (2002). 10.1016/S0168-9002(01)00892-0 [DOI] [Google Scholar]
- LeClair R. J., Wang Y. K., Zhao P. Y., Boileau M., Wang L. L., and Fleurot F., “An analytic model for the response of a CZT detector in diagnostic energy dispersive x-ray spectroscopy,” Med. Phys. 33, 1329–1337 (2006). 10.1118/1.2190331 [DOI] [PubMed] [Google Scholar]
- Knoll G. F., Radiation Detection and Measurement, 3rd ed. (Wiley, New York, 2000). [Google Scholar]
- Boone J. M., Kwan A. L. C., Seibert J. A., Shah N., Lindfors K. K., and Nelson T. R., “Technique factors and their relationship to radiation dose in pendant geometry breast CT,” Med. Phys. 32, 3767–3776 (2005). 10.1118/1.2128126 [DOI] [PubMed] [Google Scholar]


