Abstract
Purpose: Energy resolving detectors provide more than one spectral measurement in one image acquisition. The purpose of this study is to investigate, with simulation, the ability to decompose four materials using energy discriminating detectors and least squares minimization techniques.
Methods: Three least squares parameter estimation decomposition techniques were investigated for four-material breast imaging tasks in the image domain. The first technique treats the voxel as if it consisted of fractions of all the materials. The second method assumes that a voxel primarily contains one material and divides the decomposition process into segmentation and quantification tasks. The third is similar to the second method but a calibration was used. The simulated computed tomography (CT) system consisted of an 80 kVp spectrum and a CdZnTe (CZT) detector that could resolve the x-ray spectrum into five energy bins. A postmortem breast specimen was imaged with flat panel CT to provide a model for the digital phantoms. Hydroxyapatite (HA) (50, 150, 250, 350, 450, and 550 mg∕ml) and iodine (4, 12, 20, 28, 36, and 44 mg∕ml) contrast elements were embedded into the glandular region of the phantoms. Calibration phantoms consisted of a 30∕70 glandular-to-adipose tissue ratio with embedded HA (100, 200, 300, 400, and 500 mg∕ml) and iodine (5, 15, 25, 35, and 45 mg∕ml). The x-ray transport process was simulated where the Beer–Lambert law, Poisson process, and CZT absorption efficiency were applied. Qualitative and quantitative evaluations of the decomposition techniques were performed and compared. The effect of breast size was also investigated.
Results: The first technique decomposed iodine adequately but failed for other materials. The second method separated the materials but was unable to quantify the materials. With the addition of a calibration, the third technique provided good separation and quantification of hydroxyapatite, iodine, glandular, and adipose tissues. Quantification with this technique was accurate with errors of 9.83% and 6.61% for HA and iodine, respectively. Calibration at one point (one breast size) showed increased errors as the mismatch in breast diameters between calibration and measurement increased. A four-point calibration successfully decomposed breast diameter spanning the entire range from 8 to 20 cm. For a 14 cm breast, errors were reduced from 5.44% to 1.75% and from 6.17% to 3.27% with the multipoint calibration for HA and iodine, respectively.
Conclusions: The results of the simulation study showed that a CT system based on CZT detectors in conjunction with least squares minimization technique can be used to decompose four materials. The calibrated least squares parameter estimation decomposition technique performed the best, separating and accurately quantifying the concentrations of hydroxyapatite and iodine.
Keywords: material decomposition, photon counting detector, CT, breast imaging
INTRODUCTION
The ability to decompose and quantify specific materials on x-ray computed tomography (CT) has been studied since the 1970s.1 Algorithms for decomposition exploit the attenuation coefficients (μ)’s dependence on photon energy. Each combination of x-ray tube spectrum and detector response yields one effective attenuation coefficient for each material. In order to decompose two materials, a second x-ray measurement that produces a different effective attenuation coefficient is required. With two measurements, one can set up a system with two equations and two unknowns (the two materials) and solve them using either analytical or numerical methods.2 To decompose more than two materials, more measurements are needed. As a general rule, the number of measurements has to be equal to or greater than the number of materials. Previous decomposition methods focused primarily on two measurements and two materials.1, 2, 3, 4, 5, 6, 7 However, one recent study decomposed three materials with a dual-source CT system8 by assuming the conservation of mass for the third equation. Our study investigates four-material decomposition methods using energy resolving x-ray detectors that can simultaneously produce five detector responses in one data acquisition.
Traditionally, the techniques for obtaining two energy measurements are kVp switching, double-layered detectors, and dual-source CT. All these methods rely on the detected spectrum to be adequately separated. In dual energy switching, the tube voltage is switched very quickly (∼30 fps) between the “low” and “high” energy acquisition.9 The double-layered detector method acquires x-ray signals simultaneously with a front and a rear detector that are sandwiched together.10 In dual-source CT system, two x-ray tubes and two detectors are positioned orthogonal to each other for dual energy scanning.8 The major disadvantage of both the kVp switching and the dual-source methods is the misregistration between high and low energy data. The double-layered detector technique has poor separation between energy spectra. Recent advances in semiconductor technology and counting electronics make it feasible to use detectors that have photon counting and energy resolving capability.11 These detectors can resolve the x-ray spectrum into different energy bins. This provides different μ measurements of the same object that can then be used in decomposition algorithms. Photon counting detectors that have been investigated include Si strips,12 Xe gas avalanche,13 and microchannel plate.14 However, the most advanced of these are detectors composed of CdTe and CdZnTe (CZT) crystals.15, 16 The principal advantages of CZT detectors are direct conversion, photon counting, good energy resolution, and room temperature operation. By using these detectors and splitting the x-ray spectrum into n energy bins, n materials can theoretically be decomposed.
This study tests the proposed algorithm for decomposing materials on breast imaging. Breast imaging is suitable for application in the current photon counting detector technology due to its low dose requirement.17, 18, 19 Breast computed tomography with charge integrating flat panel detectors is currently in the clinical trial phase. It has been shown to have advantages over other breast imaging modalities.20 Some investigators have proposed using energy discriminating detectors for breast CT to improve image quality and reduce patient dose.17, 18, 21 An additional advantage of such a system is the ability to decompose relevant materials in the breast. A four-material decomposition technique is useful in the case of contrast-enhanced breast imaging. With one image acquisition, the relevant materials, such as calcifications, iodine contrast, glandular, and adipose tissues, can be identified and quantified. The properties of calcifications can determine malignancy22 and risk for heart disease.23 Regions of iodine contrast accumulation indicate increased angiogenesis of neoplasm.24 Glandular and adipose tissue quantification provide breast density, where an increase in density can serve as an indication of an increase in risk of developing breast cancer. Although temporal subtraction of contrast-enhanced images can accurately isolate the iodine signal,25 the acquisition of a precontrast image would impart a higher radiation dose to the patient. With energy discriminating CT, a precontrast image is not needed for material separation.
While breast imaging task was chosen as an example, the overall purpose of the study was to evaluate decomposition algorithms. In this study, three least squares parameter estimation algorithms were investigated. Simulations were performed on a realistic breast CT slice that was embedded with contrast objects. A CT system with a standard x-ray tube and energy resolving CZT detector was used. A phantom study evaluating the technique’s potential was performed and reported in a companion paper.
METHODS
A CZT computed tomography system that has five-energy-bin resolving capability is simulated. Briefly, the tube spectrum was 80 kVp and energy bins were 1–32, 33–39, 40–46, 47–56, and 57–80 keV. More details are provided below. First, the mathematics of the decomposition algorithms is formulated (Sec. 2A). Second, the x-ray transport process was described: Beginning with the tube spectrum (Sec. 2B), followed by the phantom description (Secs. 2C, 2D), and the image formation process (Sec. 2E).
Theoretical formalism
In energy resolved computed tomography, the measured linear attenuation coefficient can be described by the linear combination of the mass attenuation coefficients μM,i(B) weighted by the concentration of materials ,
| (1) |
where B refers to an energy bin of the energy resolved detector, is a vector that describes the spatial dependence of the attenuation, ρi denotes the concentration of material i, and K refers to the number of materials. Since B refers to a range of energy, is the average linear attenuation coefficient from the starting photon energy (Es) to the final energy (Ef) in that bin. Given multiple measurements of and the expected values of μM,i(B), the objective is then to determine the concentration of each constituent material. The energy-dependent mass attenuation coefficients can be calculated by
| (2) |
where Φ is the photon fluence and E is the photon energy in keV. If the detector can discriminate incident photons into J energy bins that is equal to the number of materials (J=K), then a unique solution for (vector of material concentrations) can be obtained by a numerical inversion of Eq. 1. While simulation was previously performed for J=K=3 for bone, water, and iodine, the accuracy of material quantification was not studied.26 In the case of J<K, the solution will not be unique since the number of equations is less than the number of unknowns. For J>K, no solutions exist because the system is overdetermined. However, a least squares minimization method can be used to estimate the parameter in Eq. 1. A similar approach used the maximum likelihood method to decompose materials containing k-edges in the diagnostic imaging range, such as gadolinium and iodine.27, 28 In those studies, projection data were decomposed and then material-specific images were reconstructed. In contrast, we investigated decomposition on reconstructed data and also included materials that lack prominent k-edges, such as glandular tissue, adipose tissue, and calcium in the form of hydroxyapatite (HA).
The least squares minimization to estimate material contributions to a voxel can be written as
| (3) |
Here, each voxel is assumed to consist of all the basis materials. Alternatively, a voxel can be treated as if it consisted primarily of one material since it represents a position in a three-dimensional object. Projection data cannot be treated this way because each pixel represents a line integral through the object, which potentially passes through more than one type of material. With this assumption, the least squares approach can be used to first determine the material and then compute its concentration. Thus, the decomposition method is separated into a segmentation task and a quantification task. For the segmentation task, the identity of the material can be determined by
| (4) |
After the material is identified (let i=I), the quantification task for material I can be computed by
| (5) |
In the above equations, the effective mass attenuation coefficients at each energy bin can be computed using a preattenuated x-ray beam (the beam that exits the x-ray tube before passing through the patient). However, the beam hardening phenomenon (described in Sec. 2F) changes the quality of the spectrum as it travels through the object. Equation 2 suggests that μM,i(B) also changes because it is dependent on the x-ray spectrum. To account for this effect, a calibrated mass attenuation coefficient (μC,i(B)) can be obtained by measuring the μL(B) of known material concentrations,
| (6) |
where d refers to each concentration point in the calibration and Q denotes the total number of concentrations. To accurately quantify hydroxyapatite and iodine, more than one concentration points were used in the calibration. A calibration phantom would contain different, but known, amounts of HA and iodine. In the case of glandular and adipose tissues, μL(B) can be obtained directly from the energy resolved CT data by taking the mean value within a region of interest in the corresponding tissue type. From our experience, these two tissues can be visually distinguished from each other without difficulty on breast CT. Thus, the calibrated least squares minimization method is slightly modified with the segmentation task as
| (7) |
and the quantification task as (let i=I)
| (8) |
Three related techniques for material decomposition are described. We termed them the basic least squares fitting (BLSF) [Eq. 3], the decoupled least squares fitting (DLSF) [Eqs. 4, 5], and the calibrated least squares fitting (CLSF) techniques [Eqs. 7, 8]. These decomposition methods were studied and compared using simulation of the x-ray transport and detection processes.
Tube spectrum
Models for generating x-ray spectra include those that are theoretical,29 semiempirical,30 and purely empirical.31 We chose the interpolating polynomial method of Boone and Seibert31 for its excellent agreement with the x-ray tube output in our laboratory. This model is a purely empirical model of a tungsten anode tube. An 80 kVp spectrum was used as this is the standard tube voltage for current flat panel breast CT protocol.20 Flux levels were adjusted to match the air kerma that imparts a mean glandular dose that is the same for a standard two view mammography protocol.32 Energy sampling of the spectrum is in steps of 1 keV and the average energy of the spectrum is 43 keV.
Measurement phantoms
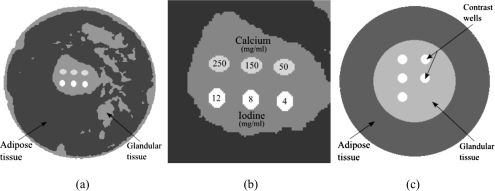
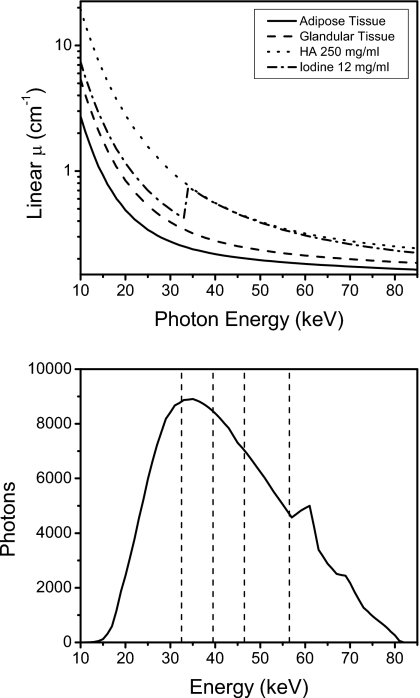
Although the decomposition techniques can generally be applied toward any imaging task, breast imaging was chosen because current energy resolving technology is more suited for low dose tasks.17 To generate a digital breast phantom, a postmortem specimen was scanned with cone-beam CT and then segmented into glandular and adipose tissues. The cone-beam CT system was constructed using a standard x-ray tube (Dynamax 78E), a rotation stage (Kollmorgen Goldline DDR D062M, Danaher Motion, Wood Dale, IL), and a flat panel detector (Paxscan 4030CB, Varian Medical, Inc., Palo Alto, CA). One slice from the reconstructed volumetric data was chosen and the tissues were segmented by a fuzzy C-means iterative technique.33 Embedded in the central region of glandular tissue were contrast elements consisting of HA and iodine [Figs. 1a, 1b]. The size of each contrast element is 25 mm2, which is in the range of sizes for calcifications of fibroadenoma and fat necrosis.34 Iodine is relevant for contrast-enhanced imaging to detect angiogenesis in tumors.24 Although the size of tumors and calcifications that indicate malignancy can be smaller than 25 mm2, the focus of this investigation is on the initial test of the theory and its performance given the chosen attenuation functions. Similar configuration of contrast elements in phantoms have been investigated for different imaging parameters and decomposition techniques.26, 28 The energy-dependent attenuation coefficients (Fig. 2) of soft tissues were obtained from a previous study that reported their cross sections as parametrized by aluminum and polymethyl methacrylate (PMMA) components.35 The cross sections of HA and iodine were obtained from the published data.36 For each keV step from 1 to 80, an attenuation map of the phantom was generated and fed through the photon transport simulation, as described in Sec. 2E.
Figure 1.
Diagrams of the digital breast phantom (a) and calibration phantom (c) are shown. The magnified image of the region that contains the contrast elements is also shown (b).
Figure 2.
Comparison of the mass attenuation coefficients of the various materials (top) and the 80 kVp spectrum with the division of the energy thresholds shown (bottom).
Three types of simulation were performed based on the configuration of the phantom. In the first, the diameter of the phantom was 14 cm. Inside the phantom, the top and bottom three rows of contrast wells contained hydroxyapatite (50, 150, and 250 mg∕ml) and iodine (4, 8, and 12 mg∕ml), respectively. In the second simulation, one well for HA and one well for iodine was allowed to have the concentrations varied across different iterations. The range for HA was 50–550 mg∕ml in 100 mg∕ml increments, and the range for iodine was 4–44 mg∕ml in 8 mg∕ml increments. These concentration values are consistent with those typically found in breast imaging.37 In the third, the concentration values were the same as the first simulation but the diameter of the phantom varied from 8 to 20 cm in 2 cm increments.
Calibration phantoms
To implement the calibrated method of decomposition (CLSF), a calibration phantom [Fig. 1c] was used. A similar method was performed by Johns and co-workers in the projection domain.38, 39 The phantom was a simplified version of the breast phantom. It consisted of a peripheral region of adipose tissue comprising 70% of the total area and a central region of glandular tissue comprising 30% of the total area. Embedded in the glandular tissues were five wells that contained contrast elements of either hydroxyapatite or iodine at various concentrations. The HA concentrations used for calibration ranged from 100 to 500 mg∕ml in 100 mg∕ml increments, and the iodine concentrations ranged from 5 to 45 mg∕ml in 10 mg∕ml increments.
Two types of calibration were used to investigate the method’s robustness in decomposing breasts of different sizes. In one type, a 14 cm diameter calibration was used to obtain the effective mass attenuation coefficients. This is a “single-point” calibration in which the computed slopes are used to decompose breasts of all diameters. In the other type, four calibration phantom sizes (8, 12, 16, and 20 cm) were simulated. Linear regressions of these values provided the calibration slopes for the decomposition. This is a “multipoint” calibration, as described in Eq. 6.
System geometry and x-ray transport
Single slice parallel beam geometry was used in the simulation. The x-ray transport process began with the generation of a beam spectrum according to the TASMIP model.31 For each energy and spatial dependent attenuation map of the phantom , a sinogram (G(θ,u,E)) was obtained by computing the Radon transform (R),
| (9) |
where θ is the angle of gantry rotation and u is the position of each detector element. Then, the x-ray beam was passed through the object and detector according to the Beer–Lambert law to obtain the detected spectrum (N(θ,u,E)),
| (10) |
where N(θ,u,E) is the number of photons, D(E) is the absorption efficiency of the detector, and S(E) is the primary x-ray tube spectrum. Quantum fluctuation was simulated by adding Poisson noise to N(θ,s,E),
| (11) |
where poissrnd(λ) generates a random number from the Poisson distribution with a mean of λ. In our simulation, the gantry made one full rotation around the object from which 360 frames were acquired (θ was from 1 to 360 in 1° increments). The detector array was composed of 3-mm-thick CZT crystals of 0.5×0.5 mm2 pixels. The length of the array was 429 elements—u was from 1 to 429. Current CZT detector technology allows for five to eight user-selectable energy bins.16, 18, 21, 28 Here, our simulated detector could resolve the spectrum into five energy bins. The sinogram for each energy bin is calculated by
| (12) |
The ranges of the five energy bins were 1–32, 33–39, 40–46, 47–56, and 57–80 keV. These were chosen to provide approximately the same number of photons in each bin given the 80 kVp spectrum. The linear attenuation coefficient images were reconstructed using the standard filtered backprojection algorithm (FBP),
| (13) |
The FBP algorithm used ramp filter and linear interpolation.40 The reconstructed linear attenuation images were processed as described in Sec. 2A for material decomposition.
Beam hardening correction
As a polyenergetic x-ray beam passes through the object, low energy photons are preferentially absorbed in comparison to high energy photons. Since the attenuation coefficients are generally lower at higher energy, they are measured to be lower as the beam hardens. As a result, the CT number depresses toward the center and produces a phenomenon called “cupping artifact.” This nonideal effect was corrected by estimating the “cupping” as a function of position in the object by prescanning a uniform object of similar material. In our study, we used PMMA cylinders of different diameters (8, 10, 12, 14, 16, 18, and 20 cm) for this purpose. The cylinder was reconstructed and the correction function was obtained for each energy bin. The correction function ((h(r,B))) was computed by averaging the measured μL(B) in the circle defined by a radial distance (r) from the center and normalizing it to the value at the periphery,
| (14) |
where θ is the angle in the polar coordinate system with the center of the image set at the origin and rmax is the distance from center to the edge of the calibration phantom. The corrected image (μL,C(r,B)) is computed by
| (15) |
This correction method is an image-based technique.
Data analysis and comparison
The three methods of material decompositions (BLSF, DLSF, and CLSF) were evaluated by comparing the results to both the ground truth and one another. The segmentation task of the DLSF and CLSF techniques was evaluated by computing a metric (O) that compares the segmented region to the ground truth from the original phantom: If T is the image of a particular segmented tissue and G is the ground truth image, then O can be computed as
| (16) |
This gives the segmentation metric O a range from 0 to 1, with 1 being a perfect segmentation. The quantification task was evaluated by plotting the measured concentrations versus the known values. The average errors were calculated by
| (17) |
where P is the total number of points measured, mi is the ith measured value, and yi is the ith known value.
RESULTS
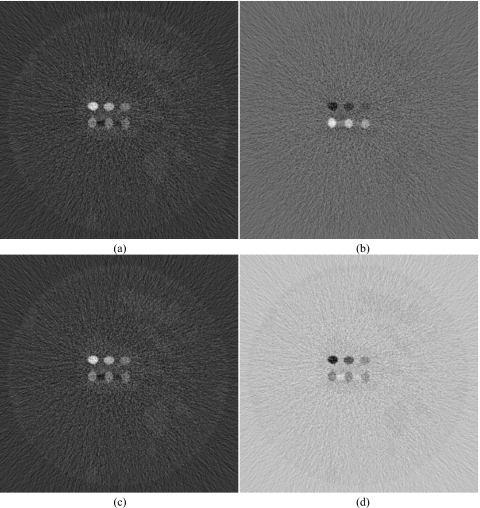
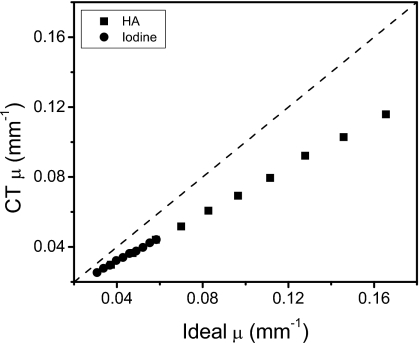
The decomposed images for the basic least squares fitting method are shown in Fig. 3. Although iodine decomposition performed the best out of the four materials, the hydroxyapatite image still contained remnants of glandular tissue and iodine. Glandular and adipose tissues also did not decompose well. Images for the decoupled least squares fitting approach are shown in Fig. 4. This method generally performed better than the BLSF method, but only the highest concentration of HA (250 mg∕ml) separated correctly. All iodine concentrations decomposed well. Glandular and adipose tissue separations were adequate. However, there were still regions of misidentification for both tissues. The quantification of contrast objects could not be made using these two techniques due to the mismatch between the theoretical μ calculated from the spectral model and the μ obtained from the simulated images. This difference is shown in Fig. 5, where the plot of ideal versus simulated CT μ for energy bin 1 deviates from the identity line.
Figure 3.
Decomposed images of hydroxyapatite (L∕W: 200∕600 mg∕ml) (a), iodine (L∕W: 10∕20 mg∕ml) (b), adipose (L∕W: 600∕1000 mg∕ml) (c), and glandular (L∕W: 600∕1000 mg∕ml) (d) tissue using the basic least squares fitting method.
Figure 4.
Decomposed images of hydroxyapatite (L∕W: 200∕600 mg∕ml) (a), iodine (L∕W: 10∕20 mg∕ml) (b), adipose (L∕W: 600∕1000 mg∕ml) (c), and glandular (L∕W: 600∕1000 mg∕ml) (d) tissue using the decoupled least squares fitting method.
Figure 5.
Comparison of the ideal and the simulated CT linear attenuation coefficients for the first energy bin of the spectrum used.
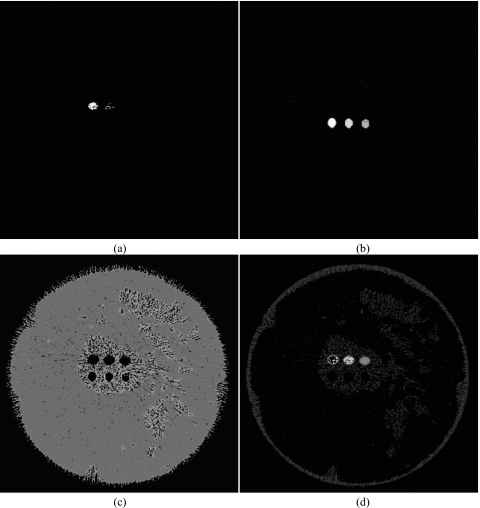
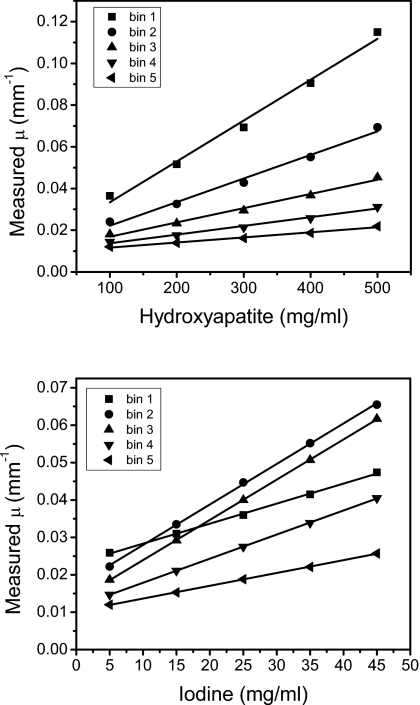
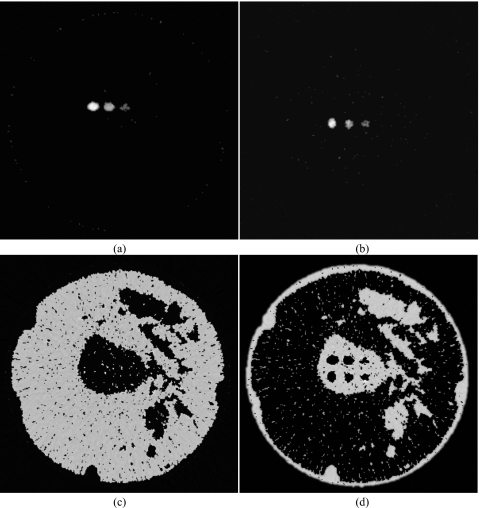
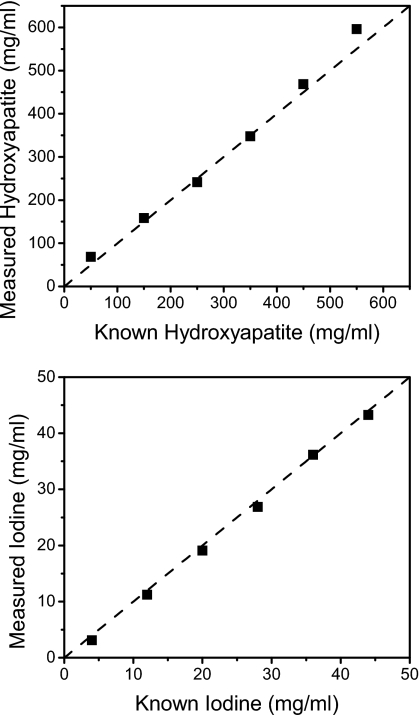
To produce more accurate quantitative results, the calibrated least squares fitting method was used. The calibration curves are shown in Fig. 6. For each energy bin, the CT μ measurements were plotted against concentrations of hydroxyapatite and iodine. The slopes and intercepts of these linear regressions were used to decompose the corresponding materials. As seen on the graphs, the linear regressions provided good fits for the data. The decomposition from the CLSF technique is shown in Fig. 7, where HA and iodine were identified accurately. Some voxels in the periphery of the contrast wells were misidentified as glandular tissue at the lowest concentrations of HA (50 mg∕ml) and iodine (4 mg∕ml). Glandular and adipose tissues separated well, but some voxels were misidentified due to noise fluctuations. Quantitatively, the segmentation metric for the DLSF method was lower than the CLSF method for all materials. For the DLSF technique, the values for O were 0.36, 0.41, 0.61, and 0.83 for material-specific images of HA, iodine, glandular, and adipose tissues, respectively. The corresponding values for the CLSF method were 0.57, 0.50, 0.73, and 0.90, respectively. Measured hydroxyapatite (Fig. 8, top) and iodine (Fig. 8, bottom) from the CLSF technique are plotted against their known values. These measurements were accurate for both contrast elements with average errors of 9.83% for HA (Table 1) and 6.61% for iodine (Table 2).
Figure 6.
Calibration curves for hydroxyapatite (top) and iodine (bottom).
Figure 7.
Decomposed images of hydroxyapatite (L∕W: 200∕600 mg∕ml) (a), iodine (L∕W: 10∕20 mg∕ml) (b), adipose (L∕W: 600∕1000 mg∕ml) (c), and glandular (L∕W: 600∕1000 mg∕ml) (d) tissue using the calibrated least squares fitting method. The breast size is 14 cm.
Figure 8.
Measured hydroxyapatite (top) and iodine (bottom) concentrations using the CLSF method.
Table 1.
Quantification of hydroxyapatite.
| Known HA (mg∕ml) | Measured HA (mg∕ml) | Error (%) |
|---|---|---|
| 50 | 68 | 36.89 |
| 150 | 158 | 5.54 |
| 250 | 241 | 3.51 |
| 350 | 348 | 0.56 |
| 450 | 469 | 4.12 |
| 550 | 596 | 8.36 |
| Average error | 9.83 | |
Table 2.
Quantification of iodine.
| Known iodine (mg∕ml) | Measured iodine (mg∕ml) | Error (%) |
|---|---|---|
| 4 | 3.10 | 22.43 |
| 12 | 11.23 | 6.43 |
| 20 | 19.09 | 4.55 |
| 28 | 26.86 | 4.06 |
| 36 | 36.17 | 0.46 |
| 44 | 43.24 | 1.72 |
| Average error | 6.61 | |
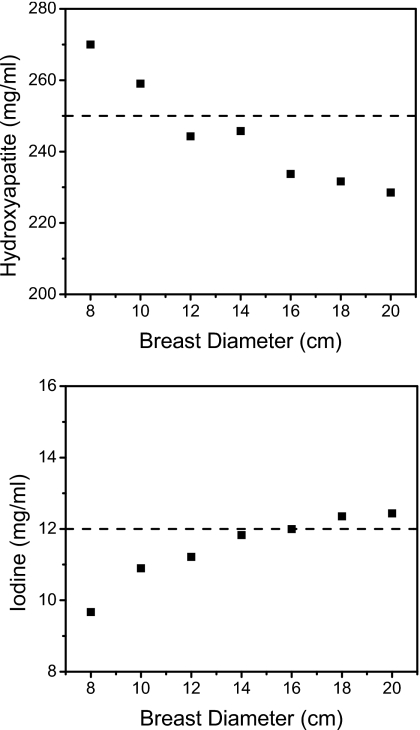
The effect of breast size on quantitative measurements is shown in Fig. 9. In these plots, the HA and iodine concentrations were 250 and 12 mg∕ml, respectively. Calibration was obtained from one phantom of 14 cm in diameter. This one-point calibration was used to decompose breast sizes of 8, 10, 12, 14, 16, 18, and 20 cm in diameter. As seen from the graphs, measurements were more accurate in the vicinity of 14 cm. Decompositions of breast with diameters other than 14 cm were not as good; more voxels were misidentified. Material identification performed well, but quantification did not (Fig. 9).
Figure 9.
Measured hydroxyapatite (top) and iodine (bottom) concentrations (250 and 12 mg∕ml, respectively) at different breast diameters. The calibration was made on a calibration phantom of 14 cm diameter.
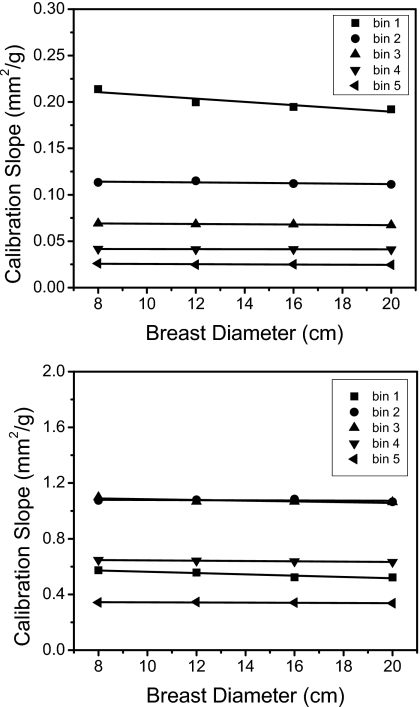
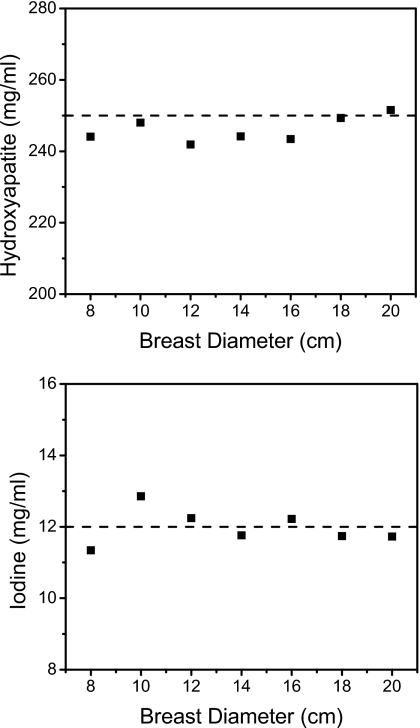
The calibration can also take into account different breast sizes by plotting the coefficients versus breast diameters (Fig. 10). The linear regressions of these values showed strong correlations for both HA and iodine. With these fits, measurements of HA (250 mg∕ml) and iodine (12 mg∕ml) were found to be more accurate than the single-point calibration method (Fig. 11). The quantification errors (Table 3) were 5.44% and 6.17% with the single-point method, whereas the errors were 1.75% and 3.27% when using the multipoint method for HA and iodine, respectively.
Figure 10.
Calibration slopes (effective mass attenuation coefficients) of hydroxyapatite (top) and iodine (bottom) as a function of the breast diameter.
Figure 11.
Measured hydroxyapatite (top) and iodine (bottom) concentrations (250 and 12 mg∕ml, respectively) at different breast diameters. The calibration slopes were calibrated with four-point calibrations at 8, 12, 16, and 20 cm diameters.
Table 3.
Quantification of hydroxyapatite and iodine where the calibration was either obtained from the 14 cm calibration phantom or from a linear fit through four calibration phantoms. The known concentrations of HA and iodine were 250 and 12 mg∕ml, respectively.
| Diameter (cm) | Calibration from 14 cm diameter | Calibration from linear fits | ||||||
|---|---|---|---|---|---|---|---|---|
| HA (mg∕ml) | Error (%) | Iodine (mg∕ml | Error (%) | HA (mg∕ml) | Error (%) | Iodine (mg∕ml | Error (%) | |
| 8 | 270 | 8.00 | 9.67 | 19.43 | 244 | 2.37 | 11.34 | 5.48 |
| 10 | 259 | 3.61 | 10.90 | 9.18 | 248 | 0.79 | 12.85 | 7.10 |
| 12 | 244 | 2.30 | 11.22 | 6.52 | 242 | 3.24 | 12.24 | 2.01 |
| 14 | 246 | 1.71 | 11.83 | 1.43 | 244 | 2.33 | 11.76 | 1.98 |
| 16 | 234 | 6.50 | 11.99 | 0.05 | 243 | 2.62 | 12.22 | 1.85 |
| 18 | 232 | 7.34 | 12.35 | 2.92 | 249 | 0.27 | 11.74 | 2.18 |
| 20 | 229 | 8.58 | 12.44 | 3.63 | 252 | 0.62 | 11.73 | 2.29 |
| Average error | 5.44 | 6.17 | 1.75 | 3.27 | ||||
DISCUSSION
Three related methods to decompose materials on computed tomography were studied using simulations. The techniques rely on a detector that can separate the incident spectrum into multiple energy bins. The basic assumption of the previously reported methods is similar to the basic least squares fitting method—namely, that each image element contains contributions from all basis materials. The decoupled least squares fitting and calibrated least squares fitting methods deviate from this assumption by treating each voxel as if it consisted of primarily one material. Treating an image element in this way is not possible in the projection domain. A pixel in the projection space represents a line integral through the object (μt) that most likely receives contribution from more than one material. In the reconstructed image space, each voxel is not a line integral but a position in three-dimensional space. The methods were also made possible by taking more than two simultaneous attenuation measurements of an object. With only two measurements, as in the dual energy methods, the least squares fitting methods does not have enough data for parameter estimation. The identification of materials and quantification of their concentrations were found to be accurate using five measurements.
The BLSF technique did not perform well due to the demand of fitting the attenuation coefficients to four materials simultaneously. This is a consequence of treating a voxel as if it consisted of all constituent materials. The ability to decompose depends on the differences between the materials’ attenuation properties. A greater difference translates to a better decomposition. Iodine separation performed the best due to its k-edge at 33.2 keV, which provides uniqueness to its attenuation function (Fig. 2). The other three materials (hydroxyapatite, glandular, and adipose tissues) have very similar attenuation functions, which were revealed in the poor decomposition results. The demand on the fitting algorithm is lessened when a voxel is treated as if it consisted of mainly one material. The method is reduced to fitting the attenuation coefficients to only one material. The DLSF, which considers a voxel in this way, performed well in the identification task (Fig. 4). However, a calibration was required to obtain accurate quantification results.
Overall, the calibrated least squares fitting method performed well in both identifying the materials and quantifying their concentrations. The errors between the measured and known concentrations of hydroxyapatite and iodine for the ranges studied were 9.83% and 6.61 %, respectively. These results compare well to a recent publication that investigated the decomposition of three materials using dual-source CT.8 In that report, the average errors in the measurement of calcium and iron were 13.2% and 7.8%, respectively. Using two spectral measurements, three-material decompositions were made possible by assuming mass conservation. Their method also applied a material basis method for reconstructing image domain. The advantages of our method are twofold: (1) It requires only one source spectrum and (2) can be applied to more than three materials. Both techniques are based on a calibration, so the accuracy of the calibration is important. When the calibration was calculated for the same breast size as that used for the measurement phantom, the quantification was accurate. However, as Fig. 9 indicates, errors increased as the diameter mismatch between calibration and measurements increased. This effect is due to imperfections in the beam hardening correction, where μ’s were slightly different between calibration and measurements. Despite this effect, the algorithm was still robust enough to identify materials, but not quantify them. The calibration-measurement mismatch can be accounted for by calibrating at more than one breast size in a multipoint approach. Figure 11 indicates that a multipoint calibration can be performed once for each system and subsequent image acquisitions can simply use the calibrated fits to obtain the necessary coefficients for decomposition (Fig. 10).
The materials that were chosen in this study are relevant to breast imaging. Hydroxyapatite is the primary component of breast microcalcifications, and iodine is present in contrast-enhanced breast imaging. Breast computed tomography using a flat panel detector was found to perform better than mammography in detecting masses.20 Multislit breast CT using the CZT as the detector has also been proposed. It was found that the contrast-to-noise ratio was increased by 1.35 times, while the dose can be reduced by 52.05%, when compared to flat panel systems.21 The ability to identify and quantify specific materials adds another dimension to the imaging system. In a single CT scan using the CZT system, one obtains both the standard CT data and the additional information about the amount of material present in a particular image region. This information can potentially be invaluable in the diagnostic process.
The simulated detector in this study has ideal properties. However, a realistic detector would contain many imperfections that deteriorate decomposition results. To obtain five spectral responses, the detector electronics must possess five comparators to analyze the incoming voltage. The accuracy of the energy reading depends on the mapping from voltage to photon energy. Imperfections in this process lead to energy windows that do not correspond to the actual energy widow. One of the contributions to spectrum distortions is the charge sharing effect.41 As charge carriers propagate through the CZT crystal, the charge cloud diffuses, causing adjacent pixels to share the electric field. Another deteriorating factor is the hole tailing phenomenon.42 As electrons and holes are created in the crystal, they drift in the opposite direction toward the corresponding electrodes. The ability of these charge carriers to move depends on their mobility lifetime product and the material properties of the CZT crystal. In general, holes have poorer transport properties than electrons, causing them to be trapped in the crystal lattice. The lost charges trapped in holes are not collected, producing a lower energy reading than in actuality—causing a “tailing” of the spectrum. The spectrum can further be distorted by florescent photons that are generated during the de-excitation of an atom following a photoelectric event.42 The florescent photons can also propagate through the crystal and interact with other atoms of the detector. These processes can be simulated and they are the subject of ongoing investigations.
An experimental phantom study is required to verify the calibrated least squares fitting technique. The major difference between experiment and simulation is the imperfections in the detector system—either with the electronics or with the CZT detector as described above. However, with the calibrated implementation of the least square fitting technique, most of the artifacts that result from these imperfections are taken into account. The distorted energy spectrum would affect both the images of the calibration and the measurement phantoms. The measured μ values would be consistent if the same x-ray technique and geometry are used. The results of phantom experiments have also been reported. The experimental results showed that materials were identified and quantified accurately with the calibrated technique.
In conclusion, the results of this simulation study showed that a CT system based on CZT detectors in conjunction with least squares minimization technique can be used to decompose four materials. The calibrated least squares parameter estimation decomposition technique performed the best, separating and accurately quantifying the concentrations of hydroxyapatite and iodine.
ACKNOWLEDGMENTS
This research was supported, in part, by Grant No. R01 CA136871 awarded by the National Cancer Institute and a Fellowship Award No. F31EB009630 from the National Institute of Biomedical Imaging and Bioengineering. The content is solely the responsibility of the authors and does not necessarily represent the official views of the National Cancer Institute, National Institute of Biomedical Imaging and Bioengineering, or the National Institutes of Health.
References
- Alvarez R. E. and Macovski A., “Energy-selective reconstructions in x-ray computerized tomography,” Phys. Med. Biol. 21, 733–744 (1976). 10.1088/0031-9155/21/5/002 [DOI] [PubMed] [Google Scholar]
- Heismann B. J., Leppert J., and Stierstorfer K., “Density and atomic number measurements with spectral x-ray attenuation method,” J. Appl. Phys. 94, 2073–2079 (2003). 10.1063/1.1586963 [DOI] [Google Scholar]
- Brody W. R., Cassel D. M., Sommer F. G., Lehmann L. A., Macovski A., Alvarez R. E., Pelc N. J., Riederer S. J., and Hall A. L., “Dual-energy projection radiography: Initial clinical experience,” AJR, Am. J. Roentgenol. 137, 201–205 (1981). [DOI] [PubMed] [Google Scholar]
- Lehmann L. A., Alvarez R. E., Macovski A., Brody W. R., Pelc N. J., Riederer S. J., and Hall A. L., “Generalized image combinations in dual KVP digital radiography,” Med. Phys. 8, 659–667 (1981). 10.1118/1.595025 [DOI] [PubMed] [Google Scholar]
- Kalender W. A., Perman W. H., Vetter J. R., and Klotz E., “Evaluation of a prototype dual-energy computed tomographic apparatus. 1. Phantom studies,” Med. Phys. 13, 334–339 (1986). 10.1118/1.595958 [DOI] [PubMed] [Google Scholar]
- Maaß C., Baer M., and Kachelrieß M., “Image-based dual energy CT using optimized precorrection functions: A practical new approach of material decomposition in image domain,” Med. Phys. 36, 3818–3829 (2009). 10.1118/1.3157235 [DOI] [PubMed] [Google Scholar]
- Ducote J. L. and Molloi S., “Quantification of breast density with dual energy mammography: An experimental feasibility study,” Med. Phys. 37, 793–801 (2010). 10.1118/1.3284975 [DOI] [PMC free article] [PubMed] [Google Scholar]
- Liu X., Yu L., Primak A. N., and McCollough C. H., “Quantitative imaging of element composition and mass fraction using dual-energy CT: Three-material decomposition,” Med. Phys. 36, 1602–1609 (2009). 10.1118/1.3097632 [DOI] [PMC free article] [PubMed] [Google Scholar]
- Xu T., Ducote J. L., Wong J. T., and Molloi S., “Feasibility of real time dual-energy imaging based on a flat panel detector for coronary artery calcium quantification,” Med. Phys. 33, 1612–1622 (2006). 10.1118/1.2198942 [DOI] [PubMed] [Google Scholar]
- Barnes G. T., Sones R. A., Tesic M. M., Morgan D. R., and Sanders J. N., “Detector for dual-energy digital radiography,” Radiology 156, 537–540 (1985). [DOI] [PubMed] [Google Scholar]
- Darambara D., “State-of-the-art radiation detectors for medical imaging: Demands and trends,” Nucl. Instrum. Methods Phys. Res. A 569, 153–158 (2006). 10.1016/j.nima.2006.08.054 [DOI] [Google Scholar]
- Beuville E., Cahn R., Cederstrom B., Danielsson M., Hall A., Hasegawa B., Luo L., Lundqvist M., Nygren D., Oltman E., and Walton J., “High resolution x-ray imaging using a silicon strip detector,” IEEE Trans. Nucl. Sci. 45, 3059–3063 (1998). 10.1109/23.737664 [DOI] [Google Scholar]
- Breskin A., “Advances in gas avalanche radiation detectors for biomedical applications,” Nucl. Instrum. Methods Phys. Res. A 454, 26–39 (2000). 10.1016/S0168-9002(00)00804-4 [DOI] [Google Scholar]
- Shikhaliev P. M., Xu T., Le H., and Molloi S., “Scanning-slit photon counting x-ray imaging system using a microchannel plate detector,” Med. Phys. 31, 1061–1071 (2004). 10.1118/1.1695651 [DOI] [PubMed] [Google Scholar]
- Prokesch M. and Szeles C., “Accurate measurement of electrical bulk resistivity and surface leakage of CdZnTe radiation detector crystals,” J. Appl. Phys. 100, 014503 (2006). 10.1063/1.2209192 [DOI] [Google Scholar]
- Szeles C., Soldner S. A., Vydrin S., Graves J., and Bale D. S., “Ultra high flux 2-D CdZnTe monolithic detector arrays for x-ray imaging applications,” IEEE Trans. Nucl. Sci. 54, 1350–1358 (2007). 10.1109/TNS.2007.902362 [DOI] [Google Scholar]
- Shikhaliev P. M., “Computed tomography with energy-resolved detection: A feasibility study,” Phys. Med. Biol. 53, 1475–1495 (2008). 10.1088/0031-9155/53/5/020 [DOI] [PubMed] [Google Scholar]
- Shikhaliev P. M., “Energy-resolved computed tomography: First experimental results,” Phys. Med. Biol. 53, 5595–5613 (2008). 10.1088/0031-9155/53/20/002 [DOI] [PubMed] [Google Scholar]
- Boone J. M., Nelson T. R., Lindfors K. K., and Seibert J. A., “Dedicated breast CT: Radiation dose and image quality evaluation,” Radiology 221, 657–667 (2001). 10.1148/radiol.2213010334 [DOI] [PubMed] [Google Scholar]
- Lindfors K. K., Boone J. M., Nelson T. R., Yang K., Kwan A. L., and Miller D. F., “Dedicated breast CT: Initial clinical experience,” Radiology 246, 725–733 (2008). 10.1148/radiol.2463070410 [DOI] [PMC free article] [PubMed] [Google Scholar]
- Le H. Q., Ducote J. L., and Molloi S., “Radiation dose reduction using a CdZnTe-based computed tomography system: Comparison to flat-panel detectors,” Med. Phys. 37, 1225–1236 (2010). 10.1118/1.3312435 [DOI] [PMC free article] [PubMed] [Google Scholar]
- van Noord P. A., Beijerinck D., Kemmeren J. M., and van der Graaf Y., “Mammograms may convey more than breast cancer risk: Breast arterial calcification and arterio-sclerotic related diseases in women of the DOM cohort,” Eur. J. Cancer Prev. 5, 483–487 (1996). [PubMed] [Google Scholar]
- Taskin F., Akdilli A., Karaman C., Unsal A., Koseoglu K., and Ergin F., “Mammographically detected breast arterial calcifications: Indicators for arteriosclerotic diseases?,” Eur. J. Radiol. 60, 250–255 (2006). 10.1016/j.ejrad.2006.06.006 [DOI] [PubMed] [Google Scholar]
- Miles K. A., “Tumour angiogenesis and its relation to contrast enhancement on computed tomography: A review,” Eur. J. Radiol. 30, 198–205 (1999). 10.1016/S0720-048X(99)00012-1 [DOI] [PubMed] [Google Scholar]
- Baldelli P., Bravin A., Di Maggio C., Gennaro G., Sarnelli A., Taibi A., and Gambaccini M., “Evaluation of the minimum iodine concentration for contrast-enhanced subtraction mammography,” Phys. Med. Biol. 51, 4233–4251 (2006). 10.1088/0031-9155/51/17/008 [DOI] [PubMed] [Google Scholar]
- Taguchi Z. M. et al. , “Image-domain material decomposition using photon-counting CT,” Proc. SPIE 6510, 1–12 (2007). [Google Scholar]
- Roessl E. and Proksa R., “K-edge imaging in x-ray computed tomography using multi-bin photon counting detectors,” Phys. Med. Biol. 52, 4679–4696 (2007). 10.1088/0031-9155/52/15/020 [DOI] [PubMed] [Google Scholar]
- Schlomka J. P., Roessl E., Dorscheid R., Dill S., Martens G., Istel T., Baumer C., Herrmann C., Steadman R., Zeitler G., Livne A., and Proksa R., “Experimental feasibility of multi-energy photon-counting K-edge imaging in pre-clinical computed tomography,” Phys. Med. Biol. 53, 4031–4047 (2008). 10.1088/0031-9155/53/15/002 [DOI] [PubMed] [Google Scholar]
- Kramers H. A., “On the theory of x-ray absorption and of the continuous x-ray spectrum,” Philos. Mag. 46, 836–871 (1923). [Google Scholar]
- Tucker D. M., Barnes G. T., and Wu X. Z., “Molybdenum target x-ray-spectra—A semiempirical model,” Med. Phys. 18, 402–407 (1991). 10.1118/1.596686 [DOI] [PubMed] [Google Scholar]
- Boone J. M. and Seibert J. A., “An accurate method for computer-generating tungsten anode x-ray spectra from 30 to 140 kV,” Med. Phys. 24, 1661–1670 (1997). 10.1118/1.597953 [DOI] [PubMed] [Google Scholar]
- Boone J. M., Kwan A. L. C., Seibert J. A., Shah N., Lindfors K. K., and Nelson T. R., “Technique factors and their relationship to radiation dose in pendant geometry breast CT,” Med. Phys. 32, 3767–3776 (2005). 10.1118/1.2128126 [DOI] [PubMed] [Google Scholar]
- Chen W. J., Giger M. L., and Bick U., “A fuzzy C-means (FCM)-based approach for computerized segmentation of breast lesions in dynamic contrast-enhanced MR images,” Acad. Radiol. 13, 63–72 (2006). 10.1016/j.acra.2005.08.035 [DOI] [PubMed] [Google Scholar]
- Tse G. M., Tan P. H., Pang A. L. M., Tang A. P. Y., and Cheung H. S., “Calcification in breast lesions: Pathologists’ perspective,” J. Clin. Pathol. 61, 145–151 (2007). 10.1136/jcp.2006.046201 [DOI] [PubMed] [Google Scholar]
- Johns P. C. and Yaffe M. J., “X-ray characterization of normal and neoplastic breast tissues,” Phys. Med. Biol. 32, 675–695 (1987). 10.1088/0031-9155/32/6/002 [DOI] [PubMed] [Google Scholar]
- Boone J. M. and Chavez A. E., “Comparison of x-ray cross sections for diagnostic and therapeutic medical physics,” Med. Phys. 23, 1997–2005 (1996). 10.1118/1.597899 [DOI] [PubMed] [Google Scholar]
- Jong R. A., Yaffe M. J., Skarpathiotakis M., Shumak R. S., Danjoux N. M., Gunesekara A., and Plewes D. B., “Contrast-enhanced digital mammography: Initial clinical experience,” Radiology 228, 842–850 (2003). 10.1148/radiol.2283020961 [DOI] [PubMed] [Google Scholar]
- Johns P. C. and Yaffe M. J., “Theoretical optimization of dual-energy x-ray imaging with application to mammography,” Med. Phys. 12, 289–296 (1985). 10.1118/1.595766 [DOI] [PubMed] [Google Scholar]
- Johns P. C., Drost D. J., Yaffe M. J., and Fenster A., “Dual-energy mammography: Initial experimental results,” Med. Phys. 12, 297–304 (1985). 10.1118/1.595767 [DOI] [PubMed] [Google Scholar]
- Kak A. C. and Slaney M., Principles of Computerized Tomographic Imaging (IEEE, New York, 1988). [Google Scholar]
- Kalemci E. and Matteson J. L., “Investigation of charge sharing among electrode strips for a CdZnTe detector,” Nucl. Instrum. Methods Phys. Res. A 478, 527–537 (2002). 10.1016/S0168-9002(01)00892-0 [DOI] [Google Scholar]
- LeClair R. J., Wang Y. K., Zhao P. Y., Boileau M., Wang L. L., and Fleurot F., “An analytic model for the response of a CZT detector in diagnostic energy dispersive x-ray spectroscopy,” Med. Phys. 33, 1329–1337 (2006). 10.1118/1.2190331 [DOI] [PubMed] [Google Scholar]


