Abstract
A study was made of glycine (Gly) and γ-aminobutyric acid (GABA) receptors expressed in Xenopus oocytes injected with rat mRNAs isolated from the encephalon, midbrain, and brainstem of 18-day-old rat embryos. In oocytes injected with encephalon, midbrain, or brainstem mRNAs, the Gly-current amplitudes (membrane current elicited by Gly; 1 mM Gly) were respectively 115 ± 35, 346 ± 28, and 389 ± 22 nA, whereas the GABA-currents (1 mM GABA) were all ≤40 nA. Moreover, the Gly-currents desensitized faster in oocytes injected with encephalon or brainstem mRNAs. The EC50 for Gly was 611 ± 77 μM for encephalon, 661 ± 28 μM for midbrain, and 506 ± 18 μM for brainstem mRNA-injected oocytes, and the corresponding Hill coefficients were all ≈2. Strychnine inhibited all of the Gly-currents, with an IC50 of 56 ± 3 nM for encephalon, 97 ± 4 nM for midbrain, and 72 ± 4 nM for brainstem mRNAs. During repetitive Gly applications, the Gly-currents were potentiated by 1.6-fold for encephalon, 2.1-fold for midbrain, and 1.3-fold for brainstem RNA-injected oocytes. Raising the extracellular Ca2+ concentration significantly increased the Gly-currents in oocytes injected with midbrain and brainstem mRNAs. Reverse transcription–PCR studies showed differences in the Gly receptor (GlyR) α-subunits expressed, whereas the β-subunit was present in all three types of mRNA. These results indicate differential expression of GlyR mRNAs in the brain areas examined, and these mRNAs lead to the expression of GlyRs that have different properties. The modulation of GlyRs by Ca2+ could play important functions during brain development.
In all vertebrates the main neurotransmitters responsible for fast inhibitory synaptic transmission are the amino acids glycine (Gly) and γ-aminobutyric acid (GABA), which act on their specific receptors (1, 2). Molecular cloning indicates that both Gly receptors (GlyR) and GABA receptors (GABAR) have a pentameric subunit structure, arranged around a chloride-selective ion channel. The GlyR is composed of two types of glycosylated integral membrane proteins (α1–α4 and β) and an associated peripheral membrane protein (1). On the other hand, the GABAR are made up of combinations of α-, β-, γ-, δ-, ɛ-, π-, or ρ-subunits (3).
The density, location, and subunit composition of some neurotransmitter receptors change during development. For example, mammalian fetal skeletal muscle fibers have acetylcholine receptors along their entire surface and the receptors disappear from the nonjunctional areas during development (4), and their subunit composition is also changed (5). Similarly, the amount of GlyR gene translation, assessed by the injection of developing rat cerebral cortex mRNA into Xenopus oocytes, decreases with age, whereas that of GABARs increases (6). Moreover, the type and location of mRNAs coding for GlyR changes ontogenetically (7), and the subunit composition is also changed, because the α2-subunit seen by in situ hybridization in embryonic day 14 (E14) midbrain is not found after E19 (8). Additionally, during development, the α2-subunit is replaced by the α1-subunit in GlyRs; and the GABA receptor α2/α3α5β changes into α1α4β2δ (9, 10). All these changes are likely to be important for the development of the nervous system.
It was of interest to see whether the different Gly/GABA receptor mRNA ratios found in the developing rat cerebral cortex (6) also occur in other regions of the central nervous system. As a start, we have focused on the encephalon, midbrain, and brainstem of 18-day-old rat embryos. Some of the results have already been presented in preliminary form.
Methods
Embryonic Tissues.
Sprague–Dawley rats were mated overnight and, if the female was found to have a vaginal plug, the following day was called E1. Animals were housed under controlled conditions of temperature (22 ± 2°C), humidity (40–60%), and light (12-h light/12-h dark cycle), and provided with food and water ad libitum. To obtain brain tissues, rats were deeply anesthetized with sodium pentobarbital (40 mg/kg i.p.), fetuses were removed by abdominal surgery, and the encephalon (whole brain, minus midbrain and brainstem), midbrain, and brainstem were dissected out, placed immediately in liquid nitrogen, and stored at −70°C until processed. Each brain dissection took less than 5 min. Brain regions were identified according to a rat development atlas (11).
Isolation of Poly(A+) RNA.
Total RNAs were isolated by the phenol/chloroform method, essentially as described (12). The absorbance ratio, A260/A280, was ≈2 when the RNA was dissolved in 20 mM Hepes, pH 7.5. Poly (A)+ RNA was then isolated by oligo(dT) chromatography and dissolved in water to a concentration of 2 mg/ml. Three different mRNA preparations were obtained for each region and they gave essentially the same results.
Oocyte Injection and Recording.
The methods used were as previously described (13). Segments of ovary were surgically removed from Xenopus laevis frogs (Xenopus I, Ann Arbor, MI), and stages V–VI follicle-enclosed oocytes were isolated and maintained at 16–18°C in Barth's solution [88 mM NaCl/1 mM KCl/0.33 mM Ca(NO3)2/0.41 mM CaCl2/0.82 mM MgSO4/2.4 mM NaHCO3/5 mM Hepes–NaOH (pH 7.4)/0.1 mg/ml gentamicin sulfate]. The next day, each oocyte was injected with 100 ng of mRNA, and 2 days later the oocytes were treated with collagenase (Sigma type I; 0.5–1 mg/ml) to remove the follicular and other enveloping cells (14). Three to five days after injection, ionic currents were recorded at room temperature (20–24°C) by using a two-microelectrode (3 M KCl) voltage clamp, with the membrane potential usually held at −60 mV. Oocytes were stabilized in a recording chamber (volume ≈0.1 ml) and continuously perfused (5–7 ml/min) with normal frog Ringer's solution [115 mM NaCl/2 mM KCl/1.8 mM CaCl2/5 mM Hepes–NaOH (pH 7.0)]. Membrane currents were recorded on a digital oscilloscope (Nicolet 310) and stored on disks for subsequent computer analyses with a program written by Rico Miledi. Values stated are given as the mean ± SEM. Gly was diluted daily in Ringer's solution, from a 1 M stock kept at 4°C, and applied via the perfusion system.
Gly dose–response relationships were fitted to the Hill equation:
 |
where I[glycine] is the dose-dependent Gly-current amplitude, Imax is the maximal current elicited by Gly, EC50 is the half-excitatory concentration of Gly, and nH is the Hill coefficient. The inhibitory strychnine dose–response relationships were fitted to the Hill equation:
 |
where Istrychnine is the Gly-current in the presence of strychnine, Ip is the control peak current, and IC50 is the half-inhibitory concentration of strychnine (15).
Reverse Transcription–PCR (RT-PCR).
Poly(A)+ RNA was converted to first-strand cDNA (Titan One Tube RT-PCR system, Roche Molecular Biochemicals) by using specific GlyR-subunit primers. We used 1 μg of mRNA and the template was denatured at 94°C for 2 min, 10 cycles of denaturation at 94°C for 30 s, annealing at 50°C for 30 s, and elongation at 68°C 1 min; followed by 25 cycles of denaturation at 94°C for 30 s, annealing 50°C for 30 s, and elongation at 68°C 3 min; and finally, 1 elongation of 7 min at 68°C. Glyceraldehyde-3-phosphate dehydrogenase served as a positive control, and water served as a negative control. The amplified reactions were visualized in ethidium bromide-stained 1.5% agarose gels.
Results
Expression of Gly and GABA Receptors by Embryonic Brain mRNAs.
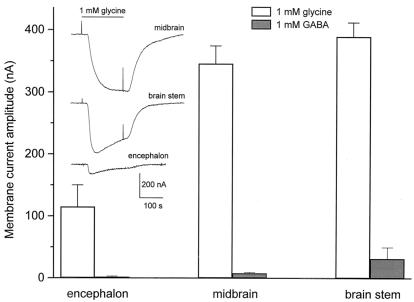
In control (noninjected) oocytes, the superfusion of 1 mM Gly consistently evoked only small membrane currents (1–10 nA), caused by the activation of a native electrogenic Gly transporter (R.M., unpublished data), and 1 mM GABA usually did not evoke detectable membrane currents. In contrast, the application of Gly or GABA to oocytes injected with mRNA derived from encephalon, midbrain, or brainstem elicited substantial inward membrane currents (Fig. 1). The level of GlyR expression, as judged by the amplitude of the membrane currents evoked, varied according to the origin of the mRNA injected (Fig. 1 and Table 1). The level of GABAR expression by the three types of E-18 rat embryo mRNA followed a similar pattern but the currents were considerably smaller (Fig. 1). The ratios of Gly-current to GABA-current were 57.5 for encephalon, 43.3 for midbrain, and 12.2 for brainstem. For the rest of this article we focus on the Gly responses.
Figure 1.
Expression of Gly and GABA receptors by embryonic mRNAs. The columns represent the amplitude of membrane currents elicited by Gly or GABA (both 1 mM) in oocytes injected with mRNA from 18-day-old rat embryo encephalon, midbrain, or brainstem. (Inset) Representative Gly-currents. For this and subsequent figures, the downward deflections correspond to inward currents, the membrane potential was held at −60 mV (unless otherwise indicated), and Gly was applied as indicated by a continuous line and by brief depolarizing pulses. Each column represents the mean + SEM. The number of oocytes studied (from five donors) were 26, 43, and 18 (Gly-currents), and 26, 10, and 36 (GABA-currents) for encephalon, midbrain, and brainstem mRNAs, respectively.
Table 1.
GlyR characteristics
| Brain area | Expression, nA | EC50, μM | Hill coefficient | IC50, nM |
|---|---|---|---|---|
| Encephalon | 115 ± 35 | 611 ± 77 | 2.0 ± 0.5 | 56 ± 3 |
| Midbrain | 346 ± 28 | 661 ± 28 | 1.9 ± 0.1 | 97 ± 4 |
| Brain stem | 389 ± 22 | 506 ± 18 | 2.4 ± 0.2 | 72 ± 4 |
For level of expression, the numbers represent Gly-current amplitudes (mean ± SEM), evoked by 1 mM glycine in oocytes injected with encephalon, midbrain, and brain stem mRNAs (n = 26, 43, and 18, respectively). The EC50 and IC50 values were derived from the Hill equation.
Gly Dose–Response Relationships.
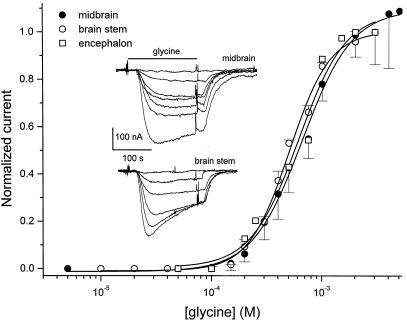
Gly-currents were first detectable with about 100 μM Gly, increased steeply in size as the Gly dose was raised, and reached a maximum with about 3 mM Gly (Fig. 2). The EC50, derived from fitting the data to the Hill equation (15) and the corresponding Hill coefficients, are summarized in Table 1. The difference between midbrain and brainstem is significant (P < 0.05), indicating that the affinity for Gly is slightly higher for brainstem GlyRs, whereas the cooperative properties are very similar.
Figure 2.
Gly dose–response relationships. Current amplitude as a function of Gly concentration, from oocytes injected with encephalon, midbrain, or brainstem mRNAs. Responses were normalized to the current at 3 mM. Continuous lines represent least-squares fits to the Hill equation. Each point shows the mean ± SEM for five oocytes from three different donors in midbrain and brainstem, and two donors for encephalon. (Inset) Typical currents elicited by 0.1, 0.2, 0.3, 0.4, 0.5, 0.75, and 1.0 (midbrain), and by 0.1, 0.2, 0.3, 0.4, 0.5, and 0.75 mM Gly (brainstem).
At low doses of Gly, the membrane current increased approximately as the 2.5th power of the Gly concentration in oocytes injected with midbrain mRNAs, and the 2.9th power in oocytes injected with brainstem mRNA. These values are not significantly different between themselves and are similar to those for GlyRs expressed by fetal human brain and rat spinal cord mRNAs (7, 16), all of which suggests that at least three molecules of Gly must bind to a GlyR to gate the ion channel with a high degree of cooperativity.
Current–Voltage Relationships.
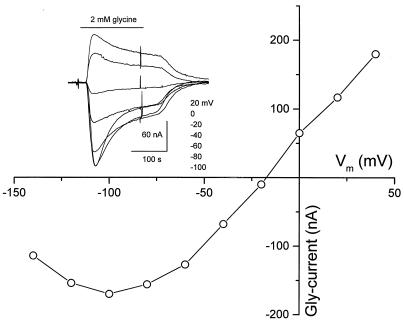
The voltage dependence of Gly-currents was investigated by holding the membrane potential at different levels and applying 2 mM Gly every 10 min. As with other GlyRs expressed in oocytes (17), the Gly-current amplitude decreased as the membrane potential was depolarized (Fig. 3), and in all cases the Gly-current reversal potential was close to the Cl− equilibrium potential (−30 mV; ref. 18), similar to GlyRs expressed by bovine retina and rat spinal cord mRNAs (19, 20). The current–voltage relationships were nearly linear from −50 to +50 mV, but displayed a clear outward rectification at hyperpolarizing potentials attributable to a decrease in the channel open-time (16, 20). These results indicate that Cl− is the main anion flowing through the channels gated by the receptors expressed by the three mRNAs.
Figure 3.
Gly-current–voltage relationship. Current-to-voltage relationship from one oocyte injected with brainstem mRNA obtained by applying brief voltage steps, from −140 to 40 mV, in the absence and presence of 2 mM Gly and subtracting the passive membrane currents in the absence of Gly. (Inset) Representative Gly-currents in another oocyte. Gly (2 mM) was applied every 10 min at the indicated membrane potentials.
Desensitization of Gly-Currents.
With low concentrations of Gly (100–300 μM), the currents elicited were relatively well maintained (Figs. 1 and 2). However, with higher concentrations, the Gly-currents reached a peak and then declined in the continuous presence of Gly (Figs. 1 and 2). This decay was mainly caused by receptor desensitization and it became progressively faster as the Gly concentration was increased (Fig. 2, Inset). The desensitization was significantly less for Gly-currents evoked by oocytes injected with midbrain mRNA than for those injected with encephalon or brainstem mRNAs. To assess this difference, we measured the onset and the decay of the Gly-currents in oocytes injected with midbrain or brainstem mRNAs, which generated maximal currents of approximately the same amplitude. In that set of experiments the Gly-currents, evoked by 1 mM Gly, were 319 ± 37 nA (n = 23) for oocytes injected with midbrain mRNA, and 444 ± 18 nA (n = 12) for oocytes injected with brainstem mRNA. The time to peak was 107 ± 9 s in the former case, and 35 ± 2 s in the latter; 2 min after applying Gly the currents decayed to 92% ± 1% in midbrain- and 62% ± 3% in brainstem-mRNA injected oocytes. The Gly-currents were thus significantly slower in both onset and desensitization in the oocytes injected with midbrain mRNA. Furthermore, the onset and the decay of the currents became faster as the Gly concentration was increased (Fig. 2), and also with membrane hyperpolarization (data not shown).
Potentiation of Gly-Currents.
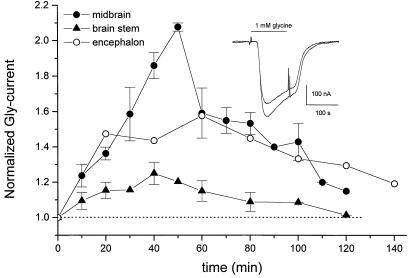
Interestingly, we consistently found that when 1 mM Gly was applied repeatedly (at 10-min intervals), the Gly-current amplitude increased progressively. This potentiation was evaluated as the nth current amplitude compared with that elicited by the first application of Gly (Fig. 4). The greatest potentiation was found in oocytes injected with midbrain mRNA (2.1 ± 0.0 times), intermediate for encephalon mRNA (1.6), and smallest for brainstem (1.3 ± 0.1) mRNA. In all cases, the potentiation was maximal after five to six Gly exposures, and during subsequent applications the current amplitude began to decrease toward the control levels (Fig. 4).
Figure 4.
Potentiation of Gly-currents. Amplitudes of repetitive Gly-currents in oocytes injected with encephalon (n = 2), midbrain (n = 4), or brainstem (n = 8) mRNAs. Gly (1 mM) was applied for 2 min at about 10 min intervals. Time 0 indicates the first application; potentiation was greater for midbrain than for encephalon or brainstem. (Inset) Examples of the first and fourth Gly-currents from an oocyte injected with brainstem mRNA.
Gly-Current Modulation by Calcium.
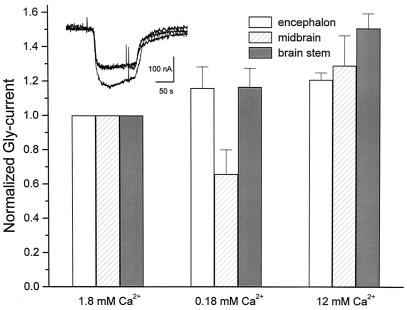
In view of the Gly-current potentiation, it was of interest to examine the effects of extracellular calcium on the Gly-current. For this purpose, the oocytes were exposed to Gly while being superfused with normal Ringer's solution or with solutions containing low (0.18 mM) or high (12 mM) concentrations of Ca2+. In oocytes injected with encephalon, midbrain, or brainstem mRNA, and exposed to high Ca2+, the Gly-currents increased, respectively, to 1.2 ± 0.0, 1.3 ± 0.2, and 1.5 ± 0.1 times their amplitude in normal Ringer's solution (Fig. 5). These values were significantly different for midbrain and brainstem (P < 0.05) compared with those in low Ca2+, and the increase of the Gly-current in high Ca2+ was different for brainstem compared with normal Ca2+.
Figure 5.
Gly current modulation by calcium. The columns represent the mean + SEM (n = 3) of Gly-currents elicited by 1 mM Gly in the presence of different Ca2+ concentrations. (Inset) Currents elicited by 1 mM Gly in normal Ringer's solution, and in the presence of high Ca2+ (12 mM) in an oocyte injected with midbrain mRNA.
Effects of Strychnine on GlyRs.
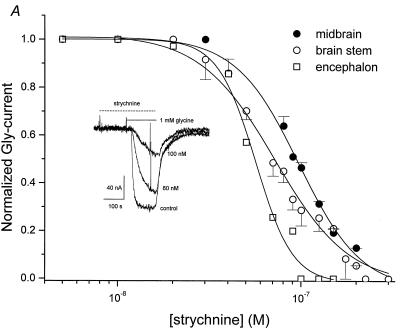
To examine the effect of the specific GlyR antagonist, strychnine, dose–response relationships were obtained by applying Gly (1 mM) and various concentrations of strychnine to oocytes injected with the three different mRNAs (Fig. 6). Oocytes were preincubated with strychnine for 2 min and then exposed to Gly plus strychnine. A decrease in Gly-current was first detected with about 40 nM strychnine, and as the strychnine concentration was increased, the Gly-currents decreased until they became undetectable with about 300 nM strychnine. The IC50 for strychnine obtained by fitting the data to the Hill equation was 56 ± 3 nM for encephalon mRNA, 97 ± 4 nM for midbrain mRNA, and 72 ± 4 nM for brainstem mRNA. The IC50 values for encephalon and midbrain were significantly different (P < 0.05).
Figure 6.
Inhibition of Gly-currents by strychnine. Gly-current amplitudes normalized to the current in the absence of strychnine. Continuous lines represent least squares fits to the Hill equation. Each point shows the mean ± SEM for three oocytes injected with mRNAs from midbrain and brainstem, and from one oocyte injected with mRNA from encephalon. The oocytes were from three different donors. (Inset) Typical currents elicited by 1 mM Gly and inhibited by strychnine in an oocyte injected with midbrain mRNA.
Distribution of GlyR Subunits.
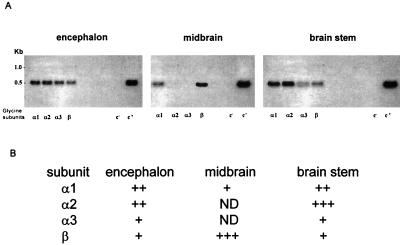
To complement the electrophysiological studies, we used mRNAs from encephalon, midbrain, and brainstem as templates for RT-PCR assays, using primers specific for GlyR subunits. In the three mRNA samples, the subunits were differentially expressed. The α1- and β-transcripts were present in all of the mRNAs, whereas the α2- and α3-GlyR transcripts were not detected in the midbrain but were present in the encephalon and brainstem mRNAs (Fig. 7).
Figure 7.
Distribution of GlyR-subunit transcripts. (A) The lanes show the GlyR subunits present in encephalon, midbrain, and brainstem mRNAs amplified by RT-PCR. Subunits: α1-, α2-, α3-, and β- as well as negative (c−, water) and positive (c+, glyceraldehyde-3-phosphate dehydrogenase) controls. (B) Semiquantitative signals in 1.5% agarose gel; the signals were designated weak, +; moderate, ++; and intense, +++. ND, not detected. Note that the α1- and β-subunits were amplified from all mRNAs, and that the α2- and α3-subunits were present in encephalon and brainstem but not in the midbrain.
Discussion
Gly-currents evoked in the mRNA-injected oocytes are clearly caused by activation of GlyRs, because noninjected oocytes exposed to Gly do not elicit appreciable membrane currents. The maximal amplitudes of Gly-currents generated by oocytes injected with midbrain and brainstem mRNAs were similar, and both were much larger than the currents elicited by oocytes injected with encephalon mRNA. We believe that this difference is genuine and is not merely caused by variations in mRNA preparation, because the three tissue samples were obtained from the same fetuses and the RNAs were extracted at the same time by using the same stock solutions. Moreover, similar results were obtained with three sets of mRNAs and each set was always injected into oocytes from the same donor. Therefore, the different magnitudes of Gly-currents expressed by the mRNAs probably reflect real developmental differences in the amounts of GlyR transcripts in these structures. The ratio between Gly and GABA receptors is consistent with that observed for cerebral cortex mRNA (6). Another interesting difference concerns the slightly lower dissociation constant of brainstem GlyRs (EC50 = 506 μM), compared with encephalon and midbrain GlyRs (611 and 661 μM). This EC50 is higher than for oocytes injected with cerebral cortex mRNA (385 μM; ref. 6), and much higher than for lamprey spinal cord neurons (16 μM; ref. 21). These differences may be caused by variations in the GlyR subunits and the associated proteins that make up the particular receptor complexes.
The process of desensitization, which is an intrinsic property of the majority of ionotropic neurotransmitter receptors, is reflected on the macroscopic current by a decline in amplitude during a maintained application of the agonist. This desensitization was slower in the oocytes injected with midbrain mRNA. Moreover, the rate of Gly-current onset was also slower in oocytes injected with midbrain mRNA. These divergences may be related to differences in receptor affinity for Gly and in the time that the channels remain open. The difference in the rate of GlyR desensitization described here would predict that inhibitory synaptic currents would be faster for encephalon and brainstem than for midbrain neurons. These differences may play an important role in the transmission of signals in those central nervous system regions.
Another finding of particular interest is that the Gly-currents generated by the receptors expressed by the three types of mRNAs increased in amplitude during repeated Gly applications. The mechanism of this potentiation still remains to be determined, but, for example, it could involve protein kinase C, as occurs for the potentiation of Gly-currents in oocytes expressing the α-subunits (22). The increase of the Gly-current may be relevant to the long-term potentiation induced by Gly observed in a midbrain nucleus, the superior colliculus (23). The mechanism of the increase in Gly-current amplitude caused by high Ca2+ may be the presence of a diffusible Ca2+-binding cytoplasmic factor that modulates the GlyR channel gating, or the binding to a site similar to that for zinc in the extracellular N-terminal region of the human GlyR α1-subunit (24, 25).
The differences in the IC50 of strychnine for GlyRs expressed by the three mRNAs could be related to the expression level or the density of receptors (26), because midbrain and brainstem had similar IC50 values and levels of expression when compared with encephalon mRNA-injected oocytes.
The roles played by GlyRs in cell–cell communication in the developing brain are still unknown. However, GlyRs may participate in neuronal differentiation by modulating intracellular calcium dynamics (27), and endogenous Gly could activate other receptors such as the GABA ρ1 (28). During development, the activation of GABAA receptors by their specific agonist (GABA) or by Gly depolarizes young cortical neurons and leads to rises in intracellular free calcium concentration via voltage-gated calcium channels (29). Moreover, the development of neuronal structure and function has also been linked to glycinergic inhibition in the lateral superior olive (30, 31). It is clear that more studies are necessary to clarify these issues.
In summary, the differences in the magnitude of Gly-currents expressed, the degree of desensitization, the modulation of GlyRs by Ca2+, and the effects of strychnine are probably a reflection of a distinct subunit composition of the receptors in the different areas. The diversity of GlyR subunits present in these regions reflects the GlyR genes transcribed in the brain areas at this stage of development. It is notable that mRNA encoding the GlyR α1-subunit was present in the three embryonic areas studied here; other studies propose that the α2-subunit is a fetal form, whereas the α1-subunit is an adult form (9).
Acknowledgments
We are very grateful to M. Sc. Marina González-Herrera for help with the RNA extraction, Elizabeth Vázquez Gómez for the care of animals, and Dr. Nick Spitzer and Dr. Fabrizio Eusebi for helpful discussion of the manuscript. This work was supported by a grant from the Consejo Nacional de Ciencia y Tecnología, México (G25775N), and from the National Science Foundation (Neural and Glial Mechanisms, Grant 9982856).
Abbreviations
- GABA
γ-aminobutyric acid
- GlyR
Gly receptor
- GABAR
GABA receptor
- En
embryonic day n
- RT-PCR
reverse transcription–PCR
Footnotes
García-Alcocer, G., Martínez-Torres, A., García-Colunga, J. & Miledi, R. (1999) Soc. Neurosci. Abstr. 25, 710–716.
References
- 1.Betz H, Kuhse J, Schmieden V, Laube B, Kirsch J, Harvey R J. Ann NY Acad Sci. 1999;868:667–676. doi: 10.1111/j.1749-6632.1999.tb11343.x. [DOI] [PubMed] [Google Scholar]
- 2.Bormann I. Trends Pharmacol Sci. 2000;21:16–19. doi: 10.1016/s0165-6147(99)01413-3. [DOI] [PubMed] [Google Scholar]
- 3.Mehta A K, Ticku M K. Brain Res Rev. 1999;29:196–217. doi: 10.1016/s0165-0173(98)00052-6. [DOI] [PubMed] [Google Scholar]
- 4.Diamond J, Miledi R. J Physiol (London) 1962;162:393–408. doi: 10.1113/jphysiol.1962.sp006941. [DOI] [PMC free article] [PubMed] [Google Scholar]
- 5.Lukas R J, Changeux J-P, Le Novere N, Albuquerque E X, Balfour D J K, Kerg D K, Bertrand D, Chiappinelli V A, Clarke P B, Collins A C, et al. Pharmacol Rev. 1999;51:397–401. [PubMed] [Google Scholar]
- 6.Carpenter M K, Parker I, Miledi R. Proc R Soc London Ser B. 1988;234:159–170. doi: 10.1098/rspb.1988.0042. [DOI] [PubMed] [Google Scholar]
- 7.Akagi H, Miledi R. Science. 1988;242:270–273. doi: 10.1126/science.2845580. [DOI] [PubMed] [Google Scholar]
- 8.Malosio M L, Marqueze-Pouey B, Kuhse J, Betz H. EMBO J. 1991;10:2401–2409. doi: 10.1002/j.1460-2075.1991.tb07779.x. [DOI] [PMC free article] [PubMed] [Google Scholar]
- 9.Takahashi T, Momiyama A, Hirai K, Hishinuma F, Akagi H. Neuron. 1992;9:1155–1161. doi: 10.1016/0896-6273(92)90073-m. [DOI] [PubMed] [Google Scholar]
- 10.Laurie D J, Wisden W, Seeburg P H. J Neurosci. 1992;12:4151–4172. doi: 10.1523/JNEUROSCI.12-11-04151.1992. [DOI] [PMC free article] [PubMed] [Google Scholar]
- 11.Altman J, Bayer S A. Atlas of Prenatal Rat Brain Development. Boca Raton, FL: CRC; 1995. pp. 389–445. [Google Scholar]
- 12.Sumikawa K, Parker I, Miledi R. Methods Neurosci. 1989;1:30–44. [Google Scholar]
- 13.Miledi R. Proc R Soc London Ser B. 1982;215:491–497. doi: 10.1098/rspb.1982.0056. [DOI] [PubMed] [Google Scholar]
- 14.Miledi R, Woodward R M. J Physiol (London) 1989;416:601–621. doi: 10.1113/jphysiol.1989.sp017780. [DOI] [PMC free article] [PubMed] [Google Scholar]
- 15.Zubay G. Biochemistry. 4th Ed. Dubuque, IA: WCB McGraw–Hill; 1998. pp. 220–221. [Google Scholar]
- 16.Gundersen C B, Miledi R, Parker I. Proc R Soc London Ser B. 1984;221:235–244. doi: 10.1098/rspb.1984.0032. [DOI] [PubMed] [Google Scholar]
- 17.Gundersen C B, Miledi R, Parker I. J Physiol (London) 1986;377:40. [Google Scholar]
- 18.Kusano K, Miledi R, Stinnakre J. J Physiol (London) 1982;328:143–170. doi: 10.1113/jphysiol.1982.sp014257. [DOI] [PMC free article] [PubMed] [Google Scholar]
- 19.Parker I, Sumikawa K, Miledi R. Proc R Soc London Ser B. 1985;225:99–106. doi: 10.1098/rspb.1985.0052. [DOI] [PubMed] [Google Scholar]
- 20.Morales A, Nguyen Q, Miledi R. Proc Natl Acad Sci USA. 1994;91:3097–3101. doi: 10.1073/pnas.91.8.3097. [DOI] [PMC free article] [PubMed] [Google Scholar]
- 21.Baev K, Rusin K, Safronov V. Neuroscience. 1992;46:931–941. doi: 10.1016/0306-4522(92)90195-8. [DOI] [PubMed] [Google Scholar]
- 22.Mascia M P, Wick M J, Martinez L D, Harris A. Br J Pharmacol. 1998;125:263–270. doi: 10.1038/sj.bjp.0702054. [DOI] [PMC free article] [PubMed] [Google Scholar]
- 23.Platt B, Bate J R, Von Linstow Roloff E, Withington D J. Br J Pharmacol. 1998;125:293–300. doi: 10.1038/sj.bjp.0702062. [DOI] [PMC free article] [PubMed] [Google Scholar]
- 24.Bregestovski P. Synaptic Transmission 100 Years After L. Luciani. Italy: Casa Editrice Scientifica Internazionale; 2000. pp. 21–24. [Google Scholar]
- 25.Laube B, Kuhse J, Betz H. J Physiol (London) 2000;522:215–230. doi: 10.1111/j.1469-7793.2000.t01-1-00215.x. [DOI] [PMC free article] [PubMed] [Google Scholar]
- 26.Taleb O, Betz H. EMBO J. 1994;13:1318–1324. doi: 10.1002/j.1460-2075.1994.tb06384.x. [DOI] [PMC free article] [PubMed] [Google Scholar]
- 27.Lo Y, Rao S C, Sanes D H. Neuroscience. 1998;83:1075–1084. doi: 10.1016/s0306-4522(97)00410-7. [DOI] [PubMed] [Google Scholar]
- 28.Calvo D, Miledi R. NeuroReport. 1995;6:1118–1120. doi: 10.1097/00001756-199505300-00011. [DOI] [PubMed] [Google Scholar]
- 29.Obrietan K, Van den Pol A. J Neurosci. 1995;15:5065–5077. doi: 10.1523/JNEUROSCI.15-07-05065.1995. [DOI] [PMC free article] [PubMed] [Google Scholar]
- 30.Aporte J E, Kotak V C, Sanes D H. Auditory Neurosci. 1996;2:235–240. [Google Scholar]
- 31.Sanes D H, Hafidi A. J Neurobiol. 1996;31:503–511. doi: 10.1002/(SICI)1097-4695(199612)31:4<503::AID-NEU9>3.0.CO;2-D. [DOI] [PubMed] [Google Scholar]


