Abstract
Background/Aims
The levels of pepsinogen (PG) I and the PGI/II ratio are useful serologic markers for chronic atrophic gastritis. This study evaluated the performance and clinical implications of these markers in patients undergoing endoscopic mucosectomy.
Methods
We enrolled 142 consecutive patients with early gastric tumors and Helicobacter pylori infection who were eligible for mucosectomy. Chronic gastritis and atrophy were assessed using four defined biopsy procedures. Serum PGs were measured by an enzyme immunoassay. Optimal diagnostic cut-offs and performance were determined using receiver operating characteristic curves.
Results
The PGI level and the PGI/II ratio decreased with corpus-dominant gastritis and as atrophy advanced toward the corpus greater curvature (GC). For the presence of corpus GC atrophy, the areas under the PGI and PGI/II-ratio curves were 0.82 and 0.77, respectively. The optimal cut-off levels were 59.3µg/L for PGI (sensitivity, 83.3%; specificity, 78.4%) and 3.6µg/L for PGI/II ratio (sensitivity, 70.0%; specificity, 78.4%). Using these serologic cut-off levels, we found that the frequency of corpus tumor location differed significantly (32.9% vs 11.1% for PGI <59.3 and ≥59.3µg/L, respectively; and 31.1% vs 14.8% for PGI/II ratio <3.5 and ≥3.5, respectively; p<0.05).
Conclusions
A low PGI level and PGI/II ratio are valuable serologic markers for predicting corpus GC atrophy, and have clinical implications with respect to the corpus location of tumors in mucosectomy patients.
Keywords: Pepsinogens, Atrophic gastritis, Stomach neoplasia, Helicobacter pylori, Endoscopy
INTRODUCTION
Chronic atrophic gastritis (CAG), predominantly caused by Helicobacter pylori infection, is an important precursor of gastric cancer.1,2 Several large-scale studies have addressed the benefits of H. pylori eradication before the appearance of premalignant CAG, leading to a requirement for risk stratification according to CAG stage.3-5
Histology is the gold standard method for determining CAG. However, assessment of mucosal atrophy by histology has some limitations, including the inconvenience of endoscopic biopsy and inter- or intra-observer variations even using well-organized histologic scoring systems.6
Serum pepsinogen (PG) profiles are introduced with the goal of noninvasive and topographic measurements of gastric mucosal atrophy. Large European cohort studies have demonstrated that PGI and PGI/II are useful markers to screen patients for CAG or corpus atrophy.7,8 Japanese trials have also provided evidence that such measurements are valuable risk-stratification parameters for gastric cancer development.9,10
Despite the usefulness as a noninvasive screening method, especially in regions with high incidence of gastric cancer, discriminative abilities of the PG profiles for CAG have not been validated in Korea. We therefore conducted this study to evaluate the performance and implications of PGI concentration and PGI/II ratio using patient-population undergoing endoscopic mucosal resection (EMR), who had CAG in the corpus mucosa due to prolonged H. pylori infection.
MATERIALS AND METHODS
1. Study population
Patients aged 35-75 years with noncardiac gastric dysplasia or adenocarcinoma, who were eligible for EMR, and with H. pylori infection were enrolled prospectively. Indications for EMR included: 1) low-grade dysplasia ≥1 cm in size; 2) high-grade dysplasia of any size; or 3) differentiated adenocarcinoma ≤3 cm in size, mucosa-confined, and with no evidence of ulcer or ulcer scar.11 Patients with adenocarcinoma were also evaluated for metastasis or regional lymph node enlargement by abdominal computed tomography. Endoscopic intervention for low-grade dysplasia has been recommended in our institution because a substantial proportion of patients with such dysplasia have carcinomatous changes in final resected specimens.12,13
Patients with severe concomitant illness (cardiac, respiratory, hepatic, or renal insufficiency), previous intra-abdominal surgery, prior H. pylori eradication therapy, or contraindications for EMR (major coagulopathy or a bleeding tendency) were excluded from the study, as were patients who received drugs that affect gastric acid secretion, such as antacids, bismuth compounds, H2-receptor antagonists, and proton-pump inhibitors, in the preceding 14 days.
The study protocol was approved by the Institutional Review Board of Asan Medical Center, Korea, and written informed consent was obtained from all participants.
2. Endoscopic procedure and biopsy
Following histologic confirmation of gastric neoplasia and study eligibility, EMR was performed using a gastroduodenoscope (GIF-H260; Olympus, Tokyo, Japan) while the patient was under conscious sedation. The EMR procedure was performed as previously described techniques.14,15
During the procedure, eight biopsy specimens were obtained using elongated large-cup forceps (Olympus FB-24k-1; Olympus) for histologic examination of CAG: two specimens were from the lesser curvature (LC) of the antrum; two from the LC of the upper corpus; two from the greater curvature (GC) of the lower corpus; and two from the GC of the upper corpus. These four biopsy sites were chosen because H. pylori-induced gastritis progresses from the gastric angularis toward the antrum and corpus along the LC, and then involves the corporal GC upward to the fundus.16,17 Any suspicious abnormal mucosal lesions were biopsied, and all patients were treated with proton-pump inhibitors for 4 weeks after the procedure.
3. Histologic evaluation of chronic gastritis and atrophy
Separate paired biopsy samples were formalin-fixed and paraffin-embedded. The specimens were sectioned, stained with hematoxylin and eosin, and examined by experienced gastrointestinal pathologists (Jang SJ, Park YS, and Kim MJ) who were blinded to clinical information.
Chronic gastritis and atrophy were scored using the updated Sydney system. By grading with a 4-point visual analogue scale from 0 (absent) to 3 (marked) in each specimen from the LC of the antrum and the GC of the upper corpus, chronic inflammation was classified as antrumdominant gastritis, pan-gastritis, or corpus-dominant gastritis. Glandular atrophy was defined as the loss of normal gastric glands with or without replacement by fibrosis and/or intestinal metaplasia. Extent of corpus atrophy was graded using a staging system that was designed to evaluate the extent of the pyloro-corporal atrophic front.16,17 This was a 4-point system ranging from 0 (none) to 3 (severe); with 0, no atrophy at the corpus; 1 (mild), atrophy only at the corpus LC site; 2 (moderate), atrophy at the lower corpus GC site with involvement of the LC site; and 3 (severe), atrophy involving the upper corpus GC.16
4. Diagnosis of H. pylori infection
H. pylori infection was determined by a positive result to either 13C-urea breath test (UBiT, Otsuka, Japan) or anti-H. pylori IgG Immulite test (Diagnostic Products Co., Los Angeles, CA, USA). Both samples were obtained at 8 AM on the day of EMR and assessed before the EMR.
5. Measurement of serum PGI, PGII, and gastrin-17 levels
Overnight fasting venous blood was sampled at 8 AM of EMR day. Sera were stored at -70℃ until assayed. PGI, PGII, and amidated gastrin-17 concentrations were measured in duplicate using specific enzyme immunoassay kits (Pepsinogen-I, Pepsinogen-II, and Gastrin-17 EIA Test Kits; Biohit Plc, Helsinki, Finland) according to the manufacturer's instructions.
6. Statistical analysis
Categorical variables were compared using chi-square or Fisher's exact tests. Continuous variables were presented as mean±standard deviation, and compared by analysis of variance or the Kruskal-Wallis test. Optimal cut-off values and performance (sensitivity, specificity, predictive values, and accuracy) of PGI concentration and PGI/II ratio were calculated from receiver-operating characteristic (ROC) curves and 95% confidence intervals (CI). The areas under the ROC curves were used to determine the discriminatory ability of PGI and PGI/II. Statistical analyses were performed using SAS software version 9.1 (SAS Institute Inc., Cary, NC, USA). All statistical calculations were two-sided, and p<0.05 indicated statistical significance.
RESULTS
1. Patient characteristics
From December 2006 to September 2007, 197 consecutive patients were screened for eligibility and 142 patients were enrolled. Fifty-five patients were excluded: 33 because of absence of H. pylori infection, 11 with severe concomitant illness, 6 with previous H. pylori eradication therapy, and 5 with administration of acid-suppressive drugs.
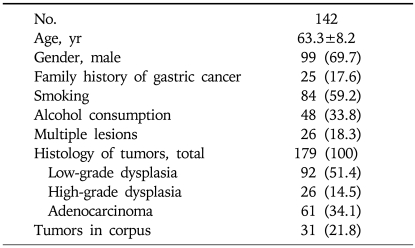
Of the screened subjects, 83.0% were sero-positive for anti-H. pylori IgG. Multiple synchronous lesions, either dysplasias or adenocarcinomas, were observed in 26 patients (18.3%): 16 had two lesions, 9 had three lesions, and 1 had four lesions. Of the 84 lesions with low-grade dysplasias on biopsy-based pathology, 16 were found to be high-grade dysplasias and 6 were adenocarcinomas on EMR pathology. Baseline characteristics of the study subjects are summarized in Table 1.
Table 1.
Baseline Characteristics of the Study Subjects
Values are presented as mean±SD or number (%).
2. Serum PG profiles according to the pattern of chronic gastritis
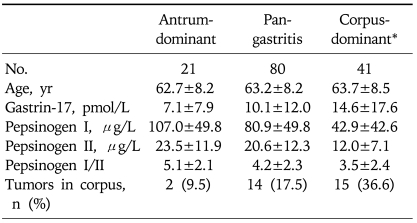
Serum concentrations of PGI and the PGI/II ratio were lower in patients with corpus-dominant gastritis (Table 2), in which mean values were 42.9µg/L PGI and a PGI/II ratio of 3.5, compared with those with antrum-dominant (PGI, 107.0±49.8µg/L, p<0.01; PGI/II, 5.1±2.1, p=0.01) or pan-gastritis (PGI, 80.9±49.8µg/L, p<0.01; PGI/II, 4.2±2.3, p=0.10). There was a step-wise decrease in PGI and PGI/II levels with progression from antrum-dominant to corpus-dominant gastritis. Tumors were located more often in the corpus in patients with corpus-dominant gastritis (36.6%) than in those with antrum- dominant gastritis (9.5%) and pan-gastritis (17.5%) (p=0.02).
Table 2.
Pepsinogen Profiles according to Histologic Pattern of Chronic Gastritis (n=142)
Continuous variables are shown as mean±SD.
*Pepsinogen I and I/II levels are lower in patients with corpus-dominant gastritis compared with those with antrum-dominant (pepsinogen I, p<0.01; pepsinogen I/II, p=0.01) or pan-gastritis (pepsinogen I, p<0.01; pepsinogen I/II, p=0.10).
3. Serum PG profiles according to histologic extent of gastric atrophy
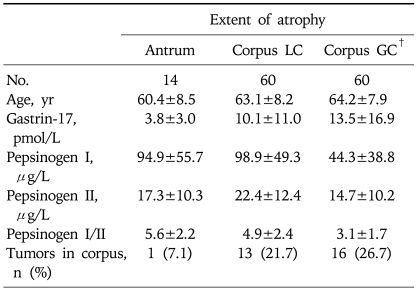
Because there were no differences in the low PGI and PGI/II levels between patients with atrophy on the lower and upper sites of the corpus GC (PGI, 51.3±34.4µg/L vs 40.6±41.0µg/L, p=0.79; PGI/II, 3.2±1.7 vs 3.0±1.8, p=0.82), we combined the two groups. Table 3 shows changes in PG profiles according to topographic extent of gastric atrophy. Serum concentrations of PGI and the PGI/II ratio were significantly lower in patients with atrophy involving the corpus GC (PGI, 44.3±38.8µg/L; PGI/II, 3.1±1.7) than in patients in whom the atrophic extent was limited to the corpus LC (PGI, 98.9±49.3µg/L; PGI/II, 4.9±2.4; both p<0.01) or antrum LC (PGI, 94.9±55.7µg/L; PGI/II, 5.6±2.2; both p<0.01). In agreement with initial assumption, most patients with atrophy on the corpus GC had atrophy on the antrum (90.0%) or corpus LC (96.7%). For corpus location of tumors, the frequency did not differ between the groups.
Table 3.
Pepsinogen Profiles according to the Topographic Extent of Gastric Atrophy (n=134)*
Continuous variables are shown as mean±SD.
LC, lesser curvature; GC, greater curvature.
*In eight patients, biopsy samples were inadequate to evaluate gastric atrophy; †Patients with corpus GC atrophy show significantly lower pepsinogen I and I/II levels than those in whom the atrophic extent was limited to the corpus LC (p<0.01) or antrum LC (p<0.01).
4. Performance of PGI and PGI/II to predict atrophy on the corpus GC
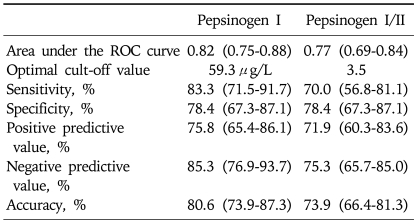
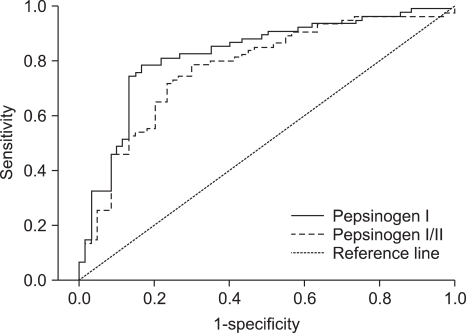
We investigated the optimal cut-off points and performance of PGI concentration and PGI/II ratio to detect the presence of atrophy on the corpus GC (Table 4, Fig. 1). We found that discriminatory ability did not differ between PGI and PGI/II values, with areas under the ROC curves of 0.82 and 0.77, respectively (p=0.24). The optimal PGI cut-off concentration was 59.3µg/L, with a sensitivity of 83.3% (95% CI, 71.5% to 91.7%) and a specificity of 78.4% (95% CI, 67.3% to 87.1%). The optimal cut-off PGI/II ratio was 3.5, with a sensitivity of 70.0% (95% CI, 56.8% to 81.1%) and a specificity of 78.4% (95% CI, 67.3% to 87.1%). The PGI concentration had positive predictive value of 75.8% (95% CI, 65.4 to 86.1), a negative predictive value of 85.3% (95% CI, 76.9 to 93.7), and an accuracy of 80.6% (95% CI, 73.9 to 87.3).
Table 4.
Usefulness of the Pepsinogen I Level and the Pepsinogen I/II Ratio in Predicting Atrophy of the Corpus Greater Curvature
Parentheses, 95% confidence intervals.
ROC, receiver-operating characteristic.
Fig. 1.
Receiver operating characteristic curves of the pepsinogen I level and pepsinogen I/II ratio for discriminating atrophy of the corpus greater curvature.
5. Association of low PGI level and PGI/II ratio with corpus location of gastric tumors
Using a level of 59.3µg/L PGI as a serologic cut-off for corpus GC atrophy, we found that 32.9% of patients with PGI <59.3µg/L and 11.1% of those with PGI ≥59.3µg/L had tumors located in the corpus part of the stomach (p=0.04). Using a cut-off of 3.5 for the PGI/II ratio, we found that 31.1% of patients with PGI/II <3.5 and 14.8% of patients with PGI/II ≥3.5 had tumors in the corpus (p=0.02). Significant differences were also observed using proposed cut-off points of 25.0µg/L for PGI (34.3% vs 17.8%; p=0.04) and a PGI/II ratio of 3 (32.7% vs 15.6%; p=0.02).18,19
DISCUSSION
In this study, low PGI and PGI/II levels are valuable serologic markers for the presence of extensive atrophy involving the corpus GC in patients undergoing EMR with early gastric tumors. The clinical implication of the low PGI and PGI/II in this patient-population is that serologic atrophy, determined by optimal PGI and PGI/II cut-offs, is associated with corpus location of early tumors.
Serum PGI concentration decreases with the progression of gastric corpus atrophy because of the loss of chief cells in the fundic glands. As the concentration of PGII remains fairly constant, the PGI/II ratio also decreases. Hence, a low PGI level and PGI/II ratio have been used in clinical practice as noninvasive functional markers for chronic corpus gastritis or atrophy.18
Discriminative abilities of PG profiles as biomarkers, however, can be affected by reference histology, biopsy protocols, and the purpose of clinical applications.20 These also depend on PG test methodologies, such as radioimmunoassay or enzyme immunoassay, and demographic factors including sex, age, smoking, drinking, and dietary habits. In addition, gastric mucosal inflammation increases secretion of PGI and PGII from the chief cells, caused by cytokines, signal mediators, or H. pylori infection.21-23 These could explain various cut-off values of serum PG profiles in different populations. For instance, in Japan, the proposed cut-off points to determine atrophy and gastric cancer risk are 70µg/L for PGI and 3.0 for PGI/II ratio.9,24 In European countries, the cut-off values are 25µg/L PGI and 3.0 PGI/II.18,19 Therefore, in use of the PG profiles as CAG markers, the performance or feasibility of low PGI concentration and PGI/II ratio should be validated by different clinical settings.
Using a biopsy protocol exploring the corpus atrophic extent in EMR patients with prolonged H. pylori infection, we found that both a low PGI and PGI/II were suitable markers for corpus-dominant chronic gastritis. A low PGI level and the PGI/II ratio were indicative of advanced atrophy involving the corpus GC, as opposed to atrophy limited to the corpus LC or antrum. In addition, our findings in an EMR patient-population suggest that the optimal cut-off values for identification of atrophy in the corpus GC are 60µg/L of PGI and 3.5 for PGI/II ratio. Although these values are comparable to those used in other populations, they should be further validated by additional population-based studies.
EMR is a widely accepted treatment modality for early-stage gastric tumors because of minimal invasiveness and good long-term survival outcomes.15,25 With the increasing use of EMR for gastric tumors, however, some EMR-related clinical issues have emerged. These include tumor location in the upper part of the stomach, tumor multiplicity, and the need for surveillance for pre-existing advanced atrophy in the remnant stomach. Since the preventive effects of H. pylori treatment on metachronous lesions depends on the degree of atrophic injury present in the surrounding remnant mucosae, reliable indicators of CAG stage are required for long-term management of these EMR patients. A low PGI and PGI/II have some clinical implications for detection of early-stage gastric tumors, given the premalignant cascade from atrophy to dysplasia and intestinal-type gastric cancer.13,26 A Finnish study reported that 89% of tumors from patients screened by a low serum PGI were dysplasias or early-stage carcinomas.19 In a Japanese study, 30 of 43 gastric cancer lesions developed in atrophic PG groups during the follow-up period, with most of these lesions being differentiated early gastric cancers, and 23 of these patients were treated by EMR.9 A Korean study also showed that patients with intestinal-type cancers had significantly lower serum PGI concentrations than did patients with diffuse-type cancers.22 These results suggest that screening by a low serum PGI level may contribute to the early detection of EMR-eligible gastric tumors.
Another important issue in diagnosing EMR-eligible early lesions is tumor location. The risk of tumor development in the upper part of the stomach is proportional to the progression of atrophic extent.13,26,27 A Finnish study demonstrated an association between tumor location and the site of atrophic gastritis, in that 80% of neoplastic lesions were located in the proximal part of the unoperated atrophic stomach.19 Further, endoscopic examination and intervention are difficult in the corpus portion because of the oblique view and the relief of the gastric folds. Our results suggest that use of a low PGI or PGI/II to predict corpus lesions would aid in endoscopic examination and minimize the likelihood of missing early tumors located in the upper part of the stomach.
In conclusion, low PGI level and PGI/II ratio are valuable markers predicting extensive atrophy involving the corpus GC. Serologic atrophy, defined by a low PGI or PGI/II, is closely associated with the corpus location of tumors in EMR patients. Further investigations of optimal cut-off points and the utility of PG profiles are required, using population-based studies.
ACKNOWLEDGEMENTS
This study was supported by a grant (No. 2007-423) from the Asan Institute for Life Sciences, Seoul, Korea.
The authors have no competing interests.
References
- 1.Suzuki H, Hibi T, Marshall BJ. Helicobacter pylori: present status and future prospects in Japan. J Gastroenterol. 2007;42:1–15. doi: 10.1007/s00535-006-1990-z. [DOI] [PMC free article] [PubMed] [Google Scholar]
- 2.Suzuki H, Iwasaki E, Hibi T. Helicobacter pylori and gastric cancer. Gastric Cancer. 2009;12:79–87. doi: 10.1007/s10120-009-0507-x. [DOI] [PubMed] [Google Scholar]
- 3.Fock KM, Talley N, Moayyedi P, et al. Asia-Pacific consensus guidelines on gastric cancer prevention. J Gastroenterol Hepatol. 2008;23:351–365. doi: 10.1111/j.1440-1746.2008.05314.x. [DOI] [PubMed] [Google Scholar]
- 4.Uemura N, Okamoto S, Yamamoto S, et al. Helicobacter pylori infection and the development of gastric cancer. N Engl J Med. 2001;345:784–789. doi: 10.1056/NEJMoa001999. [DOI] [PubMed] [Google Scholar]
- 5.Wong BC, Lam SK, Wong WM, et al. Helicobacter pylori eradication to prevent gastric cancer in a high-risk region of China: a randomized controlled trial. JAMA. 2004;291:187–194. doi: 10.1001/jama.291.2.187. [DOI] [PubMed] [Google Scholar]
- 6.Rugge M, Correa P, Dixon MF, et al. Gastric mucosal atrophy: interobserver consistency using new criteria for classification and grading. Aliment Pharmacol Ther. 2002;16:1249–1259. doi: 10.1046/j.1365-2036.2002.01301.x. [DOI] [PubMed] [Google Scholar]
- 7.Broutet N, Plebani M, Sakarovitch C, Sipponen P, Megraud F. Pepsinogen A, pepsinogen C, and gastrin as markers of atrophic chronic gastritis in European dyspeptics. Br J Cancer. 2003;88:1239–1247. doi: 10.1038/sj.bjc.6600877. [DOI] [PMC free article] [PubMed] [Google Scholar]
- 8.Korstanje A, van Eeden S, Offerhaus JA, et al. Comparison between serology and histology in the diagnosis of advanced gastric body atrophy: a study in a Dutch primary community. J Clin Gastroenterol. 2008;42:18–22. doi: 10.1097/01.mcg.0000248008.70396.90. [DOI] [PubMed] [Google Scholar]
- 9.Watabe H, Mitsushima T, Yamaji Y, et al. Predicting the development of gastric cancer from combining Helicobacter pylori antibodies and serum pepsinogen status: a prospective endoscopic cohort study. Gut. 2005;54:764–768. doi: 10.1136/gut.2004.055400. [DOI] [PMC free article] [PubMed] [Google Scholar]
- 10.Ohata H, Kitauchi S, Yoshimura N, et al. Progression of chronic atrophic gastritis associated with Helicobacter pylori infection increases risk of gastric cancer. Int J Cancer. 2004;109:138–143. doi: 10.1002/ijc.11680. [DOI] [PubMed] [Google Scholar]
- 11.Coda S, Lee SY, Gotoda T. Endoscopic mucosal resection and endoscopic submucosal dissection as treatments for early gastrointestinal cancers in Western countries. Gut Liver. 2007;1:12–21. doi: 10.5009/gnl.2007.1.1.12. [DOI] [PMC free article] [PubMed] [Google Scholar]
- 12.Park DI, Rhee PL, Kim JE, et al. Risk factors suggesting malignant transformation of gastric adenoma: univariate and multivariate analysis. Endoscopy. 2001;33:501–506. doi: 10.1055/s-2001-15089. [DOI] [PubMed] [Google Scholar]
- 13.Lauwers GY. Defining the pathologic diagnosis of metaplasia, atrophy, dysplasia, and gastric adenocarcinoma. J Clin Gastroenterol. 2003;36:S37–S43. doi: 10.1097/00004836-200305001-00007. [DOI] [PubMed] [Google Scholar]
- 14.Choi KD, Jung HY, Lee GH, et al. Application of metal hemoclips for closure of endoscopic mucosal resection-induced ulcers of the stomach to prevent delayed bleeding. Surg Endosc. 2008;22:1882–1886. doi: 10.1007/s00464-008-9743-0. [DOI] [PubMed] [Google Scholar]
- 15.Kim JJ, Lee JH, Jung HY, et al. EMR for early gastric cancer in Korea: a multicenter retrospective study. Gastrointest Endosc. 2007;66:693–700. doi: 10.1016/j.gie.2007.04.013. [DOI] [PubMed] [Google Scholar]
- 16.Graham DY, Nurgalieva ZZ, El-Zimaity HM, et al. Noninvasive versus histologic detection of gastric atrophy in a Hispanic population in North America. Clin Gastroenterol Hepatol. 2006;4:306–314. doi: 10.1016/j.cgh.2005.11.003. [DOI] [PubMed] [Google Scholar]
- 17.Ricuarte O, Gutierrez O, Cardona H, Kim JG, Graham DY, El-Zimaity HM. Atrophic gastritis in young children and adolescents. J Clin Pathol. 2005;58:1189–1193. doi: 10.1136/jcp.2005.026310. [DOI] [PMC free article] [PubMed] [Google Scholar]
- 18.Sipponen P, Graham DY. Importance of atrophic gastritis in diagnostics and prevention of gastric cancer: application of plasma biomarkers. Scand J Gastroenterol. 2007;42:2–10. doi: 10.1080/00365520600863720. [DOI] [PubMed] [Google Scholar]
- 19.Varis K, Sipponen P, Laxen F, et al. Implications of serum pepsinogen I in early endoscopic diagnosis of gastric cancer and dysplasia. Helsinki Gastritis Study Group. Scand J Gastroenterol. 2000;35:950–956. doi: 10.1080/003655200750023011. [DOI] [PubMed] [Google Scholar]
- 20.Miki K. Gastric cancer screening using the serum pepsinogen test method. Gastric Cancer. 2006;9:245–253. doi: 10.1007/s10120-006-0397-0. [DOI] [PubMed] [Google Scholar]
- 21.Fiorucci S, Distrutti E, Chiorean M, et al. Nitric oxide modulates pepsinogen secretion induced by calcium-mediated agonist in guinea pig gastric chief cells. Gastroenterology. 1995;109:1214–1223. doi: 10.1016/0016-5085(95)90581-2. [DOI] [PubMed] [Google Scholar]
- 22.Kang JM, Kim N, Yoo JY, et al. The role of serum pepsinogen and gastrin test for the detection of gastric cancer in Korea. Helicobacter. 2008;13:146–156. doi: 10.1111/j.1523-5378.2008.00592.x. [DOI] [PubMed] [Google Scholar]
- 23.Lorente S, Doiz O, Trinidad Serrano M, Castillo J, Lanas A. Helicobacter pylori stimulates pepsinogen secretion from isolated human peptic cells. Gut. 2002;50:13–18. doi: 10.1136/gut.50.1.13. [DOI] [PMC free article] [PubMed] [Google Scholar]
- 24.Miki K, Morita M, Sasajima M, Hoshina R, Kanda E, Urita Y. Usefulness of gastric cancer screening using the serum pepsinogen test method. Am J Gastroenterol. 2003;98:735–739. doi: 10.1111/j.1572-0241.2003.07410.x. [DOI] [PubMed] [Google Scholar]
- 25.Ono H, Kondo H, Gotoda T, et al. Endoscopic mucosal resection for treatment of early gastric cancer. Gut. 2001;48:225–229. doi: 10.1136/gut.48.2.225. [DOI] [PMC free article] [PubMed] [Google Scholar]
- 26.Correa P. Human gastric carcinogenesis: a multistep and multifactorial process--First American Cancer Society Award Lecture on Cancer Epidemiology and Prevention. Cancer Res. 1992;52:6735–6740. [PubMed] [Google Scholar]
- 27.El-Zimaity HM, Ota H, Graham DY, Akamatsu T, Katsuyama T. Patterns of gastric atrophy in intestinal type gastric carcinoma. Cancer. 2002;94:1428–1436. doi: 10.1002/cncr.10375. [DOI] [PubMed] [Google Scholar]


