

Abstract
Double Pulsed Field Gradient (d-PFG) MRI can provide quantitative maps of microstructural quantities and features within porous media and tissues. We propose and describe a novel MRI phantom, consisting of wafers of highly ordered glass capillary arrays (GCA), and its use to validate and calibrate a d-PFG MRI method to measure and map the local pore diameter. Specifically, we employ d-PFG Spin-Echo Filtered MRI in conjunction with a recently introduced theoretical framework, to estimate a mean pore diameter in each voxel within the imaging volume. This simulation scheme accounts for all diffusion and imaging gradients within the diffusion weighted MRI (DWI) sequence, and admits the violation of the short gradient pulse approximation. These diameter maps agree well with pore sizes measured using both optical microscopy and single PFG diffusion diffraction NMR spectroscopy using the same phantom. Pixel-by-pixel analysis shows that the local pore diameter can be mapped precisely and accurately within a specimen using d-PFG MRI.
Keywords: double, pulsed-field gradient, PFG, d-PFG, NMR, MRI, diffusion, DWI, validation, phantom, wave vector, microcapillary, array, GCA, restricted, cross-term, pore diameter
Introduction
There is a growing need for accurately measuring salient microstructural features in turbid samples and specimens non-invasively and in situ in fields ranging from materials science and oil exploration to radiology. New diffusion MRI methods can address this need and can fill an important niche in characterizing microstructures on microscopic and macroscopic length scales.
Most diffusion MRI methods employ the single pulsed field gradient (PFG) MR sequence [1] in which the spins’ net displacements are encoded using a pair of magnetic field gradient pulses, and the resulting signal attenuation profile (due to the spins dephasing during the time between those pulses) can be used to infer microstructural features or dimensions of the porous medium [2].
In biological and clinical applications, for instance, diffusion tensor MRI (DTI) [3,4] is a widely used method to obtain information about tissue anisotropy and fiber orientation. It entails acquiring PFG MRI scans obtained with multiple gradient orientations and/or gradient strengths, producing Diffusion Weighted Images (DWIs). While diffusion is assumed to be Gaussian in DTI, more explicit models of water diffusion in nerve tissues, such as those assumed in CHARMED [5] and in AxCaliber MRI [6], allow one to estimate more detailed microstructural features of neural tissue, such as their intra- and extra-axonal volumes, and the mean axon diameter, or in the case of AxCaliber, the axon diameter distribution within a single voxel.
PFG MR is effective in measuring compartment or pore dimensions in uniform, highly ordered media [7–11] from well-defined diffraction peaks they produce. However due to the inverse relationship between the pore diameter and the scattering vector, q = (2π)−1 γGδ, a large q-value (q = |q|) is required to obtain fine-scale information about pore size. Typically, such high q-values are not achievable in animals or clinical MRI scanners [12]. Generally, in biological and clinical applications, one cannot even observe the first null point of the diffraction spectrum in microporous structures owing to the high q-values needed. Furthermore, in heterogeneous porous specimens that have a polydisperse distribution of pore diameters or pore shapes[13] these diffraction peaks [14] quickly disappear. Such is also the case in neural tissue.
Double Pulsed Field Gradient (d-PFG) MRI methods, however, have the potential to overcome many of the deficiencies and limitations of PFG MRI detecting features of complex tissue microstructure, below the resolution of the MRI voxel [15–19], not detectable by PFG MRI. Multiple-PFG MR sequences are constructed by concatenating two or more PFG MR sequences. This enables one to observe or measure correlations between net displacements of spins during multiple diffusion periods, from which one can infer a number of fine-scale features. For instance, by varying the mixing time τm - the time between the PFG blocks—different microstructural parameters can be extracted. For the measurement of pore size or fiber diameter little or no mixing time is required, while for the detection of local anisotropy a long mixing time is used [15,20–23].
Previously, pore diameters in packs of beads, radish [17], spinal cord [17,24] and corticospinal tissue [25,26] have been measured using d-PFG MRI techniques. Although numerical phantoms were used in some of these studies [24,27] to ensure that reasonable pore sizes were measured, these methods and models were not validated or calibrated experimentally using well-characterized physical MRI phantom with known pore sizes. Furthermore, d-PFG MRI data are likely to suffer from bias introduced by the cross-terms from the imaging gradients themselves, and between imaging and diffusion gradients. Finally, the use of the short pulse approximation can greatly simplify the form of the model relating the MR signal decay, the d-PFG sequence and pore dimensions. However, due to the scanner limitations the MR sequences in many cases do not satisfy the short pulse approximation, complicating the analysis of the d-PFG MRI data.
In this study we used a d-PFG filtered MRI sequence (Fig. 1) to measure and map average pore diameters of new MRI phantom. We also describe the development and use of this new MRI phantom, which is suitable to calibrate and validate MRI pore mapping experiments. The phantom consists of a glass capillary array (GCA) with a known monodisperse pore diameter distribution, which was measured and cross-validated using optical light microscopy and single PFG NMR spectroscopy diffraction experiments [28]. A recently introduced theoretical framework [29] was employed for estimating pore size wherein all imaging and diffusion gradient waveforms were taken into account, and the long diffusion pulses that violate the short pulse approximation, were explicitly accounted for. A spatially resolved map of local pore diameter was then created pixel-by-pixel by analysis of the d-PFG images of this novel MRI phantom.
Figure 1.

The d-PFG MRI pulse sequence used in this study
Materials and Methods
Figures 2a and b show a photographic enlargement and microscopic image, respectively, of the GCA MRI phantom. The phantom consists of two lead glass GCA wafers (Photonis Sturbridge, MA) 13 mm OD, each containing a pack or array of microcapillaries with a nominal pore diameter of 10 μm (and a 5% maximum pore size variation between GCAs). The capillary arrays were filled with pure water using a three-step procedure. First, water vapor was adsorbed on the internal walls of the capillaries. This was achieved by exposing the GCAs to water vapor of controlled activity (isopiestic method). The water activity (relative vapor pressure) was kept below 0.95 to avoid droplet and bubble formation in the capillaries. Second, water activity was gradually increased in the vapor phase to fill the capillaries by condensation. Third, the GCA was immersed in an excess amount of water to ensure complete filling and then placed in a 15mm NMR tube (New Era Enterprises Inc., Vineland, NJ). The phantom was inserted into the magnet’s bore with the long axis of the capillaries aligned with the direction of the main magnetic field.
Figure 2.
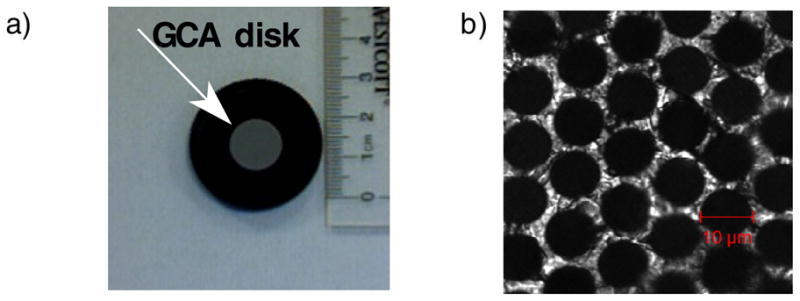
a) The glass capillary array (Photonis, Sturbridge, MA) with 13 mm disk diameter, 10μm nominal pore diameter and 500 μm thickness. b) Confocal transmission image of the GCA showing a 9.2 μm pore diameter.
The d-PFG MRI sequence used in this study consisted of two PFG spin-echo NMR blocks concatenated together, followed by a spin-echo MRI block (Fig. 1). In this implementation, the d-PFG NMR blocks can be viewed as a “filter” that selects a subset of the spins for the subsequent MRI sequence. The RF pulses used in the filter were all short hard broadband pulses in order to reduce possible additional echoes resulting from imperfect pulses, however phase cycling schemes or adiabatic rf pulses can be used if such echoes arise. The mixing time, τm, defined as the time between the two PFG blocks, was zero, which resulted in a superposition of the second gradient pulse of the first PFG block and the first gradient pulse of the second PFG block. The angle between the x PFG block, ϕ, was varied between 0° and 360° in 45° increments in the XY plane—the plane whose normal vector lies parallel to the GCA’s tubes’ axes. When the gradients in the two PFG blocks are parallel (ϕ = 0), the middle gradient pulse is doubled in strength; when the two PFG blocks are anti-parallel (ϕ = 180°) the middle gradient pulse vanishes. All other angles result in different combinations of X and Y gradients. The MRI block in this implementation consisted of two slice selective refocusing rf pulses which yields T2 weighted images with an independent TE. This block, however, is interchangeable and can be replaced with other imaging block to suit the sample requirements, (e.g., a fast imaging block for in vivo measurements).
All experiments were performed on a 7T vertical Bruker wide-bore DRX MRI system (Bruker BioSpin, Germany) equipped with a Micro2.5 microimaging probe and three GREAT60 gradient amplifiers having a nominal peak current of 60 A per channel. This configuration can produce a maximum nominal gradient strength of 24.65 mT m−1 A−1 along each of the three orthogonal directions. Sample temperature was set at 19 °C.
The sequence was first calibrated on a water sample using PFG NMR parameters: gradient pulse duration (including the gradient ramp time) (δ) = 3.15 ms, diffusion time (Δ) = 50 ms, and gradient strength (G1 = G2) = 0, 44, 74 and 103 mT m−1 resulting in q = 5.9, 9.9 and 13.8 mm−1; and MRI parameters: repetition time (TR) = 7000 ms, echo time of the imaging block (TE) = 20 ms, field of view (FOV) = 10mm and slice thickness = 2 mm. The number of averages (NA) = 2, total acquisition time was 30 minutes. Gradients stability was tested on an isotropic sample of 5 cSt of polydimethylsiloxane (PDMS), which has a diffusivity of about an order of magnitude smaller than free water. The PFG NMR parameters were: δ = 3.15 ms; Δ = 50 ms; and (G1 = G2) = 0, 74, 147, 221 and 295 mT m−1. resulting in q = 9.9, 19.8, 29.7 and 39.6 mm−1. The MRI parameters were: TR = 7000 ms; TE = 12 ms; FOV = 10 mm; and slice thickness = 1 mm. NA = 2, total acquisition time was 30 minutes
Analytical calculations were carried out for the echo attenuation, E(G1, G2,ϕ), for each ϕ used between the two PFG blocks. The expression for free isotropic diffusion is given by [18]:
| (1) |
where γ is the proton’s magnetogyric ratio and D0 is the diffusion coefficient of the solvent within the tubes. We used D0 = 1.98 × 10⁻⁹ m2 sec-1 for water at 19 °C [30].
The d-PFG MRI experiments were then performed on the GCA phantom. The PFG NMR parameters were: δ = 3.15 ms; Δ = 50 ms; and (G1 = G2) = 0, 74, 147, 221 and 295 mT m−1. resulting in q = 9.9, 19.8, 29.7 and 39.6 mm−1. The MRI parameters were: TR = 7000 ms; TE = 12 ms; FOV = 20 mm; and slice thickness = 1 mm (which covers both GCA disks). NA = 4, total acquisition time was 60 minutes. To evaluate whether the separation time (ST) between diffusion and imaging gradients affected the pore diameter estimations, experiments were performed using two different d-PFG filters having different ST, a short time of 1.3 ms and a long time of 20.8 ms. One would expect short ST to affect pore diameter estimation for restricted geometries where the last diffusion gradient would not refocus the magnetization. Therefore the spins might not loose their coherence before the imaging gradients are applied. To ensure that the imaging block did not affect the d-PFG echo attenuation, experiments were repeated with a long TE of 70ms and ST of 20.8ms. Measurements of the echo intensity were performed using a Region of Interest (ROI) in the center of the image to avoid artifacts arising from Gibbs ringing [31]. The ROIs, which were taken, included the macroscopic defects, however, those were incorporated into the free diffusion component of the simulations. To create the pore diameter maps, a pixel-by-pixel analysis was performed: each pixel’s intensity for all 38 gradient configurations (9 angles with 4 gradient strengths and 2 non-diffusion weighted MRIs) was used to estimate the pore diameter in each voxel.
To validate the d-PFG MRI results, images of the GCAs used in the phantom were taken on a Zeiss LSM 510 inverted laser-scanning microscope (Carl Zeiss, Jena, Germany). The dry phantoms were deposited in an Attofluor chamber (Invitrogen, Carlsbad, CA) with a number 1.5 coverslip at the bottom and imaged with a 20 × 0.75 NA plan-apochromat (dry) Zeiss objective in transmission mode using differential interference contrast (DIC) settings. Images were recorded at maximum resolution (2048 × 2048 pixels), which yield a spatial resolution of 0.22 μm per pixel, at zoom 1 with 3% transmission of the 488 nm laser line and no averaging. Under these conditions, the glass substrate appeared bright while the core of each capillary was dark. Accurate spatial calibration was obtained by imaging a calibrated ruler (Graticules LTD, Tonbridge, England) in both the horizontal and vertical orientation. Images were analyzed in Metamorph software (Molecular Devices, Downingtown, PA) by first calibrating in x and y, then thresholding the image to isolate the capillary cores. The images were then binarized, submitted to one cycle of erosion and dilation to remove stray pixels and measured with the Integrated Morphometry Analysis drop-in. The equivalent diameter, the diameter of a circle that would contain an area equal to that of the object, was retained as the most reliable measurement of the capillary pore size. Particles of less than 7.5 μm and more than 15 μm diameter were discarded as they represent either objects not adequately resolved by thresholding or contacting the image border. At least 10 images were recorded at different locations of each phantom, and the results averaged.
PFG NMR diffusion-diffraction experiments were also performed on the same GCA phantom. These were conducted using a stimulated echo (STE) PFG NMR sequence with the following parameters: δ = 4 ms, Δ = 250 ms and 32 q-values were collected with Gmax = 1200 mT m−1, resulting in a qmax of 204.3 mm−1.
To examine and interpret our experimental data and provide a method to infer or estimate pore size from both PFG NMR and d-PFG MRI experiments, we employed a matrix operator formalism to predict E(q,ϕ) (where q = γGδ/(2π)) for diffusion within a restricted cylinder. Our method generalizes and extends previous work to model the effects of long diffusion gradient pulses on E(q) data obtained in PFG NMR experiments in various well defined restricted geometries (e.g., within spheres, cylinders, and between parallel plates). To this end, Caprihan, et al.(27) and Callaghan (28) approximated an arbitrary gradient waveform by a train of impulses leading to the multiple propagator approach. An alternative and computationally efficient approach involves expressing a general gradient waveform as a series of step functions, as was done in Refs. [32,33]. However, these works have assumed that the gradient orientation remained fixed throughout the acquisition, which is clearly violated in the general d-PFG acquisitions and in all MRI sequences. To circumvent this shortcoming, Özarslan et al. recently introduced a general framework that accounts for the variations in the gradient orientation [29]., in which each pulse of the sequence was represented with a vector operator whose components were infinite-dimensional matrices. An operator obtained by exponentiating the corresponding matrix expresses the effect of each interval in the pulse sequence on the magnetization. This approach enables one to write, with relative ease, an analytical expression for the MR signal intensity, which is exact for piecewise continuous gradient waveforms, and can be used to obtain a very good approximation for other pulse sequences. The details of the approach is outside the scope of this paper, and can be found in [29]. In this work, we employed this technique by, respectively, incorporating and ignoring the imaging gradients of the d-PFG NMR filtered pulse sequence illustrated in Figure 1. The presence of a small free water compartment was also incorporated in these calculations [18,28].
Results
Figure 2b shows a typical confocal transmission image of a small FOV of a GCA. Measurements of the two GCA wafers that we used to construct the phantom yielded pore diameter of 9.5 ± 0.2 μm and 9.4 μm ± 0.2 μm.
The first model system we used to test our d-PFG MRI was an isotropic water sample. Figure 3a shows d-PFG MRI images of water for the nine different ϕ using a gradient strength of 44 mT m−1 (where artifacts originating from RF inhomogeniety were expected). All images were free of any observable systematic artifacts or distortion. The SNR ranged from 41 for G = 0 to 10 for G = 103 mT m−1. Figure 3b shows the echo attenuation of the water at ϕ = 180 vs. the b-value, b = (2π)2q2(2Δ−δ/3). The diffusion coefficient for free water that was calculated from that fit (D0 = 1.97 × 10⁻⁹ m2 sec−1) agreed with the value used in the simulations (D0 = 1.98 × 10⁻⁹ m2 sec−1). Figure 3c shows the measured echo attenuation data, E(q,ϕ) vs. ϕ, (for G = 44, 74 and 103 mT m−1, corresponding to q = 5.9, 9.9 and 13.8 mm−1). Superposed are predictions of E(q,ϕ) vs ϕ assuming free diffusion obtained using Equation 1. Agreement between the experimental data and theory was excellent. As expected, for free isotropic (Gaussian) diffusion, a slight angular dependence of E(q,ϕ) is observed. Also, as expected, as gradient strength or q was increased, signal attenuation increased. No observable artifacts were detected in the PDMS sample at all gradient strengths and E(q,ϕ) vs. ϕ curves agreed with the analytical calculations predicated by Equation 1 (data not shown).
Figure 3.

a) d-PFG MRI images of free water using δ =3.15 ms, Δ = 50 ms and G = 44 mT m−1. The angle between the gradient directions of each PFG block is specified in the left corner of each image. b) experiments and simulations of the corresponding echo attenuations vs. ϕ for G = 0, 44, 74 and 103 mT m−1. c) echo attenuation at ϕ = 180 vs. b = (2π)2q(Δ−δ/3) (mm−1).
Next we applied our d-PFG MRI sequence to the GCA phantom. Figure 4 shows d-PFG MRI data of the GCA for all nine ϕ for G = 295 mT m−1. All images taken with the phantom were also free of observable artifacts. The dark streaks visible across the disk are macroscopic defects, which were also visible on spin and gradient-echo MRI scans (data not shown).
Figure 4.

d-PFG MRI images of the GCA phantom using δ =3.15 ms, Δ = 50 ms and G = 295 mT m−1. The angle between the gradient directions of each PFG block is specified in the left corner of each image.
Figure 5 shows experimental and simulated data superposed for all gradient strengths and ϕ values used in this study. Specifically, Figures 5a, b, and c show the data and fits for the various combinations of short and long STs, and TEs (ST=1.3 ms TE=12 ms, ST=20.8 ms TE=12 ms and ST=20.8 ms TE=70 ms) experiments, respectively. The simulations based on the theory fitted the experimental data very well.
Figure 5.

experimental and simulations of the corresponding echo attenuations vs. ϕ for G = 0, 44, 74 and 103 mT m−1. a) TE = 12 ms and ST = 1.3 ms b) TE = 12 ms and ST = 20.8 ms c) TE = 70 ms and ST = 20.8 ms.
Figures 6a–c show pore diameter maps for short ST and short TE, long ST and short TE, and long ST and long ST experiments, respectively; Figure 6d-f show maps of the corresponding standard deviations for each pore diameter map. The images appear very similar to the d-PFG MRI data presented in Figure 4 and preserve all “anatomical” features of the sample. The uniform intensity throughout the image demonstrates a tight pore size distribution across the phantom. The standard deviation maps demonstrate the agreement between the theory and experimental data throughout the specimen.
Figure 6.

Pore diameter map constructed from the d-PFG MRI data. a) TE = 12 ms and ST = 1.3 ms b) TE = 12 ms and ST = 20.8 ms c) TE = 70 ms and ST = 20.8 ms and d-f) show the corresponding standard deviations.
Table 1 summarizes the pore diameter measurements corresponding to the three cases considered in Figure 5 using three models: one in which the narrow gradient pulse regime was assumed, one which took into account all cross terms and experimental parameters, and one that neglected the cross-term effects between diffusion and imaging gradients. The table presents the pore diameter estimations for all diffusion gradient strengths, which consists of 38 data points in each simulation. The estimations based on the narrow pulse approximation yielded a considerably smaller pore diameter than the other two models (owing to motional narrowing[34]), which were very close to each other and within experimental error. However, a closer examination showed a small difference between the values determined by a model that took into account all imaging and diffusion gradients and one that neglected all imaging gradients for the shortest ST of 1.3 ms (Figure 5a). For longer ST of 20.8 ms (Figure 5b-c) there was no difference between the pore diameter values resulting from the simulations with and without incorporating the imaging gradients. In general one would consider the difference in pore diameter resulting from the short ST experiment (Figure 5a) negligible as it is indeed within the experimental error of both our “golden standard” and the simulations. There is no way of telling which of the simulations is closer to the physical pore diameter, however, the small difference in those two simulations confirms that even when diffusion and imaging blocks are separated, if ST is shorter than the characteristic time it take the spins to sample the pore (a2/D0, where a is the pore radius), imaging gradients should be incorporated into the simulations. This finding highlights the need to include all gradients appearing in the MRI sequence to obtain an accurate pore diameter estimate. This principle can be applied to any imaging block concatenated to the d-PFG NMR block as long as those two block STs are sufficiently long the imaging gradient will not play a roll in pore diameter determination.
Table 1.
Pore diameter estimates of the GCA, all gradient strengths used in the experiment were incorporated into the simulations.
| d (μm) | diffusion only | diffusion + imaging | narrow pulse approx |
|---|---|---|---|
| short ST short TE | 9.44 ± 0.03 | 9.41 ± 0.03 | 7.00 ± 0.05 |
| long ST short TE | 9.45 ± 0.02 | 9.45 ± 0.02 | 7.00 ± 0.04 |
| long ST long TE | 9.47 ± 0.02 | 9.47 ± 0.02 | 7.05 ±0.06 |
Since in the GCA phantom, the capillaries are coherently organized, and monodisperse, and the GCA wafers themselves appear to be macroscopically homogeneous; diffusion-diffraction MR can be used as another way to measure pore diameter accurately. To further validate the findings from d-PFG filtered MRI we performed the diffusion-diffraction PFG measurements. Figure 7 shows E vs. q plot for the PFG NMR experiment conducted in the direction perpendicular to the main axis of the GCA phantom’s pores. The diffraction minimum can be observed around q=152 mm−1. It should be noted that a very similar signal decay manifesting a diffusion-diffraction minimum was observed in the y-direction (data not shown).
Figure 7.

experiments and simulations of the echo attenuations vs. q for the PFG experiment using δ = 4 ms, Δ = 250 ms and Gmax = 1200 mT m−1
The corresponding theoretical fit (solid line) for the E(q) data in the x-direction is superposed on the experimental points (symbols). Agreement is excellent. The pore diameter estimated from this diffraction pattern is 9.35μm ± 0.05μm. This provides another means to cross-validate the diameter measurements obtained using d-PFG MR methods.
Discussion
The pore diameter estimates obtained from the d-PFG MRI experiments agree with those measured using light microscopy and PFG NMR experiments. This supports the claim that d-PFG MRI can provide accurate and precise estimates of pore diameter, albeit at a coarser length scale than optical microscopy. While optical microscopy here serves as a “gold standard” for comparing and contrasting our NMR and MRI findings, it is only viable when specimens are transparent, small, and thin. For materials that are optically turbid, thick or need to be studied at a large field of view (FOV), optical imaging methods become problematic. Since living biological tissue, and particularly human tissues and organs of interest are generally optically turbid, deep within the body, and large compared to an optical pixel or voxel, in vivo diffusion MRI microscopy remains the method of choice to perform in situ or in vivo histology.
Making d-PFG MRI quantitative, reproducible, and reliable requires that we ensure the integrity of our entire experimental and theoretical “pipeline.” In our case, this pipeline consists of novel filtered d-PFG MRI sequences, a general matrix operator-based mathematical modeling framework that predicts the signal attenuation produced by a d-PFG MRI pulse sequence in a restricted geometry, an efficient d-PFG MRI experimental design, MR data acquisition, and the estimation of microstructural features, like the local pore diameter, from this MRI data. Without a viable NMR and MRI phantom, validation of this pipeline is not possible, nor would one be possible to calibrate this experiment routinely for quality assurance purposes.
The GCA phantom used in this study is extremely appealing for a broad range of MRI applications since it consists of fused tubes where a substantial volume of each disk contains fluid. In the 10μm pore diameter phantom used in this study for example the center distance between adjacent pores is only 12 μm. This arrangement provides greater pore volumes and thus, much more MR signal than an NMR phantom we have used previously, consisting of a pack of glass capillary tubes (Polymicro) in which pore volume represents only a very small fraction of the entire phantom volume. This additional signal might not be needed for NMR spectroscopy studies such as d-PFG NMR where using the same theoretical pipeline yielded accurate estimations of pore diameters at low q-values [13,35–37], however, it is essential to boost SNR in diffusion MRI experiments.
Since GCA wafers are available in various pore sizes and outer diameters, and are readily stacked or sandwiched together into more complex arrangements, we can, in principle, construct phantoms having a distribution of known pore sizes within individual voxels, which would be useful, for instance, in calibrating AxCaliber MRI [6].
The ultimate goal of this work is to develop and advance MRI methods for elucidating biologically and clinically important microstructural features in living tissue. Looking forward, as we begin to scan heterogeneous samples, including more complex phantoms, fixed and living tissues like skeletal muscle, spinal cord, and bundles of nerve axons all of whose diameter distributions may be spatially varying, we can expect the d-PFG MRI to yield quantitative maps that provide microstructural information that cannot be obtained by using other imaging methods.
Summary
D-PFG MRI is a powerful tool for determining a variety of new and useful microstructural features within each voxel, which can be mapped or displayed in an imaging volume. We have successfully demonstrated that d-PFG-filtered MRI can measure and map the pore diameter in a novel glass capillary array phantom quantitatively. We also describe the development and use of a novel MRI phantom for calibrating and validating MRI measurements of pore diameter and diameter distribution.
Research Highlights.
D-PFG MRI can determine a variety of microstructural features within each voxel.
A novel glass capillary array (GCA) phantom was developed
Using d-PFG MRI and a novel theoretical framework GCA pore diameter was measured.
A pore diameter map of the GCA phantom was obtained.
Acknowledgments
This work was supported by the Intramural Research Program of the Eunice Kennedy Shriver National Institute of Child Health and Human Development. Optical imaging studies were performed in the NICHD Microscopy & Imaging Core. Support for this work included funding from the Center for Neuroscience and Regenerative Medicine (CNRM) and the Henry Jackson Foundation (HJF).
Footnotes
Publisher's Disclaimer: This is a PDF file of an unedited manuscript that has been accepted for publication. As a service to our customers we are providing this early version of the manuscript. The manuscript will undergo copyediting, typesetting, and review of the resulting proof before it is published in its final citable form. Please note that during the production process errors may be discovered which could affect the content, and all legal disclaimers that apply to the journal pertain.
References
- 1.Stejskal EO, Tanner JE. Spin diffusion measurement: spin echo in the presence of time-dependent field gradient. J Chem Phys. 1965;42:288–292. [Google Scholar]
- 2.Callaghan PT. Principles of nuclear magnetic resonance microscopy. Oxford University press inc; 1991. [Google Scholar]
- 3.Basser PJ, Mattiello J, LeBihan D. MR diffusion tensor spectroscopy and imaging. Biophys J. 1994;66:259–267. doi: 10.1016/S0006-3495(94)80775-1. [DOI] [PMC free article] [PubMed] [Google Scholar]
- 4.Basser PJ, Mattiello J, LeBihan D. estimation of the effective self-diffusion tensor from the NMR spin echo. J Magn Reson B. 1994;103:247–254. doi: 10.1006/jmrb.1994.1037. [DOI] [PubMed] [Google Scholar]
- 5.Assaf Y, Freidlin RZ, Rohde GK, Basser PJ. New modeling and experimental framework to characterize hindered and restricted water diffusion in brain white matter. Magn Reson Med. 2004;52:965–978. doi: 10.1002/mrm.20274. [DOI] [PubMed] [Google Scholar]
- 6.Assaf Y, Blumenfeld-Katzir T, Yovel Y, Basser PJ. AxCaliber: a method for measuring axon diameter distribution from diffusion MRI. Magn Reson Med. 2008;59:1347–1354. doi: 10.1002/mrm.21577. [DOI] [PMC free article] [PubMed] [Google Scholar]
- 7.Callaghan PT, Coy A, MacGowan D, Packer KJ, Zelaya FO. Diffraction-like effects in NMR diffusion studies of fluids in porus solids. Nature. 1991;351:467–351. [Google Scholar]
- 8.Coy A, Callaghan PT. Pulsed gradient spin-echo NMR “diffusion diffraction” experiments on water surrounding close-packed polymer spheres. J Colloid Interface Sci. 1994;168:373–379. [Google Scholar]
- 9.Avram L, Ozarslan E, Assaf Y, Bar-Shir A, Cohen Y, Basser PJ. Three-dimension water diffusion in impermeable cylindrical tube: theory versus experiments. NMR Biomed. 2008;21:888–898. doi: 10.1002/nbm.1277. [DOI] [PMC free article] [PubMed] [Google Scholar]
- 10.Avram L, Assaf Y, Cohen Y. The effect of rotational angle and experimental parameters on the diffraction patterns and micro-structural information obtained from q-space diffusion NMR: implication for diffusion in white matter fibers. J Magn Reson. 2004;169:30–38. doi: 10.1016/j.jmr.2004.03.020. [DOI] [PubMed] [Google Scholar]
- 11.Kuchel PW, Coy A, Stilbs P. NMR “diffusion-diffruction” of water revealing alignment of erythrocytes in a magnetic field and their dimensions and membrane transport characteristics. Magn Reson Med. 1997;37:637–643. doi: 10.1002/mrm.1910370502. [DOI] [PubMed] [Google Scholar]
- 12.Ong HH, Wright AC, Wehrli SL, Souza A, Schwartz ED, Hwang SN, Wehrli FW. Indirect measurement of regional axon diameter in excised mouse spinal cord with q-space imaging: simulation and experimental studies. NeuroImage. 2008;40:1619–1632. doi: 10.1016/j.neuroimage.2008.01.017. [DOI] [PMC free article] [PubMed] [Google Scholar]
- 13.Shemesh N, Ozarslan E, Basser PJ, Cohen Y. Detecting diffusion-diffraction pattern in size distribution phantoms using double-pulsed field gradient NMR: theory and experiments. J Chem Phys. 2010;132:034703. doi: 10.1063/1.3285299. [DOI] [PMC free article] [PubMed] [Google Scholar]
- 14.Codd SL, Callaghan PT. Spin echo analysis of restricted diffusion under generalized gradient waveforms: planar, cylindrical, and spherical pores with wall relaxivity. J Magn Reson. 1999;137:358–372. doi: 10.1006/jmre.1998.1679. [DOI] [PubMed] [Google Scholar]
- 15.Mitra PP. Multiple wave-vector extension of the NMR pulsed-field-gradient spin-echo diffusion measurement. Phys Rev B. 1995;51:15074–15078. doi: 10.1103/physrevb.51.15074. [DOI] [PubMed] [Google Scholar]
- 16.Komlosh ME, Lizak MJ, Horkay F, Freidlin RZ, Basser PJ. Observation of microscopic diffusion anisotropy in the spinal cord using double-pulsed gradient spin echo MRI. Magn Reson Med. 2008;59:803–809. doi: 10.1002/mrm.21528. [DOI] [PubMed] [Google Scholar]
- 17.Koch MA, Finsterbusch J. Compartment size estimation with double wave vector diffusion-weighted imaging. Magn Reson Med. 2008;60:90–101. doi: 10.1002/mrm.21514. [DOI] [PubMed] [Google Scholar]
- 18.Ozarslan E, Basser PJ. Microscopic anisotropy revealed by NMR double pulsed field gradient experiments with arbitrary timing parameters. J Chem Phys. 2008;128:154511. doi: 10.1063/1.2905765. [DOI] [PMC free article] [PubMed] [Google Scholar]
- 19.Ozarslan E, Basser PJ. MR diffusion-“diffraction” phenomenon in multi-pulse-field-gradient experiments. J Magn Reson. 2007;188:285–294. doi: 10.1016/j.jmr.2007.08.002. [DOI] [PMC free article] [PubMed] [Google Scholar]
- 20.Cheng Y, Cory DG. Multiple scattering by NMR. J Am Chem Soc. 1999;121:7935–7936. [Google Scholar]
- 21.Callaghan PT, Komlosh ME. Locally anisotropic motion in a macroscopically isotropic system: displacement correlation measured using double pulsed gradient spin-echo NMR. Magn Reson Chem. 2002;40:S15–S19. [Google Scholar]
- 22.Komlosh ME, Horkay F, Freidlin RZ, Nevo U, Assaf Y, Basser PJ. Detection of microscopic anisotropy in gray matter and in novel tissue phantom using double Pulsed Gradient Spin Echo MR. J Magn Reson. 2007;189:38–45. doi: 10.1016/j.jmr.2007.07.003. [DOI] [PubMed] [Google Scholar]
- 23.Ozarslan E. Compartment shape anisotropy (CSA) revealed by double pulsed field gradient MR. J Magn Reson. 2009;199:56–67. doi: 10.1016/j.jmr.2009.04.002. [DOI] [PMC free article] [PubMed] [Google Scholar]
- 24.Weber T, Ziener CH, Kampf T, Herold V, Bauer WR, Jakob PM. Measurements of apparent cell radii using a multiple wave vector diffusion experiment. Magn Reson Med. 2009;61:1001–1006. doi: 10.1002/mrm.21848. [DOI] [PubMed] [Google Scholar]
- 25.Koch MA, Finsterbusch J. Double wave vector weighting in the human corticospinal tract in vivo. Proc Intl Soc Mag Reson Med. 2008;16:764. [Google Scholar]
- 26.Koch MA, Finsterbusch J. Trace weighting in double wave vector diffusion experiments in vivo. Proc Intl Soc Mag Reson Med. 2009;17:1362. [Google Scholar]
- 27.Koch MA, Finsterbusch J. Numerical simulation of double-wave vector experiments investigating diffusion in randomly oriented ellipsoidal pores. Magn Reson Med. 2009;62:247–254. doi: 10.1002/mrm.21976. [DOI] [PubMed] [Google Scholar]
- 28.Shemesh N, Ozarslan E, Bar-Shir A, Basser PJ, Cohen Y. Observation of restricted diffusion in the presence of a free diffusion compartment: single- and double- PFG experiments. J Magn Reson. 2009;200:214–225. doi: 10.1016/j.jmr.2009.07.005. [DOI] [PMC free article] [PubMed] [Google Scholar]
- 29.Ozarslan E, Shemesh N, Basser PJ. A general framework to quantify the effect of restricted diffusion on the NMR signal with applications to double pulsed field gradient NMR experiments. J Chem Phys. 2009;130:104702. doi: 10.1063/1.3082078. [DOI] [PMC free article] [PubMed] [Google Scholar]
- 30.Mills R. Self -diffusion in normal and heavy water in range 1–45 deg. J Phys Chem. 1973;77:685–688. [Google Scholar]
- 31.Haacke EM, Brown RW, Thompson MR, Venkatesan R. Magnetic resonance imaging: physical principles and sequence design. John Wiley & Sons, Inc; New York: 1999. [Google Scholar]
- 32.Robertson B. Spin-echo decay of spins diffusing in a bounded region. Phys Rev. 1966;151:273–277. [Google Scholar]
- 33.Grebenkov DS. NMR survey of reflected Brownian motion. Rev Mod Phys. 2007;79:1077–1137. [Google Scholar]
- 34.Mitra PP, Halperin BI. Effects of finite gradient-pulse widths in pulsed-field-gradient diffusion measurements. J Magn Reson. 1995;113 A:94–101. [Google Scholar]
- 35.Shemesh N, Ozarslan E, Basser PJ, Cohen Y. Measuring small compartmental dimensions using with low-q angular double-PGSE NMR: the effect of experimental parameters on signal decay. J Magn Reson. 2008;198:15–23. doi: 10.1016/j.jmr.2009.01.004. [DOI] [PubMed] [Google Scholar]
- 36.Shemesh N, Cohen Y. The effect of experimental parameters on the signal decay in double-PGSE experiments: Negative diffractions and enhancement of structural information. J Magn Reson. 2008;195:153–161. doi: 10.1016/j.jmr.2008.09.006. [DOI] [PubMed] [Google Scholar]
- 37.Shemesh N, Ozarslan E, Basser PJ, Cohen Y. Noninvasive double-pulsed-field-gradient NMR reveals signatures for pore size and shape in polydisperse, randomly oriented, inhomogeneous porous media. J Chem Phys. 2010 doi: 10.1063/1.345431. Accepted for publication. [DOI] [PMC free article] [PubMed] [Google Scholar]