

Abstract
Background
Although it has been argued that frontal electroencephalographic (EEG) asymmetry at rest may be a risk marker for major depressive disorder (MDD), it is unclear whether a pattern of relatively less left than right activity characterizes depressed individuals during emotional challenges. Examination of frontal asymmetry during emotion task manipulations could provide an assessment of the function of systems relevant for MDD, and test the limits of frontal EEG asymmetry as a marker of risk for depression.
Methods
EEG data were assessed during a facial emotion task, wherein 306 individuals age 18–34 (31% male) with (n =143) and without (n = 163) DSM-IV defined lifetime MDD made directed facial actions of approach (angry and happy) and withdrawal (afraid and sad) expressions.
Results
Lifetime depressed individuals displayed less relative left frontal activity than never-depressed individuals during all facial expressions across four EEG reference montages, findings that were not due to emotional experience, facial expression quality, electromyographic (EMG) activity, or current depression status.
Limitations
Although this was a sizable sample, only one emotion task was utilized.
Conclusions
Results provide further support for frontal EEG asymmetry as a risk marker for MDD.
Keywords: EEG asymmetry, depression, biological marker, emotion
A considerable literature has examined the central roles motivational systems and associated brain mechanisms play in the emotional experience and expression of depressed individuals. Researchers have advanced the position that a behavioral activation system supports positive emotions, responds to rewarding stimuli, and leads to approach behavior and active avoidance, whereas a behavioral inhibition system underlies anxiety, responds to punishing stimuli, and leads to inhibition of action, passive avoidance, and heightened arousal (Gray, 1982, 1987; Gray & McNaughton, 1996). Individual differences in frontal brain asymmetry may be thought of as a diathesis that biases one’s affective style and that may influence vulnerability to develop depression (Davidson, 1998). A model of affective style asserts that individuals have a predisposition to respond with emotions linked to an approach system (reflected as relatively higher left than right frontal activity) or a withdrawal system (reflected as relatively higher right than left frontal activity) across many contexts (Davidson, 1992, 1998), and resting electroencephalogram (EEG) research has provided some support for this model (e.g., Coan & Allen, 2003; Harmon-Jones & Allen, 1997; Shackman et al., 2009a).
Depressed individuals tend to display a pattern of relatively less left than right resting frontal activity (inferred by relatively more left than right alpha band activity; see Allen et al., 2004a), which is thought to index reduced approach motivation and sensitivity to reward (Davidson et al., 2002). This pattern distinguishes individuals who are currently depressed or euthymic with a past history of depression from never-depressed individuals (e.g., Allen et al., 2004b; Gotlib et al., 1998; Henriques & Davidson, 1990, 1991; Stewart, et al., in press-a), suggesting that prefrontal brain asymmetry may tap a diathesis toward the development of depression (Allen et al., 2004b; Thibodeau et al., 2006).
Some research, however, has failed to confirm a link between resting left frontal EEG hypoactivity and depression (e.g., Bruder et al., 1997; Metzger et al., 2004; Reid et al., 1998), and inconsistencies may be due to methodological differences across laboratories (for discussions see Hagemann et al., 2002; Stewart et al., in press-a), but may also reflect that depression-related differences in frontal brain activity may be better revealed under conditions of emotional challenge (Coan et al. 2006). EEG asymmetry linked to state emotion tasks can replicate patterns of relationships between resting EEG asymmetry and approach and withdrawal motivation, but with larger effect sizes due to the elimination of uncontrolled variance evident during resting sessions (Coan et al., 2006).
The small literature examining EEG asymmetry and state emotion challenges in dysphoric populations conveys that depressed individuals may exhibit relatively less left than right frontal activity in response to emotional challenges. For example, higher depression symptom scores have been linked to lower relative left frontal activity during approach-related paradigms involving anger provocation (Harmon-Jones et al., 2002) and reward (Shankman et al., 2007). In addition, a study that examined group differences within the right hemisphere found that depressed individuals displayed higher right frontal activity compared to control participants during a withdrawal-related challenge involving active listening and memory recall in response to a sad narrative (Nitschke et al., 2004). Furthermore, a recent fMRI study demonstrated that depressed individuals exhibited higher right, but not left, dorsolateral prefrontal cortex activity than control participants in response to unpleasant words during an emotion-word Stroop task (Herrington et al., in press). These studies, however, do not address the question of whether individual differences in activity during such states is related to a lifetime history of depression independent of current depression, but instead focus on task-related changes as a function of current depression status or symptomatology. Moreover, although some state emotion studies carefully controlled for comorbid anxiety in their depressed samples (e.g., Herrington et al., in press; Nitschke et al., 2004), others did not (e.g., Harmon-Jones et al., 2002; Shankman et al., 2007); failing to control for anxiety could be problematic, since types of pure and comorbid anxiety may be associated with different patterns of brain asymmetry than those displayed by individuals with non-anxious depression (Heller & Nitschke, 1998). Finally, although some resting EEG research has demonstrated that the relationship between depression and relatively less left frontal activity is more consistent in women than men (e.g., Miller et al., 2002; Stewart et al., in press-a), state emotion studies of depression have not examined sex differences in frontal asymmetry, suggesting that further research is needed to explore sex differences in emotional responding as a function of depression status.
To address the question of whether EEG asymmetry in response to emotional challenge is associated with lifetime history of depression, the Directed Facial Action (DFA) task was used, wherein participants were required to move their facial muscles into configurations that represent approach-related emotions of anger and happiness, and withdrawal-related emotions of fear and sadness (Coan et al., 2001). A facial expression task was selected since state manipulations involving facial expressions have provided some of the most robust changes in EEG asymmetry in healthy participants (e.g., Coan et al., 2001; Davidson et al., 1990; Ekman & Davidson, 1992; Fox & Davidson, 1988). To reduce potential heterogeneity of depression, depressed participants included in the study met DSM-IV criteria for lifetime major depressive disorder (MDD) and endorsed no comorbid Axis I disorders with the exception of current dysthymia. Current MDD status was also examined to determine whether EEG asymmetry findings were simply due to currently elevated levels of depressive symptoms. EEG was recorded during the DFA task on four separate days within a two-week period to obtain reliable measures of EEG asymmetry for each participant.
The examination of individuals with and without a lifetime history of depression in conjunction with the DFA task provided for a test of three hypotheses. First, it was predicted that individuals with a lifetime history of depression will display lower relative left frontal activity than never-depressed individuals across approach- and withdrawal-related facial expressions, consistent with the available state EEG asymmetry literature. Second, despite shared variance between EEG and electromyographic (EMG) activity, it is predicted that to the extent that EMG is present, EMG asymmetry will not account for the overall pattern of EEG asymmetry differences between depressed and non-depressed groups, consistent with prior research (Coan et al., 2001). This hypothesis is motivated from the fact that EMG activity due to facial muscle movements is prominent during the DFA task (Coan et al., 2001) and could contaminate patterns of EEG alpha asymmetry. The third hypothesis was that individual differences in patterns of frontal EEG asymmetry would not be due to the quality of the facial expressions participants produced, nor emotions experienced for each facial expression, consistent with previous work employing the DFA task (Coan et al., 2001).
Method
Participants
A total of 306 participants (95 male, 73% Caucasian; also reported in Stewart et al., in press-a, in press-b) with an age range of 17 to 34 years (M = 19.1, SE = 0.1) were enrolled in the study from a possible pool of over 10,000 individuals on the basis of their scores on the Beck Depression Inventory (BDI; Beck et al., 1961) completed during pre-testing in a large introductory psychology course or online after learning about the study from a flier or referral source. Individuals participated in a phone screening session administered by a post-bachelors project manager to screen for preliminary inclusion and exclusion criteria. To be eligible, individuals were required to be strongly right-handed (a score greater than 35 on the 39 point scale of Chapman & Chapman, 1987) and to report no history of: head injury with loss of consciousness greater than 10 minutes, concussion, epilepsy, electroshock therapy, use of current psychotropic medications, and active suicidal potential necessitating immediate treatment (although participation in current psychotherapy was allowed). Those passing this brief phone screen were invited for an intake interview, administered by a trained graduate clinical rater. Figure 1 provides a detailed flow chart summarizing study recruitment over a four-year period. Individuals were enrolled in the study if the Structured Clinical Interview for DSM-IV (SCID, First et al., 1997) indicated that they did not meet criteria for any DSM-IV Axis I disorder other than lifetime MDD and comorbid current dysthymia. The lifetime MDD+ group was further separated into a current MDD+ group (consisting of all participants with current MDD, regardless of past MDD status) and a past MDD+ group (consisting of participants with past MDD but not current MDD or current dysthymia) to examine whether any lifetime MDD effects were due to current symptoms (indicating a state, not a trait depression effect). Table 1 lists DSM-IV diagnoses for this sample.
Figure 1.

Flowchart of Participant screening and enrollment.
Table 1.
DSM-IV Diagnoses Endorsed In Lifetime MDD+ Group (N = 143)
| Diagnosis | Biological Sex | Frequency |
|---|---|---|
| Current MDD only | Men | 5 |
| Women | 9 | |
| Past MDD only | Men | 20 |
| Women | 55 | |
| Current MDD and Past MDD | Men | 10 |
| Women | 29 | |
| Current MDD and Current Dysthymia | Men | 0 |
| Women | 2 | |
| Past MDD and Current Dysthymia | Men | 1 |
| Women | 5 | |
| Current MDD, Past MDD, and Current Dysthymia | Men | 3 |
| Women | 4 |
Procedure and Task Parameters
The DFA task and two resting EEG sessions were completed each visit, on 4 separate days with no fewer then 24 hours between visits, and with all 4 visits completed within a 14 day period (such that the fourth day is not more then 14 days after the first day)1. Data for the resting EEG sessions were reported in Bismark et al., 2010, Stewart et al., in press-a, and Stewart et al., in press-b, and as a result, will not be discussed here. Participants were seated in a sound-attenuated room, separate from the experimenter.
The Directed Facial Action task (DFA task; see Coan et al., 2001 and Levenson et al., 1990) was performed by participants in between the first and second resting EEG session. Facial movements described below are numbered according to the Facial Action Coding System (FACS; Ekman & Friesen, 1978). Individual facial movements are referred to as action units (AU) in FACS. Four facial expressions were performed, representing the following emotions: anger (AUs 4 + 5 + 7 + 23/24), fear (AUs 1 + 2 + 4 + 5 + 15 + 20), happiness (AUs 6 + 12 + 25), and sadness (AUs 1 + 6 + 15 + 17). Facial expressions were each held for 1 minute, during which time EEG was recorded. The experimenter communicated with participants via microphone regarding how to make each facial movement, and participants’ faces were closely observed via video monitor to ensure that each facial movement was performed correctly. Participants had no visual feedback, and auditory feedback consisted of describing the intended facial movement again (e.g., “raise your upper eyelid”). Two FACS-trained (but not FACS certified) observers rated each participants’ facial expression performance on a 7-point scale (1 = no target facial movements achieved; 7 = target facial movements prototypic).2 Mean levels of task quality across raters and days were: anger M =3.9, SE = .03; fear M = 4.5, SE = .04; happy M = 4.3, SE = .03; sad M = 3.8, SE = .03. Intraclass correlation coefficients (ICCs) of agreement between the two independent raters across participants and days ranged from .71 to .78. Immediately following each 1-minute facial expression sequence, participants were asked while making that particular face, how angry, afraid, happy, or sad they felt on a scale of 1 to 7 (1 = no experience at all; 7 = intense experience).
EEG Data Collection and Reduction
EEG data were collected from 64-channels along with two electrooculogram (EOG) channels (vertical: superior and inferior orbit of the left eye; lateral: outer canthi). All impedances were under 10K Ohms. Data were collected using 1000 Hz sampling rate, amplified 2816 times, and filtered with 200Hz low pass filter prior to digitization. EEG data were acquired with an online reference site immediately posterior to Cz and subsequently re-referenced offline to four references: the average of all EEG leads (AVG), current source density (CSD; using algorithms from Kayser & Tenke, 2006, and based on the spherical spline approach summarized by Perrin et al., 1989, 1990), Cz, and averaged (“linked”) mastoids (LM).
After acquisition, each data file was visually inspected to remove epochs with movement and signal discontinuities, following which a custom artifact rejection algorithm rejected segments with large fast deviations in amplitude in any channel (e.g., DC shifts and spikes) that may have been missed by human inspection. Because each facial pose consisted of only one minute of EEG data, blink rejection was not performed because it would have resulted in too few trials for analysis, and because research demonstrates that retaining or rejecting blinks appears to have a negligible effect on EEG asymmetry in the alpha band (Hagemann & Naumann, 2001).
Each one-minute EEG block was epoched into 117 2.048 epochs, overlapping by 1.5 seconds to compensate for the minimal weight applied to the end of the epoch by the use of the Hamming window function. Following windowing, a Fast Fourier Transform (FFT) was applied to all artifact-free epochs. For each state emotion facial expression, total alpha power (8–13 Hz) and EMG power (70–90 Hz) were then extracted from the power spectrum.3 An asymmetry score was calculated for total alpha power by subtracting the natural log transformed scores (i.e., ln[Right] – ln[Left]) for each homologous left and right pair. Analogous asymmetry score calculations were performed for EMG power. Higher alpha asymmetry score values are commonly believed to reflect relatively greater left activity (i.e., relatively greater right alpha; cf. Allen et al., 2004a). For the present study analyses focused on a specific set of asymmetry scores (frontal: F2-F1, F4-F3, F6-F5, F8-F7) that correspond to regions commonly studied throughout the asymmetry literature (F4-F3 and F8-F7: see review by Coan & Allen, 2004). ICCs indicated that frontal EEG asymmetry scores were moderately stable across the four facial expressions and four days of recording for each of the four reference montages (range = .69–.76).
Results
Ratings of Emotion and Facial Expression Quality
Self-reported emotional experience
To examine whether emotional experience ratings during the DFA task differed as a function of lifetime MDD and sex, four linear mixed models (SAS 9.2) were run (one for each type of emotional experience: anger, fear, happiness, sadness) with facial expression (afraid, angry, happy, sad) as the within-subject variable, and lifetime MDD status and sex as between subject variables. The dependent variable was each participant’s target emotion distinctiveness score (rating of the target emotion minus the average of the ratings for the other three emotions for each facial expression) averaged across day. A main effect of facial expression emerged for each emotion, indicating that the afraid face was associated with more fear (F(3, 906) = 36.6), the angry face with more anger (F(3, 906) = 46.1), the happy face with more happiness (F(3, 906) = 50.6), and the sad face was with more sadness (F(3, 906) = 53.6) than the other three faces (all p < .001; see Table 2). In addition, a main effect of lifetime MDD emerged for anger (F(1, 302) = 13.9), happiness (F(1, 302) = 40.7) and sadness (F(1, 302) = 25.2), indicating that, compared to the lifetime MDD− group, the lifetime MDD+ group felt more anger (d = .43), less happiness (d = .73), and more sadness (d = .58) across all facial expressions (all p < .001). Finally, a main effect of sex emerged for anger (F(1, 302) = 3.9, p = .04), demonstrating that men felt more anger than women across facial expressions.
Table 2.
Emotion Distinctiveness Ratings of Participants During Each Facial Expression
| Distinct Emotion Experienced | ||||
|---|---|---|---|---|
| Facial Expression | Fear M (SE) | Anger M (SE) | Happiness M (SE) | Sadness M (SE) |
| Fear | −.05(.04) | .08 (.06) | .16 (.08) | −.18 (.05) |
| Anger | −.54(.04) | .85 (.06) | −.14 (.08) | −.17 (.05) |
| Happiness | −.61(.04) | −.13 (.06) | 1.09 (.08) | −.35 (.05) |
| Sadness | −.48(.04) | .17 (.06) | −.17 (.08) | .49 (.05) |
Note: Participants were asked while making that particular face. how angry, afraid, happy, or sad they felt on a scale of 1 to 7 (1 = no experience at all; 7 = intense experience). Distinctiveness for a given emotion is calculated as the rating of that target emotion minus the average of the rating for the other three emotions.
Task quality
To examine whether experimenter ratings of facial expression quality during the DFA task differed as a function of lifetime MDD, a linear mixed model was run with facial expression (afraid, angry, happy, sad) as the within-subjects variable, and lifetime MDD status and sex as between subject variables. The dependent variable was rating of facial expression quality averaged across days and experimenters. Results indicated that a main effect of facial expression emerged (F(3, 906) = 20.4, p < .001), wherein accuracy ratings for angry faces (M = 4.4, SE = .07) and happy faces (M = 4.5, SE = .07) were higher than those for fearful faces (M = 3.9, SE = .07) and sad faces (M = 4.0, SE = .07; all p < .001). No effects involving lifetime MDD emerged, however (p > .52), suggesting that facial expressions of depressed participants were rated as similar in quality as those of never-depressed participants.
Lifetime MDD Status and EEG Alpha Asymmetry
To examine the relationship between lifetime MDD status and frontal EEG asymmetry, full factorial mixed linear models (SAS 9.2) were run for each reference (AVG, CSD, Cz, and LM) separately, with lifetime MDD status (past and/or current MDD = lifetime MDD+, never depressed = lifetime MDD-) and biological sex (male, female) as between-subjects variables, and facial expression (afraid, angry, happy, and sad) and channel (F2-F1, F4-F3, F6-F5, F8-F7) as within-subjects variables. EEG asymmetry score based on total (8–13 Hz) alpha power was the dependent variable. An EEG asymmetry score was computed by for each facial expression by averaging across asymmetry during four days of EEG recording. The result of these calculations was a total of sixteen asymmetry scores (one afraid, angry, happy, and sad facial expression for each of four reference montages) per participant at each homologous pair. Cohen’s d is reported for significant differences between lifetime MDD+ and MDD− groups. A main effect of lifetime MDD emerged (AVG: F(1, 302) = 24.8; CSD: F(1, 302) = 32.3, Cz: F(1, 302) = 30.6; LM: F(1, 302) = 28.8; all p’s < .001), indicating that the lifetime MDD+ group displayed relatively less left frontal activity than the lifetime MDD− group across all facial expressions (AVG d = .57, CSD d = .65, Cz d = .64, and LM d = .62) (see Figure 2).
Figure 2.
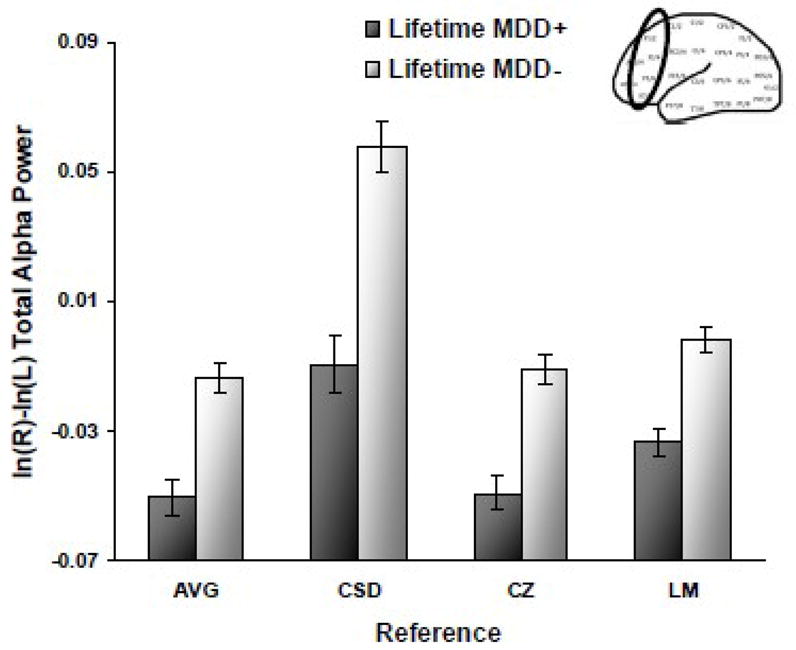
Alpha asymmetry scores (8–13Hz at F2-F1, F4-F3, F6-F5, F8-F7) by lifetime MDD status for each reference montage (AVG = average, CSD = current source density, CZ = Cz, and LM = linked mastoid) across all four facial expressions. Error bars reflect standard error. Y-axis is ln μV2 for AVG, Cz, and LM references, and ln μV2/cm2 for CSD referenced data.
Effects of less direct relevance included: 1) main effects of face for all four reference montages (all F > 4.5 and p < .01); 2) main effects of channel for all four reference montages (all F > 16.2 and p <.001); 3) a face by channel interaction for AVG, Cz, and LM references (all F > 3.0 and p < .01), indicating that happy and angry faces were associated with relatively greater left frontal activity than afraid and sad faces (the former at F6-F5 for LM and F8-F7 for AVG and LM; the latter at F6-F5 and F8-F7 for all three references; all p < .05). For CSD, the main effect of face indicated that angry and happy faces were associated with relatively greater left frontal activity than afraid and sad faces (all p < .05), and the main effect of channel demonstrated that F2-F1 and F4-F3 were associated with relatively greater left frontal activity than F6-F5 and F8-F7 (all p < .001). In addition, a main effect of sex emerged for AVG, CSD, and Cz (all F >18.3 and p < .001), showing that for all facial expressions, women displayed greater relative left frontal activity than men. Finally, a sex by channel interaction emerged for LM (F(3, 906) = 3.4, p = .02), showing that women displayed higher relative left frontal activity than men for F4-F3 and F6-F5 (both p = .04).
Follow-up analysis: Current MDD status
In order to determine whether the link between lifetime MDD status and frontal EEG asymmetry was due to current levels of depressive symptoms, the full factorial mixed model was rerun for each reference, but instead of lifetime MDD status, current MDD status was used (current MDD+ = all participants with current MDD, regardless of past MDD status; past MDD+ = participants with past MDD but not current MDD or current dysthymia; MDD− = participants without past MDD, current MDD, or current dysthymia; six participants with past MDD but current dysthymia were not included in these analyses). Current MDD status and sex were between-subjects variables, facial expression and channel were within-subject variables, and EEG alpha asymmetry score was again the dependent variable. Main effects and interactions involving current MDD status were effects of importance. Cohen’s d is reported for significant differences between current MDD+, past MDD +, and MDD− groups.
A main effect emerged for current MDD status (AVG: F(2, 294) = 13.0; CSD: F(2, 294) = 19.4; Cz: F(2, 294) = 15.8; LM: F(2, 294) = 12.5; all p’s < .001), and Figure 3 indicates that the current MDD+ and past MDD+ groups displayed relatively less left frontal activity across all facial expressions than the MDD− group for AVG (both p < .01 and d = .73 and .41, respectively), CSD (both p < .001 and d = .88 and .51), Cz (both p < .001 and d = .73 and .57), and LM (both p < .001 and d = .66 and .50) references. In addition, for the CSD reference, the current MDD+ group displayed relatively less left frontal activity than the past MDD+ group (p = .04 and d = .35) but current MDD+ and past MDD+ groups did not differ for AVG (p > .07), Cz (p > .39) or LM (p > .39). No interactions involving current MDD status emerged. Overall, these findings indicate that current depression does not account for lifetime MDD asymmetry results.
Figure 3.
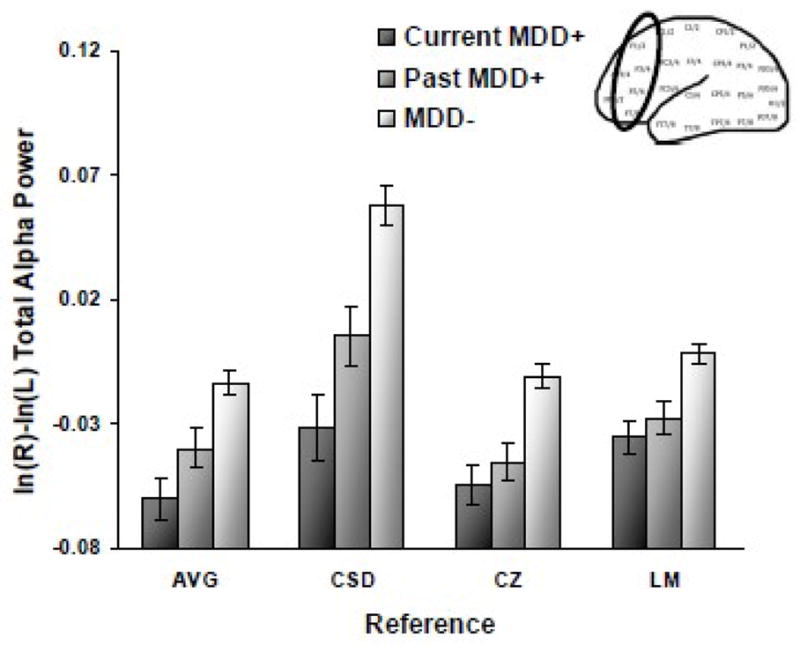
Alpha asymmetry scores (8–13Hz at F2-F1, F4-F3, F6-F5, F8-F7) by current MDD status for each reference montage (AVG = average, CSD = current source density, CZ = Cz, and LM = linked mastoid) across all four facial expressions. Error bars reflect standard error. Y-axis is ln μV2 for AVG, Cz, and LM references, and ln μV2/cm2 for CSD referenced data.
Additional follow-up analyses
To examine whether EMG-related alpha asymmetry differences could account for the main asymmetry findings, lifetime MDD asymmetry analyses were repeated, substituting EMG-residualized alpha asymmetry scores (e.g., McMenamin et al., 2009; Shackman et al., 2009b) as the dependent variable. Estimates of EMG activity were not examined from the CSD reference, as this montage estimates radial current flow into and out of the skull from underlying neural tissue (Tenke & Kayser, 2005) and, as such, it is not designed to provide a meaningful estimate of potentials that originate from muscles overlaying the skull. Figure 4 demonstrates that lifetime MDD main effects emerged (AVG: F(1, 302) = 17.2; Cz: F(1, 302) = 21.1; LM: F(1, 302) = 21.9; all p < .001), wherein the lifetime MDD+ group displayed relatively less left frontal activity than the lifetime MDD− group (AVG d = .48; Cz d = .53; LM d = .54), demonstrating that original EEG alpha asymmetry results were not due to patterns of EMG activity.
Figure 4.
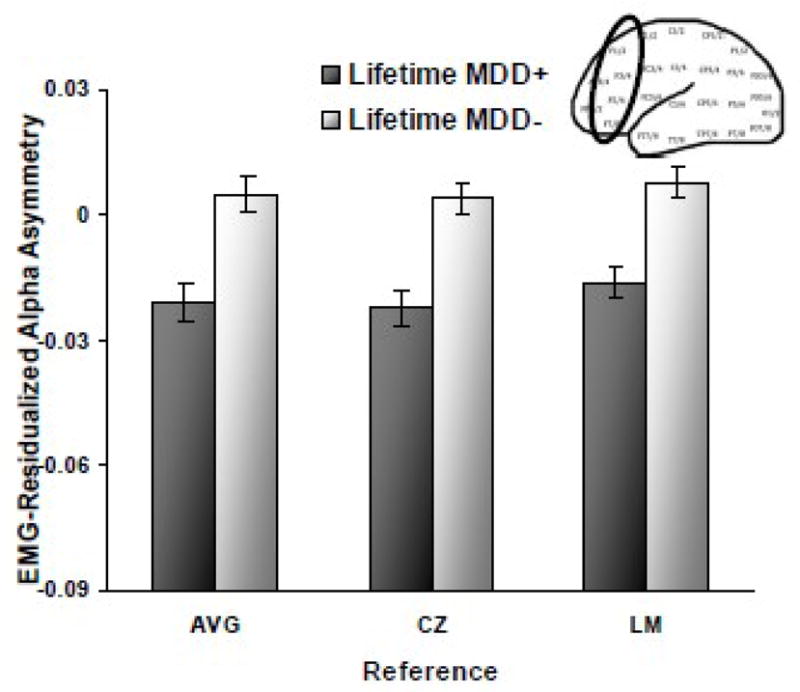
Alpha asymmetry scores (8–13Hz at F2-F1, F4-F3, F6-F5, F8-F7) after EMG (70–90Hz) residualization as function of lifetime MDD status for three reference montages (AVG = average, CZ = Cz, and LM = linked mastoid) across all four facial expressions. Error bars reflect standard error. Y-axis is ln μV2.
Moreover, supplementary analyses examined whether third variables could account for the lifetime MDD status main effect on EEG asymmetry using Type 1 (rather than Type 3) sums of squares in a hierarchical linear mixed model. Face, channel, and sex were entered first, followed by either target emotion distinctiveness scores or the average of the two judges’ task quality ratings for each face, then lifetime MDD status was added to the model. EEG alpha asymmetry score was the dependent variable. A main effect of lifetime MDD still emerged when ratings of task quality (AVG: F(1, 303) = 30.1; CSD: F(1, 303) = 45.2; Cz: F(1, 303) = 35.2; LM: F(1, 303) = 33.6; all p < .001), anger (AVG: F(1, 303) = 27.6; CSD: F(1, 303) = 41.0; Cz: F(1, 303) = 35.7; LM: F(1, 303) = 29.2; all p < .001), fear (AVG: F(1, 303) = 30.3; CSD: F(1, 303) = 44.4; Cz: F(1, 303) = 34.3; LM: F(1, 303) = 33.8; all p < .001), happiness (AVG: F(1, 303) = 24.7; CSD: F(1, 303) = 33.4; Cz: F(1, 303) = 31.1; LM: F(1, 303) = 25.9; all p < . 001), and sadness (AVG: F(1, 303) = 27.1; CSD: F(1, 303) = 38.6; Cz: F(1, 303) = 32.5; LM: F(1, 303) = 30.2; all p < .001) were entered before lifetime MDD, suggesting that asymmetry differences between depressed and never-depressed participants were not due to these third variables.
Discussion
Alpha EEG Asymmetry, Depression, and Emotional Challenge
The present study examined whether frontal EEG asymmetry as a risk marker of depression is robust across approach- and withdrawal-related emotional challenges. First, it was predicted that individuals with a lifetime history of depression would display relatively lower left than right frontal activity than never-depressed individuals across all approach- and withdrawal-related facial expressions, consistent with much of the state and trait EEG asymmetry literature. This prediction was confirmed for all four reference montages (average, current source density, Cz, and linked mastoids), consistent with 1) the assertion that emotional challenges produce powerful asymmetry effects that can overcome method variance such as choice of EEG reference (Coan et al., 2001; Coan et al., 2006) and 2) previous work examining state emotion processing in depressed individuals (e.g., Harmon-Jones et al., 2002; Nitschke et al., 2004; Shankman et al., 2007). The second prediction was that, despite shared variance between EEG and EMG activity, EMG (70–90 Hz) asymmetry would not eliminate the overall pattern of EEG asymmetry differences between depressed and never-depressed groups, and this prediction was supported, replicating previous research (Coan et al., 2001).
The third and final hypothesis predicted that EEG asymmetry differences as a function of depression status would not be attributable to participants’ emotional experience nor accuracy of their facial expressions as judged by FACS-trained experimenters. This hypothesis was also supported and these results are consistent with prior research examining EEG asymmetry during the DFA task in healthy subjects (Coan et al., 2001). Analyses of emotional experience indicated that depressed participants endorsed higher levels of anger and sadness and lower levels of happiness than never-depressed participants during the DFA task independent of the facial muscles they were moving, consistent with previous research reporting similar differences between depressed and non-depressed individuals (Power & Tarsia, 2007). Although group differences in emotional experience were present, they did not account for EEG asymmetry differences between life time MDD+ and MDD− groups. Similarly, FACS-trained experimenter ratings of participants’ facial expression quality did not account for EEG asymmetry differences as a function of depression status. In addition, judges rated depressed and never-depressed participants similarly in their ability to correctly demonstrate muscle actions associated with afraid, angry, happy, and sad faces. Although studies have shown that depression is associated with reductions in positive facial expressions (see Rottenberg and Vaughan, 2008, for a review), there is no evidence indicating that depressed individuals are less accurate in the formation of positive and negative facial expressions than healthy individuals, and one study has demonstrated that imitation of facial expressions is indeed intact in current depressives (Gaebel & Wölwer, 1992). Thus the DFA challenge paradigm reveals a robust difference between lifetime MDD+ and MDD− individuals in frontal brain activity that is not accounted by current experience nor behavioral performance, bolstering its utility as a measure that indexes risk for depression independent of current state.
Frontal EEG Asymmetry as a Risk Marker for Depression
If frontal EEG asymmetry is to be considered a risk marker of depression, it must be additionally independent of current clinical status. The present study demonstrates that across all four reference montages, current and past MDD+ groups both displayed relatively less left frontal activity than the MDD− group during all facial expressions, results suggesting that asymmetry differences between individuals with lifetime MDD and never-depressed individuals were not purely due to current depression symptoms. In addition, findings of the present study indicate that depressed individuals exhibited a similar pattern of reduced relative left frontal asymmetry during all facial expressions, regardless of whether they were approach- or withdrawal-related, or positively or negatively valenced, suggesting a trait-like mechanism of emotional responding that is consistent with much of the resting EEG asymmetry literature on depression (see Thibodeau et al., 2006).
Limitations and Implications
Although the present study examined a large and carefully characterized sample, only one emotion task was utilized, leaving open the question of whether similar differentiation of lifetime MDD individuals would be evident in other emotion challenge tasks. In support of this idea is research showing that affectively-modulated startle could not distinguish between remitted depressives and never depressed controls if assessed in the absence of a mood manipulation, but that differences were apparent if depressed moods were induced (Allen & Di Parsia, 2002). Moreover, the magnitude of such startle is predictive of future depressive symptomatology (O’Brien-Simpson et al., 2009).
Although sex differences in prefrontal brain activity were identified, these effects were independent of those involving MDD status. Thus prefrontal brain asymmetry holds the potential to serve as a marker of risk for both men and women. Although the challenge paradigm utilized here served to highlight prefrontal brain activity differences as a function of lifetime MDD, the clinical applicability of this approach is less significant than the significance of these findings for research that can probe brain systems that underlie risk for depression, which then may ultimately become the targets of future interventions.
Acknowledgments
Role of Funding Source.
This research was supported in part by grants from the National Institutes of Health (R01-MH066902) and the National Alliance for Research on Schizophrenia and Depression (NARSAD) to John Allen. NIMH and NARSAD had no further role in study design, collection, analysis and interpretation of data, writing of the manuscript, or the decision to submit the paper for publication.
The authors wish to thank Eliza Fergerson, Jamie Velo, Dara Halpern, Andrew Bismark, Craig Santerre, Eynav Accortt, Amanda Brody, and Jay Hegde for assistance with subject recruitment, and myriad research assistants who helped to collect and review EEG data.
Footnotes
Of the 21 participants who did not complete their sessions within a 14-day period, 15 completed all sessions within 16 days, whereas the remaining 6 completed all sessions within 18-20 days.
Several participants had only one face rater on a particular day (Day 1: n = 17, Day 2: n = 12, Day 3: n = 16; Day 4: n = 16), whereas on each of the four days, 3 participants had no face raters.
EEG data for faces with fewer than 40 useable epochs were excluded from data analysis per recommendations of Towers and Allen (2009). A total of 264 faces (5.8% of the DFA data) met this criterion. Mixed model analyses were able to accommodate these missing cells.
Conflicts of Interest.
All authors declare that they have no conflicts of interest.
Contributors.
James A. Coan and John J.B. Allen designed the present study and procured grant support. Jennifer L. Stewart performed the literature search, performed the majority of statistical analyses, and wrote the first draft of the manuscript under the supervison of John J.B. Allen. David N. Towers assisted in data management and statistical analysis. All authors contributed to and have approved the final manuscript.
Publisher's Disclaimer: This is a PDF file of an unedited manuscript that has been accepted for publication. As a service to our customers we are providing this early version of the manuscript. The manuscript will undergo copyediting, typesetting, and review of the resulting proof before it is published in its final citable form. Please note that during the production process errors may be discovered which could affect the content, and all legal disclaimers that apply to the journal pertain.
References
- Allen JJB, Coan JA, Nazarian M. Issues and assumptions on the road from raw signals to metrics of frontal EEG asymmetry in emotion. Biological Psychology. 2004a;67:183–218. doi: 10.1016/j.biopsycho.2004.03.007. [DOI] [PubMed] [Google Scholar]
- Allen JJB, Urry HL, Hitt SK, Coan JA. The stability of resting frontal electroencephalographic asymmetry in depression. Psychophysiology. 2004b;41:269–280. doi: 10.1111/j.1469-8986.2003.00149.x. [DOI] [PubMed] [Google Scholar]
- Allen NB, Di Parsia P. Effects of mood induction on startle modulation by social threat in individuals with and without a history of depression. Psychophysiology. 2002;39:S5. [Google Scholar]
- Beck AT, Ward CH, Mendelson M, Mock J, Erbaugh J. An inventory for measuring depression. Archives of General Psychiatry. 1961;4:561–571. doi: 10.1001/archpsyc.1961.01710120031004. [DOI] [PubMed] [Google Scholar]
- Bismark AW, Moreno FA, Stewart JL, Towers DN, Coan JA, Oas J, Erickson RP, Allen JJB. Polymorphisms of the HTR1a allele are linked to frontal brain electrical asymmetry. Biological Psychology. 2010;2:153–158. doi: 10.1016/j.biopsycho.2009.12.002. [DOI] [PMC free article] [PubMed] [Google Scholar]
- Bruder GE, Fong R, Tenke CE, Leite P, Towey JP, Stewart JE, McGrath PJ, Quitkin FM. Regional brain asymmetries in major depression with or without an anxiety disorder: A quantitative electroencephalographic study. Biological Psychiatry. 1997;41:939–948. doi: 10.1016/S0006-3223(96)00260-0. [DOI] [PubMed] [Google Scholar]
- Bruder GE, Tenke CE, Warner V, Nomura Y, Grillon C, Hille J, Leite P, Weissman MM. Electroencephalographic measures of regional hemispheric activity in offspring at risk for depressive disorders. Biological Psychiatry. 2005;57:328–335. doi: 10.1016/j.biopsych.2004.11.015. [DOI] [PubMed] [Google Scholar]
- Chapman LJ, Chapman JP. The measurement of handedness. Brain and Cognition. 1987;6:175–183. doi: 10.1016/0278-2626(87)90118-7. [DOI] [PubMed] [Google Scholar]
- Coan JA, Allen JJB. The state and trait nature of frontal EEG asymmetry in emotion. In: Hugdahl K, Davidson RJ, editors. The Asymmetrical Brain. 2. MIT Press; Cambridge, MA: 2003. pp. 565–615. [Google Scholar]
- Coan JA, Allen JJB. Frontal EEG asymmetry as a moderator and mediator of emotion. Biological Psychology. 2004;67:7–49. doi: 10.1016/j.biopsycho.2004.03.002. [DOI] [PubMed] [Google Scholar]
- Coan JA, Allen JJB, Harmon-Jones E. Voluntary facial expression and hemispheric asymmetry over the frontal cortex. Psychophysiology. 2001;38:912–925. doi: 10.1111/1469-8986.3860912. [DOI] [PubMed] [Google Scholar]
- Coan JA, Allen JJB, McKnight PE. A capability model of individual differences in frontal EEG asymmetry. Biological Psychology. 2006;72:198–207. doi: 10.1016/j.biopsycho.2005.10.003. [DOI] [PMC free article] [PubMed] [Google Scholar]
- Davidson RJ, Ekman P, Saron CD, Senulis JA, Friesen WV. Approach-withdrawal and cerebral asymmetry: Emotional expression and brain physiology I. Journal of Personality and Social Psychology. 1990;58:330–341. [PubMed] [Google Scholar]
- Davidson RJ. Emotion and affective style: Hemispheric substrates. Psychological Science. 1992;3:39–43. [Google Scholar]
- Davidson RJ. Affective style and affective disorders: Perspectives from affective neuroscience. Cognition and Emotion. 1998;12:307–330. [Google Scholar]
- Davidson RJ, Pizzagalli D, Nitschke JB, Putnam K. Depression: Perspectives from affective neuroscience. Annual Review of Psychology. 2002;53:545–74. doi: 10.1146/annurev.psych.53.100901.135148. [DOI] [PubMed] [Google Scholar]
- Ekman P, Davidson RJ. Voluntary smiling changes regional brain activity. Psychological Science. 1992;4:342–345. [Google Scholar]
- Ekman P, Friesen WV. The Facial Action Coding System (FACS): A Technique for the Measurement of Facial Action. Palo Alto, CA: Consulting Psychologists Press; 1978. [Google Scholar]
- First MG, Spitzer RL, Gibbon M, Williams JB. Structured clinical interview for DSM-IV Axis I disorder—clinical version, administration booklet. New York, NY: Biometrics Research Department; 1997. [Google Scholar]
- Fox NA, Davidson RJ. Patterns of brain electrical activity during facial signs of emotion in 10 month-old infants. Developmental Psychology. 1988;24:230–246. [Google Scholar]
- Gaebel W, Wölwer W. Facial expression and emotional face recognition in schizophrenia and depression. European Archives of Psychiatry and Clinical Neuroscience. 1992;242:46–52. doi: 10.1007/BF02190342. [DOI] [PubMed] [Google Scholar]
- Gotlib IH, Ranganath C, Rosenfeld JP. Frontal EEG alpha asymmetry, depression, and cognitive functioning. Cognition & Emotion. 1998;12:449–478. [Google Scholar]
- Gray JA. The neuropsychology of anxiety: An inquiry into the functions of the septohippocampal system. Oxford, England: Oxford University Press; 1982. [Google Scholar]
- Gray JA. The neuropsychology of fear and stress. Cambridge, England: Cambridge University Press; 1987. [Google Scholar]
- Gray JA, McNaughton N. The neuropsychology of anxiety: Reprise. In: Hope DA, editor. Perspectives on anxiety, panic, and fear. Lincoln: Nebraska: University of Nebraska Press; 1996. pp. 61–134. [PubMed] [Google Scholar]
- Hagemann D, Naumann E. The effects on ocular artifacts on (lateralized) broadband power in the EEG. Clinical Neurophysiology. 2001;112:215–231. doi: 10.1016/s1388-2457(00)00541-1. [DOI] [PubMed] [Google Scholar]
- Hagemann D, Naumann E, Thayer JF. The quest for the EEG reference revisited: A glance from brain asymmetry research. Psychophysiology. 2001;38:847–857. [PubMed] [Google Scholar]
- Hagemann D, Naumann E, Thayer JF, Bartussek D. Does resting electroencephalograph asymmetry reflect a trait?: An application of latent state-trait theory. Journal of Personality and Social Psychology. 2002;82:619–641. [PubMed] [Google Scholar]
- Harmon-Jones E, Allen JB. Behavioral activation sensitivity and resting frontal EEG asymmetry: Covariation of putative indicators related to risk of mood disorders. Journal of Abnormal Psychology. 1997;106:159–163. doi: 10.1037//0021-843x.106.1.159. [DOI] [PubMed] [Google Scholar]
- Harmon-Jones E, Abramson LY, Sigelman J, Bohlig A, Hogan ME, Harmon-Jones C. Proneness to hypomania/mania symptoms or to depression symptoms and asymmetrical frontal cortical responses to an anger-evoking event. Journal of Personality and Social Psychology. 2002;82:610–618. [PubMed] [Google Scholar]
- Heller W, Nitschke JB. The puzzle of regional brain activity in depression and anxiety: The importance of subtypes and comorbidity. Cognition and Emotion. 1998;12:421–447. [Google Scholar]
- Henriques JB, Davidson RJ. Regional brain electrical asymmetries discriminate between previously depressed and healthy control subjects. Journal of Abnormal Psychology. 1990;99:22–31. doi: 10.1037//0021-843x.99.1.22. [DOI] [PubMed] [Google Scholar]
- Henriques JB, Davidson RJ. Left frontal hypoactivation in depression. Journal of Abnormal Psychology. 1991;100:535–545. doi: 10.1037//0021-843x.100.4.535. [DOI] [PubMed] [Google Scholar]
- Herrington JD, Heller W, Mohanty A, Engels AS, Banich MT, Webb AG, Miller GA. Localization of asymmetric brain function in emotion and depression. Psychophysiology. doi: 10.1111/j.1469-8986.2009.00958.x. in press. [DOI] [PMC free article] [PubMed] [Google Scholar]
- Kayser J, Tenke CE. Principal components analysis of Laplacian waveforms as a generic method for identifying ERP generator patterns: I. Evaluation with auditory oddball tasks. Clinical Neurophysiology. 2006;117:348–368. doi: 10.1016/j.clinph.2005.08.034. [DOI] [PubMed] [Google Scholar]
- Levenson RW, Ekman P, Friesen WV. Voluntary facial action generates emotion-specific autonomic nervous system activity. Psychophysiology. 1990;27:363–384. doi: 10.1111/j.1469-8986.1990.tb02330.x. [DOI] [PubMed] [Google Scholar]
- Mauss IB, Levenson RW, McCarter L, Wilhelm FH, Gross JJ. The tie that binds? Coherence among emotional experience, behavior, and physiology. Emotion. 2005;5:175–190. doi: 10.1037/1528-3542.5.2.175. [DOI] [PubMed] [Google Scholar]
- McMenamin BW, Shackman AJ, Maxwell JS, Greischar LL, Davidson RJ. Validation of regression-based myogenic correction techniques for scalp and source-localized EEG. Psychophysiology. 2009;46:578–592. doi: 10.1111/j.1469-8986.2009.00787.x. [DOI] [PMC free article] [PubMed] [Google Scholar]
- Metzger LJ, Paige SR, Carson MA, Lasko NB, Paulus LA, Pittman RK, Orr SP. PTSD arousal and depression symptoms associated with increased right-sided parietal EEG asymmetry. Journal of Abnormal Psychology. 2004;113:324–329. doi: 10.1037/0021-843X.113.2.324. [DOI] [PubMed] [Google Scholar]
- Miller A, Fox NA, Cohn JF, Forbes EE, Sherrill JT, Kovacs M. Regional patterns of brain activity in adults with a history of childhood-onset depression: Gender differences and clinical variability. American Journal of Psychiatry. 2002;159:934–940. doi: 10.1176/appi.ajp.159.6.934. [DOI] [PubMed] [Google Scholar]
- Nitschke JB, Heller W, Etienne MA, Miller GA. Prefrontal cortex activity differentiates processes affecting memory in depression. Biological Psychology. 2004;67:125–143. doi: 10.1016/j.biopsycho.2004.03.004. [DOI] [PubMed] [Google Scholar]
- O’Brien-Simpson L, Di Parsia P, Simmons JG, Allen NB. Recurrence of major depressive disorder is predicted by inhibited startle magnitude while recovered. Journal of Affective Disorders. 2009;112:243–249. doi: 10.1016/j.jad.2008.03.022. [DOI] [PubMed] [Google Scholar]
- Perrin F, Pernier J, Bertrand O, Echallier JF. Spherical splines for scalp potential and current density mapping. Electroencephalography and clinical Neurophysiology. 1989;72:184–187. doi: 10.1016/0013-4694(89)90180-6. [DOI] [PubMed] [Google Scholar]
- Perrin F, Pernier J, Bertrand O, Echallier JF. Corrigenda. Electroencephalography and clinical Neurophysiology. 1990;76:565–566. doi: 10.1016/0013-4694(89)90180-6. [DOI] [PubMed] [Google Scholar]
- Power MJ, Tarsia M. Basic and complex emotions in depression and anxiety. Clinical Psychology and Psychotherapy. 2007;14:19–31. [Google Scholar]
- Reid SA, Duke LM, Allen JJB. Resting frontal electroencephalographic asymmetry in depression: Inconsistencies suggest the need to identify mediating factors. Psychophysiology. 1998;35:389–404. [PubMed] [Google Scholar]
- Rottenberg J, Vaughan C. Emotion expression in depression: Emerging evidence for emotion context-insensitivity. In: Vingerhoets A, Nyklicek I, editors. Emotion regulation: Conceptual and clinical issues. New York: Springer Science and Business Media; 2008. pp. 125–139. [Google Scholar]
- Shackman AJ, McMenamin BW, Maxwell JS, Greischar LL, Davidson RJ. Right dorsolateral prefrontal cortical activity and behavioral inhibition. Psychological Science. 2009a;20:1500–1506. doi: 10.1111/j.1467-9280.2009.02476.x. [DOI] [PMC free article] [PubMed] [Google Scholar]
- Shackman AJ, McMenamin BW, Slagter HA, Maxwell JS, Greischar LL, Davidson RJ. Electromyogenic artifacts and electroencephalographic inferences. Brain Topography. 2009b;22:7–12. doi: 10.1007/s10548-009-0079-4. [DOI] [PMC free article] [PubMed] [Google Scholar]
- Shankman SA, Klein DN, Tenke CE, Bruder GE. Reward sensitivity in depression: A biobehavioral study. Journal of Abnormal Psychology. 2007;116:95–104. doi: 10.1037/0021-843X.116.1.95. [DOI] [PubMed] [Google Scholar]
- Stewart JL, Bismark AW, Towers DN, Coan JA, Allen JJB. Resting frontal EEG asymmetry as an endophenotype for depression risk: Sex-specific patterns of frontal brain asymmetry. Journal of Abnormal Psychology. doi: 10.1037/a0019196. in press-a. [DOI] [PMC free article] [PubMed] [Google Scholar]
- Stewart JL, Towers DN, Coan JA, Allen JJB. The oft-neglected role of parietal EEG asymmetry and risk for major depressive disorder. Psychophysiology. doi: 10.1111/j.1469-8986.2010.01035.x. in press-b. [DOI] [PMC free article] [PubMed] [Google Scholar]
- Thibodeau R, Jorgensen RS, Kim S. Depression, anxiety, and resting frontal EEG asymmetry: A meta-analytic review. Journal of Abnormal Psychology. 2006;115:715–729. doi: 10.1037/0021-843X.115.4.715. [DOI] [PubMed] [Google Scholar]
- Towers DN, Allen JJB. A better estimate of the internal consistency reliability of frontal EEG asymmetry scores. Psychophysiology. 2009;46:132–142. doi: 10.1111/j.1469-8986.2008.00759.x. [DOI] [PMC free article] [PubMed] [Google Scholar]