

Summary
GPNMB is a unique melanosomal protein. Unlike many melanosomal proteins, GPNMB has not been associated with any forms of albinism and it is unclear whether GPNMB has any direct influence on melanosomes. Here, melanosomes from congenic strains of C57BL/6J mice mutant for Gpnmb are compared to strain-matched controls using standard transmission electron microscopy and synchrotron-based X-ray absorption near-edge structure analysis (XANES). Whereas electron microscopy did not detect any ultrastructural changes to melanosomes lacking functional GPNMB, XANES uncovered multiple spectral phenotypes. These results directly demonstrate that GPNMB influences the chemical composition of melanosomes, and more broadly illustrate the potential for using genetic approaches in combination with nano-imaging technologies to study organelle biology.
Significance
Of the large number of proteins known to be present in melanosomes, the majority are not known to visibly influence melanosome appearance. It remains largely unknown what role, if any, most of these proteins may have in pigment cell biology. This work demonstrates an approach for discovering previously undetectable melanosomal phenotypes through a combined use of synchrotron-based spectromicroscopy and genetics. Specifically, we demonstrate that GPNMB influences the carbon absorption spectra of melanosomes. A similar strategy might also be applied to discover new features of a wide range of additional organelles important to human health and disease.
Keywords: Genetic mapping, Melanin, Melanocytes, Melanosomes, XANES spectroscopy
Introduction
Melanosomes are organelles that produce and store melanin pigment. Melanin synthesis involves a series of oxidative transformations that convert tyrosine, through several quinone intermediates, into a complex biopolymer (Simon et al., 2009). Several melanosomal enzymes and transporters that are required for melanin synthesis have been identified, most of which cause forms of albinism if their function is altered in humans or mice (Dessinioti et al., 2009; Steingrimsson et al., 2006). However, the melanosome proteome includes many additional proteins whose functions remain unclear (Chi et al., 2006), including the enigmatic GPNMB protein (Anderson et al., 2008b; Le Borgne et al., 2001; Weterman et al., 1995).
GPNMB is an atypical melanosomal protein whose functional impact and primary structure differ from those of other melanosomal proteins. Unlike many melanosomal proteins that were initially identified based on genetic mutations influencing pigmentation (Bennett and Lamoreux, 2003), Gpnmb mutation has not been observed to influence mouse coat color (Anderson et al., 2006b). However, Gpnmb does influence other pigment-related phenotypes. Mutations in Gpnmb cause an iris disease involving pigment dispersion and glaucoma (Anderson et al., 2002). GPNMB is also differentially expressed in melanoma cell lines with differing metastatic properties (Weterman et al., 1995). Unfortunately, the predicted structure of GPNMB is not particularly insightful with respect to predicting what function, if any, GPNMB may have within melanosomes.
Recently, studies using synchrotron-based imaging techniques have suggested that GPNMB may influence the chemical composition of melanosomes (Anderson et al., 2006a). Using a scanning transmission X-ray microscope (STXM), X-ray absorption near-edge structure analysis (XANES) is a technique making spectromicroscopy at nano-scale resolution possible (Petibois and Cestelli Guidi, 2008). STXM instruments focus a variable photon energy beam across a sample while the absorption of X-rays is measured. Events influencing K shell absorption give rise to near-edge absorption spectra, a fingerprint of the chemical composition in the sample. With XANES, we have found that purified melanosomes from DBA/2J mice exhibit spectra that differ from those produced by the melanosomes of C57BL/6J mice (Anderson et al., 2006a). Because DBA/2J mice carry a known Gpnmb mutation, GpnmbR150X (Anderson et al., 2002), it is a strong candidate for contributing to this chemical difference. Here, we test this hypothesis directly by analyzing XANES spectra of isolated melanosomes from congenic C57BL/6J mice with the GpnmbR150X mutation. Spectral phenotypes of C57BL/6J mice with mutations in Tyrp1 and Dct are also analyzed. The results identify multiple spectral phenotypes, including monogenic changes mediated by Gpnmb, digenic changes mediated by Gpnmb and Tyrp1, and a phenocopy indicative of epistatic interactions between Tyrp1 and Dct. These results directly demonstrate that GPNMB influences the chemical composition of melanosomes.
Results
TEM does not identify phenotypes in Gpnmb-mutant melanosomes
Multiple lines of evidence suggest that GPNMB is a melanosomal protein. GPNMB protein has been identified in proteomic studies of melanosomes (Chi et al., 2006), and independently observed within melanosomes by immunohistochemistry (Tomihari et al., 2009) and western blot analysis (Hoashi et al.). Nevertheless, it remains unclear whether GPNMB has any functional impact on melanosomes. To test whether GPNMB might influence melanosomal ultrastructure, iridial melanosomes of mice homozygous for the GpnmbR150X mutation were analyzed by TEM (Figure 1). In this analysis, melanosomes of C57BL/6J and B6.D2-GpnmbR150X/Sj mice were indistinguishable, having similar appearance (Figure 1A–F) and shape (Figure 1G). Likewise, the GpnmbR150X mutation had no discernable influence on melanosomes from the choroid or retinal pigment epithelium (Figure 2). These results indicate that if GPNMB has a function that is important to melanosomal ultrastructure, it is not readily identifiable by TEM.
Figure 1.

Lack of Gpnmb-mutant phenotype detectable by TEM in melanosomes of the iris. (A,B) Light microscopy (scale bar = 10 μm) and (C,D) TEM (scale bar = 2 μm) images showing similarities in the appearance of melanosomes from C57BL/6J (left column) and B6.D2-GpnmbR150X/Sj (right column) irides. (E,F) Higher magnification TEM of iris pigment epithelium (scale bar = 0.5 μm). Arrowheads, border region; S, iris stroma, I, iris pigment epithelium. (G) Shape distribution plot showing that in situ melanosomes of the iris from C57BL/6J and B6.D2-GpnmbR150X/Sj mice share a similar shape.
Figure 2.
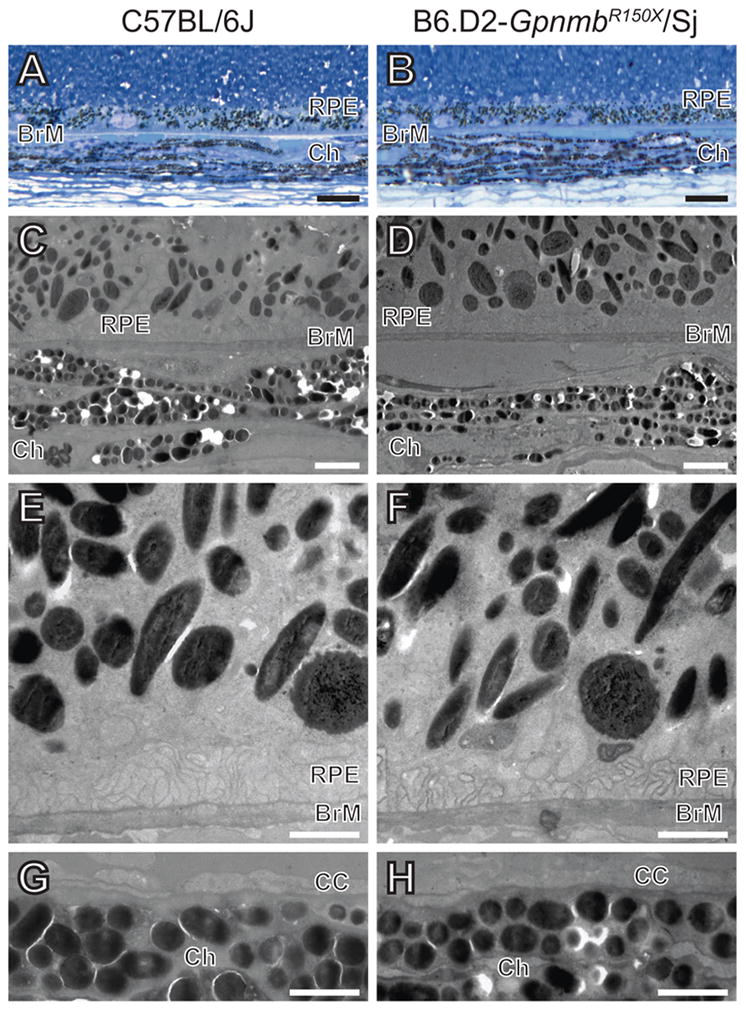
Lack of Gpnmb-mutant phenotype detectable by TEM in melanosomes of the retinal pigment epithelium and choroid. (A,B) Light microscopy (scale bar = 10 μm) and (C,D) low magnification TEM (scale bar = 2 μm) images showing similar appearance of melanosomes from C57BL/6J (left column) and B6.D2-GpnmbR150X/Sj (right column) tissues. (E,F) Higher magnification TEM of RPE and (G,H) choroid (scale bar = 1 μm). Note that there are no apparent differences in density, distribution, size, shape, or pigmentation of melanosomes from C57BL/6J and B6.D2-GpnmbR150X/Sj mice. BrM, Bruchs membrane; RPE, retinal pigmented epithelium; Ch, choroid; CC, choriocapillaris.
Synchrotron-based XANES uncovers multiple monogenic and digenic spectral phenotypes
To test whether Gpnmb influences melanosome composition, we analyzed XANES spectra from melanosomes isolated from mutant mice (Figure 3). As previously described (Anderson et al., 2006a), normalized spectra of melanosomes from C57BL/6J and DBA/2J mice exhibited spectral differences from 284–288 eV (Figure 3A). Compared to C57BL/6J controls, melanosomes from B6.D2-GpnmbR150X/Sj mice homozygous for the GpnmbR150X mutation exhibited increased spectral absorption in the range of 285–287 eV (Figure 3B). These data indicate that Gpnmb mutation influences the chemical composition of melanosomes.
Figure 3.

XANES spectra reveal that mutations in both Gpnmb and Tyrp1 contribute to differences between C57BL/6J and DBA/2J melanosomes. (A) Strain-dependent spectral difference exhibited by melanosomes of C57BL/6J and DBA/2J mice. (B) Monogenic contributions of Gpnmb and Tyrp1 mutations. Normalized spectra, mean ± 1 standard deviation; Student’s two-tailed t-test (compared to C57BL/6J) with significance set at 0.05 (red bar); n = number of fields analyzed per genotype.
DBA/2J mice also carry the Tyrp1b allele, a missense mutation resulting in altered coat color (Zdarsky et al., 1990) and causing iris stromal atrophy in the eye (Anderson et al., 2002; Chang et al., 1999). TYRP1 has been proposed to be an enzyme required for conversion of the melanin intermediate 5,6-dihydroxyindole-2-carboxylic acid into indole 5,6-quinone-2-carboxylic acid (Kobayashi et al., 1994), though this role is controversial and other functions have also been proposed (Boissy et al., 1998; Halaban and Moellmann, 1990; Trantow et al., 2010). To test whether Tyrp1 influences melanosome composition, we analyzed melanosomes purified from mice homozygous for the Tyrp1b mutation. Compared to C57BL/6J controls, melanosomes from B6.D2-Tyrp1b/Sj mice exhibited decreased absorption from 284–285 eV (Figure 3B). When compared directly, the B6.D2-GpnmbR150X/Sj and B6.D2-Tyrp1b/Sj spectra were found to differ significantly across the broad range of 284–287 eV (P<0.05, statistical analysis not shown). These data demonstrate that Tyrp1 mutation also influences the chemical composition of melanosomes and that Gpnmb and Tyrp1 mutation individually cause distinct spectral phenotypes.
Gpnmb and Tyrp1 genetically interact in contributing to the pigment-dispersing iris disease of DBA/2J mice (Anderson et al., 2006b; Anderson et al., 2002; Chang et al., 1999). In order to test whether Gpnmb and Tyrp1 might also jointly influence melanosomal spectra, we analyzed melanosomes from congenic B6.D2-Tyrp1bGpnmbR150X/Sj mice homozygous for both Tyrp1b and GpnmbR150X (Figure 4A). Two interesting phenomena were uncovered. First, in the range of 284–285 eV, Tyrp1 acted epistatically to Gpnmb. Whereas the GpnmbR150X mutation acting monogenically trended toward absorption above C57BL/6J levels, this effect was lost in spectra of melanosomes from mice with both Tyrp1b and GpnmbR150X mutations which instead resembled the phenotype of Tyrp1b in this range. Second, in the range of 285–287 eV, a new digenic phenotype of decreased absorption was observed. Whereas the GpnmbR150X mutation acting monogenically caused increased absorption in this range and Tyrp1b had no significant influence, the spectra from double mutants exhibited a significant decrease in absorption. The combined influence of Tyrp1b and GpnmbR150X converted C57BL/6J spectra into ones indistinguishable from those of DBA/2J melanosomes (Figure 4B), thus providing a genetic explanation for the XANES spectral differences between these strains. The spectra of melanosomes of F1 mice resulting from a cross of C57BL/6J and B6.D2- Tyrp1bGpnmbR150X /Sj mice were similar to C57BL/6J melanosomes (Figure 4C), indicating that influence of Gpnmb and Tyrp1 mutation are limited to the recessive condition.
Figure 4.

XANES spectra obtained for melanosomes with combined Gpnmb and Tyrp1 mutation identify the basis for spectral differences between melanosomes of C57BL/6J and DBA/2J mice. (A) Significant spectral changes at 284–285 eV and 285–287 eV. (B) Recapitulation of DBA/2J spectral phenotypes in melanosomes from B6.D2-Tyrp1bGpnmbR150X/Sj mice. (C) Lack of phenotype in F1 mice heterozygous for the Tyrp1b and GpnmbR150X mutations. Normalized spectra, mean ± 1 standard deviation; Student’s two-tailed t-test (A & C compared to C57BL/6J; B compared to B6.D2-Tyrp1bGpnmbR150X/Sj) with significance set at 0.05 (red bar); n = number of fields analyzed per genotype.
XANES phenotypes can be used to classify melanosomal proteins into functional groups
Having demonstrated that discrete genetic variations can cause readily identifiable spectral phenotypes in melanosomes, it suggested that XANES might be used more broadly to order additional melanosome-influencing genes into discrete functional groupings based upon the spectral phenotypes. To begin assessing this possibility, we examined melanosomes from B6(Cg)-DctSlt-lt3J/J mice homozygous for the DctSlt-lt3J mutation. Dct encodes DOPAchrome tautomerase, the enzyme that converts DOPAchrome to 5,6-dihydroxyindole-2-carboxylic acid (Tsukamoto et al., 1992). Thus, DCT creates the substrate for TYRP1. Like Tyrp1b, DctSlt-lt3J leads to a change in coat color and causes iris pigment dispersion (Anderson et al., 2008a). As expected for genes sharing this epistatic relationship, spectra of melanosomes from mice with the DctSlt-lt3J or Tyrp1b mutations were indistinguishable (Figure 5). This result is consistent with the biochemically-based hierarchical ordering of these enzymes into a pathway, and provides a proof of principle that XANES spectra can be used to classify melanosomal proteins into functional groups.
Figure 5.

XANES spectra reveal that melanosomes from mice with Tyrp1 or Dct mutation phenocopy one another. Normalized spectra, mean ± 1 standard deviation; Student’s two-tailed t-test (compared to B6.D2-Tyrp1b/Sj) with significance set at 0.05 (red bar); n = number of fields analyzed per genotype.
Discussion
Building on the widespread success of techniques such as X-ray crystallography, the STXM is one of a number of instruments that applies the power of synchrotron-based imaging to biological samples. Using a STXM, we previously identified XANES spectral differences in melanosomes from two different inbred strains of mice, C57BL/6J and DBA/2J (Anderson et al., 2006a). Here, we have used genetics to identify the loci responsible for these spectral phenotypes. The results demonstrate, for the first time, that GPNMB influences melanosomes. Gpnmb mutation changes the chemical composition of this organelle in different ways depending on whether the GpnmbR150X mutation acts monogenically or digenically with the Tyrp1b mutation. Furthermore, the overall success of using a genetic approach to associate spectral differences with distinct mutations suggests that similar strategies might also be employed to discover additional aspects of organelle biology assessable with nano-imaging technologies.
From the studies of others, multiple functions for GPNMB have been suggested. One hypothesis for GPNMB function emerges from studies of the melanosomal protein PMEL17. This protein is required for formation of the melanosomal matrix, a melanosome-localized structure of amyloid-like fibrils upon which melanin is deposited. GPNMB shares broad homology to PMEL17 (Theos et al., 2005; Weterman et al., 1995), but it is it not yet clear whether this homology includes specifically the PMEL17 regions that are most important for fibril formation (McGlinchey et al., 2009; Watt et al., 2009). GPNMB shares homology to the PKD domains of PMEL17 (Theos et al., 2005), which Watt et al. have proposed to be required for fibril formation (Watt et al., 2009), but lacks homology to the RPT domains of PMEL17 (Theos et al., 2005), which McGlinchey et al. have proposed to be required for fibril formation (McGlinchey et al., 2009). Based on the homology that exists, GPNMB may likewise contribute to the melanosomal matrix. A second hypothesis for GPNMB function comes from molecular studies of Gpnmb transcripts and the encoded proteins. GPNMB produced by melanocytes has been observed to have multiple isoforms and localizations, including melanosomes, the plasma membrane, and a secreted form that is released by ectodomain shedding (Hoashi et al.; Tomihari et al., 2009). These studies suggest that in addition to a potential direct role within melanosomes, the plasma membrane-tethered and/or secreted forms of GPNMB may have roles outside melanosomes or that influence melanosomes indirectly through signaling cascades.
From the current genetic and spectral findings, a connection between TYRP1 and GPNMB function is suggested. With mutant Tyrp1, regardless of Gpnmb genotype, a signature of decreased absorption was consistently observed at 284–285 eV. This finding is consistent with the proposed role of TYRP1 as a biosynthetic enzyme involved in melanin synthesis and also places Tyrp1 in an epistatic relationship to Gpnmb. With mutant Gpnmb, there was a Tyrp1-dependent increase in absorption at 285–287 eV. This relationship suggests that the signature at 285–287 eV involves a product derived from the species responsible for the signature at 284–285 eV. When Gpnmb is mutant, the 285–287 eV product accumulates; when Tyrp1 is mutant, the 285–287 eV product is diminished. These findings demonstrate that Tyrp1-mutant and Gpnmb-mutant phenotypes are linked via alterations to shared chemical species.
While the above genetic correlations to spectra can be assessed with great certainty, it is more speculative to consider potential chemical correlations. While the current data can not point to a single molecule responsible for the given spectral changes, they do support interesting hypotheses. First, the general shape of protein spectra has a gap of decreased absorption in the 285–287 eV range, suggesting that the spectral changes caused by Gpnmb mutation are unlikely to be proteinaceous (Stewart-Ornstein et al., 2007; Zubavichus et al., 2008). Second, the known carbon 1s absorption spectra of quinone derivatives such as p-benzoquinone or hydroquinone have strong peaks in the 285–287 eV range spectral region (Francis and Hitchcock, 1992), suggesting involvement of one or more DOPA derivatives involved as intermediates of melanin production.
In considering the chemical moieties implicated in the current experiments, two caveats are of particular importance. First, like all forms of spectroscopy, chemical signatures giving rise to STXM spectra are not unique. Especially in the context of a complex biological mixture, there are many molecules that could give rise to the differences observed and additional experiments are needed to further test the involvement of suspected molecules. Second, in the current analysis, spectra were normalized according to the strong peak (the π* resonance associated with carboxyl functionalities) at 288–288.5 eV. Thus, the analysis would miss any differences if they existed at 288 eV. The rationale for normalization at 288 eV is that the X1A STXM has high beam noise above 300 eV, making the more traditional post-edge region inaccessible. The carboxylic peak at 288.6 eV is highly characteristic to the carbon K-shell absorption spectra of all typical amino acids and proteins (Stewart-Ornstein et al., 2007; Zubavichus et al., 2005; Zubavichus et al., 2008) and is present in all of our data as a characteristic feature. Thus, the “total protein” signature associated with this peak makes it an attractive, albeit imperfect, means for normalization.
The results of the TEM analysis presented here are also relevant to an understanding of DBA/2J iris phenotypes and pigmentary glaucoma (Anderson et al., 2002). Iridial melanosomes of DBA/2J mice have previously been observed to exhibit several ultrastructural abnormalities that can be detected by TEM (Schraermeyer et al., 2009). The findings presented here indicate that these features are not a consequence of the GpnmbR150X mutation. Rather, the melanosomal abnormalities of DBA/2J mice evident at the level of analysis possible with TEM are likely due to the Tyrp1b mutation, which has long been recognized to cause a flocculent pattern of melanin deposition (Moyer, 1966).
The discordance of results obtained from TEM and XANES points to the potential of synchrotron-based imaging techniques to illuminate subtle phenotypes that cannot be visualized by TEM. Whereas Gpnmb mutation had no phenotype that was discernable by TEM, XANES indicated that Gpnmb influences the chemical composition of melanosomes in a Tyrp1-dependent manner. As is the case with all forms of spectroscopy, identifying the precise molecules responsible for the spectral peaks identified by XANES can be complicated, especially within the complex biological milieu. However, in this study a spectral phenotype exhibited by two different inbred strains of mice was rendered tractable through genetics. Using a similar strategy, genetics and XANES might also be applied to discover new features of a wide range of additional organelles important to human health and disease.
Materials and methods
Animal husbandry
C57BL/6J and DBA/2J mice were obtained from The Jackson Laboratory, Bar Harbor, Maine. Congenic C57BL/6J mice carrying the DBA/2J-derived Tyrp1b mutation (B6.D2-Tyrp1b/Sj), the GpnmbR150X mutation (B6.D2-GpnmbR150X/Sj), or both (B6.D2- Tyrp1bGpnmbR150X/Sj) (Anderson et al., 2006b) were provided by Dr. Simon John of The Jackson Laboratory and subsequently bred at The University of Iowa. The B6(Cg)-DctSlt-lt3J/J strain carries DctSlt-lt3J, a spontaneous mutation that occurred in a strain of C57BL/6J mice at The Jackson Laboratory and was subsequently imported to The University of Iowa (Anderson et al., 2008a). Mice were fed 4% fat diets ad libitum within a housing environment kept at 21°C, with a 12-h light: 12-h dark cycle. All experimental protocols were approved by the Animal Care and Use Committee of The University of Iowa.
Genetic nomenclature
The official full names and symbols of genes in this manuscript include: glycoprotein (transmembrane) nmb, (Gpnmb); tyrosinase-related protein 1, (Tyrp1); dopachrome tautomerase, (Dct); and silver (Si; commonly referred to as Pmel17).
Transmission electron microscopy (TEM) and light microscopy analysis
Eyes were collected from 2 individuals each of 1-month-old C57BL/6J and B6.D2-GpnmbR150X/Sj mice. Samples were fixed in 2.5% glutaraldehyde in 0.1 M sodium cacodylate buffer (pH 7.4) for > 24 hours, rinsed, and post-fixed with 1% osmium tetroxide in 0.1 M sodium cacodylate buffer for 1 hour. Dehydrated samples were subsequently infiltrated overnight with resin (Eponate-12; Ted Pella, Redding, CA) in propylene oxide, embedded, and sectioned. For light microscopy, semi-thin sections were stained with toluidine blue. For TEM (JEM-1230; Joel, Tokyo, Japan), ultra-thin sections were stained with 5% uranyl acetate and Reynold’s lead citrate.
To compare melanosome morphology, TEM images of in situ iris tissue were analyzed (11 fields per strain, including: 4 from the iris stroma, 2 from the border region, and 5 from the iris pigment epithelium). Randomly positioned boxes of equivalent size were cropped from stacks of TEM images using Image J software (Abramoff et al., 2004). Within each field, long and short axes of 10 melanosomes were measured to yield morphology data from 110 melanosomes per strain. For plotting, data were grouped into bins.
XANES analysis of iris melanosomes
Iridial melanosomes purified by sucrose-gradient centrifugation were vitrified and freeze-dried as previously described (Anderson et al., 2006a). XANES investigations were performed using the STXM at the X1A beam line, National Synchrotron Light Source, Brookhaven National Laboratory (Winn et al., 2000). Data were collected at different X-ray energies, forming (x, y, E) stacks typically 50–100 nm in step size. The following spectral settings were used: 280–282 eV, 0.5 eV, 1 msec; 282–292 eV, 0.1 eV, 3–5 msec; and 292–300 eV, 0.5 eV, 4–6 msec. Typical stacks consisted of 200 X 200 pixel images scanned at approximately 125 energy values, yielding total exposure times of approximately 400–700 msec.
Data analysis
In total, XANES spectra were analyzed from 53 different fields of melanosomes. The numbers of fields analyzed per genotype are indicated in each Figure, ranging from 5–11 fields per genotype, and were derived from 2–4 independently prepared samples per genotype. Each sample included the left and right irides of 6 mice. Most fields were from 2–11 month-old-mice; 2 B6.D2-Tyrp1bGpnmbR150X/Sj fields were from 18-month-old mice. Cohorts included male and female mice. The C57BL/6J and DBA/2J data sets represent historical compilations, with portions of 2 of 11 C57BL/6J fields and 2 of 6 DBA/2J fields contributing to a previous report (Anderson et al., 2006a). A typical field contains approximately 10–20 individual melanosomes contributing to the spectral analysis. From spectral stacks, sample drift was corrected using a stack alignment algorithm allowing the determination of point spectra (Lerotic and others 2004). Data were further processed using STXMPy, semiautomatic script set for automated region of interest selection and statistical analysis of XANES data (Haraszti et al., 2010). Intensity images were converted to absorption using a background intensity based on the mean value of the brightest 50% of pixels per image. Data disturbed by line-by-line fluctuations in background intensity were treated with the line absorption algorithm within STXMPy. Spectra were background corrected using a linear regression from 280–282 eV and subsequently normalized by fitting to the strong peak (presumably a π* resonance associated with carboxyl functionalities) in the 287.0–289.0 eV range (Anderson et al., 2006a). Following normalization, spectra of pixels were averaged across individual image fields. To estimate variability, we generated an average of averages calculated from all fields analyzed per genotype. Statistical significance was tested by plotting the P values of the Student’s two-tailed t-test, calculated individually at each energy across each spectrum. Due to poor signal:noise ratios, data above 290 eV were not included.
Acknowledgments
We thank the National Synchrotron Light Source for beam time, Dr. Sue Wirick for support at the beamline and many helpful discussions, and Randy Nessler of the University of Iowa Central Microscopy Research Facility for technical assistance. The Central Microscopy Research Facility is supported by grant CA086862-10 to the Holden Comprehensive Cancer Center from the NIH and National Cancer Institute. Biological aspects of this project were supported by NIH grants to MGA, including grants AR055697 from the National Institute of Arthritis and Musculoskeletal and Skin Diseases, and EY017673 from the National Eye Institute. STXM imaging and associated travel were supported by the German Ministry of Science and Education (BMBF), through grant 05KS7VH1.
References
- Abramoff M, Magelhaes P, Ram S. Image Processing with ImageJ. Biophotonics International. 2004;11:36–42. [Google Scholar]
- Anderson MG, Haraszti T, Petersen GE, Wirick S, Jacobsen C, John SW, Grunze M. Scanning transmission X-ray microscopic analysis of purified melanosomes of the mouse iris. Micron. 2006a;37:689–98. doi: 10.1016/j.micron.2006.03.008. [DOI] [PubMed] [Google Scholar]
- Anderson MG, Hawes NL, Trantow CM, Chang B, John SW. Iris phenotypes and pigment dispersion caused by genes influencing pigmentation. Pigment Cell Melanoma Res. 2008a;21:565–78. doi: 10.1111/j.1755-148X.2008.00482.x. [DOI] [PMC free article] [PubMed] [Google Scholar]
- Anderson MG, Libby RT, Mao M, Cosma IM, Wilson LA, Smith RS, John SW. Genetic context determines susceptibility to intraocular pressure elevation in a mouse pigmentary glaucoma. BMC Biol. 2006b;4:20. doi: 10.1186/1741-7007-4-20. [DOI] [PMC free article] [PubMed] [Google Scholar]
- Anderson MG, Nair KS, Amonoo LA, Mehalow A, Trantow CM, Masli S, John SW. GpnmbR150X allele must be present in bone marrow derived cells to mediate DBA/2J glaucoma. BMC Genet. 2008b;9:30. doi: 10.1186/1471-2156-9-30. [DOI] [PMC free article] [PubMed] [Google Scholar]
- Anderson MG, Smith RS, Hawes NL, Zabaleta A, Chang B, Wiggs JL, John SW. Mutations in genes encoding melanosomal proteins cause pigmentary glaucoma in DBA/2J mice. Nat Genet. 2002;30:81–5. doi: 10.1038/ng794. [DOI] [PubMed] [Google Scholar]
- Bennett DC, Lamoreux ML. The color loci of mice--a genetic century. Pigment Cell Res. 2003;16:333–44. doi: 10.1034/j.1600-0749.2003.00067.x. [DOI] [PubMed] [Google Scholar]
- Boissy RE, Sakai C, Zhao H, Kobayashi T, Hearing VJ. Human tyrosinase related protein-1 (TRP-1) does not function as a DHICA oxidase activity in contrast to murine TRP-1. Exp Dermatol. 1998;7:198–204. doi: 10.1111/j.1600-0625.1998.tb00324.x. [DOI] [PubMed] [Google Scholar]
- Chang B, Smith RS, Hawes NL, Anderson MG, Zabaleta A, Savinova O, Roderick TH, Heckenlively JR, Davisson MT, John SW. Interacting loci cause severe iris atrophy and glaucoma in DBA/2J mice. Nat Genet. 1999;21:405–9. doi: 10.1038/7741. [DOI] [PubMed] [Google Scholar]
- Chi A, Valencia JC, Hu ZZ, Watabe H, Yamaguchi H, Mangini NJ, Huang H, Canfield VA, Cheng KC, Yang F, et al. Proteomic and bioinformatic characterization of the biogenesis and function of melanosomes. J Proteome Res. 2006;5:3135–44. doi: 10.1021/pr060363j. [DOI] [PubMed] [Google Scholar]
- Dessinioti C, Stratigos AJ, Rigopoulos D, Katsambas AD. A review of genetic disorders of hypopigmentation: lessons learned from the biology of melanocytes. Exp Dermatol. 2009;18:741–9. doi: 10.1111/j.1600-0625.2009.00896.x. [DOI] [PubMed] [Google Scholar]
- Francis J, Hitchcock A. Inner-shell spectroscopy of p-benzoquinone, hydroquinone, and phenol: distinguishing quinoid and benzenoid structures. J Phys Chem. 1992;96:6598–6610. [Google Scholar]
- Halaban R, Moellmann G. Murine and human b locus pigmentation genes encode a glycoprotein (gp75) with catalase activity. Proc Natl Acad Sci U S A. 1990;87:4809–13. doi: 10.1073/pnas.87.12.4809. [DOI] [PMC free article] [PubMed] [Google Scholar]
- Haraszti T, Grunze M, Anderson MG. STXMPy: a new software package for automated region of interest selection and statistical analysis of XANES data. Chem Cent J. 2010;4:11. doi: 10.1186/1752-153X-4-11. [DOI] [PMC free article] [PubMed] [Google Scholar]
- Hoashi T, Sato S, Yamaguchi Y, Passeron T, Tamaki K, Hearing VJ. Glycoprotein nonmetastatic melanoma protein b, a melanocytic cell marker, is a melanosome-specific and proteolytically released protein. Faseb J. doi: 10.1096/fj.09-151019. [DOI] [PMC free article] [PubMed] [Google Scholar]
- Kobayashi T, Urabe K, Winder A, Jimenez-Cervantes C, Imokawa G, Brewington T, Solano F, Garcia-Borron JC, Hearing VJ. Tyrosinase related protein 1 (TRP1) functions as a DHICA oxidase in melanin biosynthesis. Embo J. 1994;13:5818–25. doi: 10.1002/j.1460-2075.1994.tb06925.x. [DOI] [PMC free article] [PubMed] [Google Scholar]
- Le Borgne R, Planque N, Martin P, Dewitte F, Saule S, Hoflack B. The AP-3-dependent targeting of the melanosomal glycoprotein QNR-71 requires a di-leucine-based sorting signal. J Cell Sci. 2001;114:2831–41. doi: 10.1242/jcs.114.15.2831. [DOI] [PubMed] [Google Scholar]
- Mcglinchey RP, Shewmaker F, Mcphie P, Monterroso B, Thurber K, Wickner RB. The repeat domain of the melanosome fibril protein Pmel17 forms the amyloid core promoting melanin synthesis. Proc Natl Acad Sci U S A. 2009;106:13731–6. doi: 10.1073/pnas.0906509106. [DOI] [PMC free article] [PubMed] [Google Scholar]
- Moyer FH. Genetic variations in the fine structure and ontogeny of mouse melanin granules. Am Zool. 1966;6:43–66. doi: 10.1093/icb/6.1.43. [DOI] [PubMed] [Google Scholar]
- Petibois C, Cestelli Guidi M. Bioimaging of cells and tissues using accelerator-based sources. Anal Bioanal Chem. 2008;391:1599–608. doi: 10.1007/s00216-008-2157-y. [DOI] [PubMed] [Google Scholar]
- Schraermeyer M, Schnichels S, Julien S, Heiduschka P, Bartz-Schmidt KU, Schraermeyer U. Ultrastructural analysis of the pigment dispersion syndrome in DBA/2J mice. Graefes Arch Clin Exp Ophthalmol. 2009;247:1493–504. doi: 10.1007/s00417-009-1146-y. [DOI] [PubMed] [Google Scholar]
- Simon JD, Peles D, Wakamatsu K, Ito S. Current challenges in understanding melanogenesis: bridging chemistry, biological control, morphology, and function. Pigment Cell Melanoma Res. 2009;22:563–79. doi: 10.1111/j.1755-148X.2009.00610.x. [DOI] [PubMed] [Google Scholar]
- Steingrimsson E, Copeland NG, Jenkins NA. Mouse coat color mutations: from fancy mice to functional genomics. Dev Dyn. 2006;235:2401–11. doi: 10.1002/dvdy.20840. [DOI] [PubMed] [Google Scholar]
- Stewart-Ornstein J, Hitchcock A, Hernandez C, Henklein P, Overhage J, Hilpert K, Hale J, Hancock R. Using intrinsic X-ray absorption spectral differences to identify and map peptides and proteins. J Phys Chem B. 2007;111:7691–7699. doi: 10.1021/jp0720993. [DOI] [PubMed] [Google Scholar]
- Theos AC, Truschel ST, Raposo G, Marks MS. The Silver locus product Pmel17/gp100/Silv/ME20: controversial in name and in function. Pigment Cell Res. 2005;18:322–36. doi: 10.1111/j.1600-0749.2005.00269.x. [DOI] [PMC free article] [PubMed] [Google Scholar]
- Tomihari M, Hwang SH, Chung JS, Cruz PD, Jr, Ariizumi K. Gpnmb is a melanosome-associated glycoprotein that contributes to melanocyte/keratinocyte adhesion in a RGD-dependent fashion. Exp Dermatol. 2009;18:586–95. doi: 10.1111/j.1600-0625.2008.00830.x. [DOI] [PMC free article] [PubMed] [Google Scholar]
- Trantow CM, Hedberg-Buenz A, Iwashita S, Moore SA, Anderson MG. Elevated oxidative membrane damage associated with genetic modifiers of lyst-mutant phenotypes. PLoS Genet. 2010;6:e1001008. doi: 10.1371/journal.pgen.1001008. [DOI] [PMC free article] [PubMed] [Google Scholar]
- Tsukamoto K, Jackson IJ, Urabe K, Montague PM, Hearing VJ. A second tyrosinase-related protein, TRP-2, is a melanogenic enzyme termed DOPAchrome tautomerase. Embo J. 1992;11:519–26. doi: 10.1002/j.1460-2075.1992.tb05082.x. [DOI] [PMC free article] [PubMed] [Google Scholar]
- Watt B, Van Niel G, Fowler DM, Hurbain I, Luk KC, Stayrook SE, Lemmon MA, Raposo G, Shorter J, Kelly JW, et al. N-terminal domains elicit formation of functional Pmel17 amyloid fibrils. J Biol Chem. 2009 doi: 10.1074/jbc.M109.047449. [DOI] [PMC free article] [PubMed] [Google Scholar]
- Weterman MA, Ajubi N, Van Dinter IM, Degen WG, Van Muijen GN, Ruitter DJ, Bloemers HP. nmb, a novel gene, is expressed in low-metastatic human melanoma cell lines and xenografts. Int J Cancer. 1995;60:73–81. doi: 10.1002/ijc.2910600111. [DOI] [PubMed] [Google Scholar]
- Winn BHA, Buckley C, Feser M, Howells M, Hulbert S, Jacobsen C, Kaznacheyev K, Kirz J, Osanna A, et al. Illumination for coherent soft X-ray applications: the new X1A beamline at the NSLS. J Synchrotron Rad. 2000;7:395–404. doi: 10.1107/S0909049500012942. [DOI] [PubMed] [Google Scholar]
- Zdarsky E, Favor J, Jackson IJ. The molecular basis of brown, an old mouse mutation, and of an induced revertant to wild type. Genetics. 1990;126:443–9. doi: 10.1093/genetics/126.2.443. [DOI] [PMC free article] [PubMed] [Google Scholar]
- Zubavichus Y, Shaporenko A, Grunze M, Zharnikov M. Innershell absorption spectroscopy of amino acids at all relevant absorption edges. J Phys Chem A. 2005;109:6998–7000. doi: 10.1021/jp0535846. [DOI] [PubMed] [Google Scholar]
- Zubavichus Y, Shaporenko A, Grunze M, Zharnikov M. Is X-ray absorption spectroscopy sensitive to the amino acid composition of functional proteins? J Phys Chem B. 2008;112:4478–4480. doi: 10.1021/jp801248n. [DOI] [PubMed] [Google Scholar]